
About the author: Lily L. Batchelder is a professor of law and public policy at New York University School of Law.
Wealth transfer taxes are a critical policy tool for mitigating economic inequality, including inequality of opportunity. They are also relatively efficient. This essay summarizes why and how wealth transfer taxes should be strengthened. Reform options that our next President should consider include increasing the wealth transfer tax rate, broadening the base, repealing stepped-up basis, addressing talking points against wealth transfer taxes with little or no factual basis, and converting the estate and gift taxes into a direct tax on the recipients of large inheritances.
Why wealth transfer taxes should be preserved and expanded
For those concerned about economic inequality, taxing wealth transfers is a critical policy tool, mitigating inequality in ways that other taxes cannot. Inheritances represent roughly 40 percent of all wealth1 and about 4 percent of annual household income.2 Bequests alone total about $500 billion per year.3
There are two types of inequality that policymakers should care about. The first is within-generation disparities in income, wealth, or other measures of economic well-being. Both income and wealth inequality are extremely high in the United States. The top 1 percent of households receives 15 percent of all income and holds 35 percent of all wealth.4 Wealth transfers increase within-generation inequality on an absolute basis (See Figure 1), but not on a relative basis. This is because of what economists call regression to the mean.5 Someone who earns $100 million per year, for example, is likely to have a child whose income is slightly lower, even including the child’s inheritance. Conversely, someone who earns $10,000 per year is likely to have a child whose income is slightly higher than her own.
Figure 1
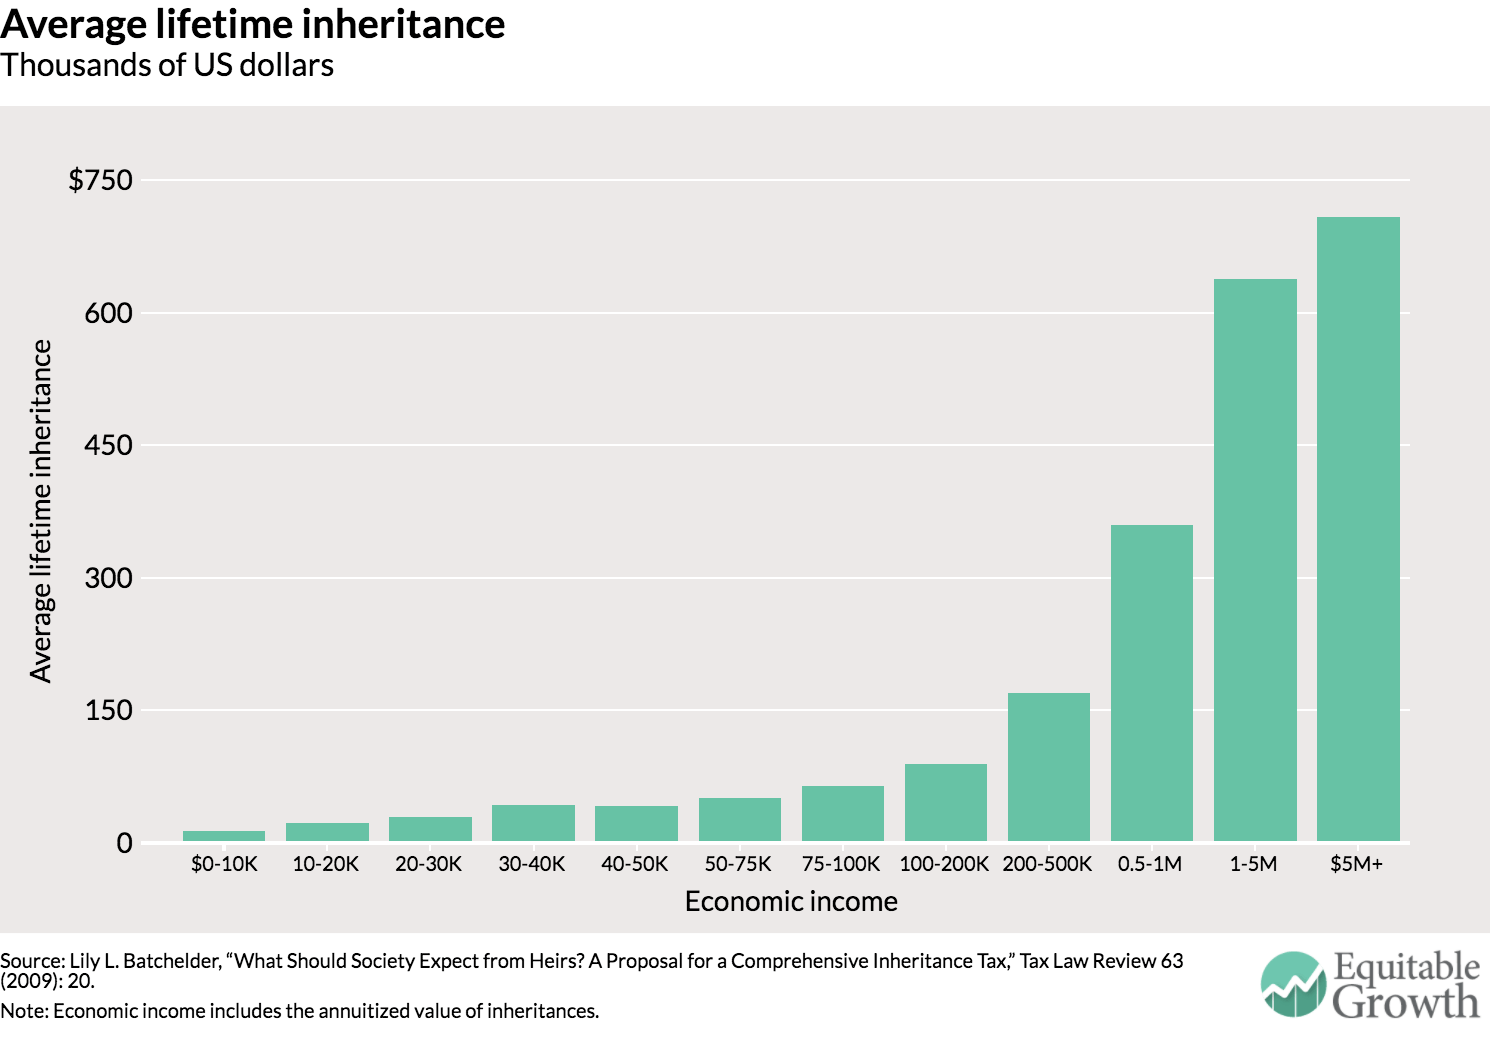
But equally important is a second type of inequality: inequality of economic opportunity. A child whose parents earn $100 million will, on average, be radically better off than a child whose parents earn $10,000. The United States has one of the highest levels of opportunity inequality among its competitors.6 In the United States, a father on average passes on roughly half of his economic advantage or disadvantage to his son. Among most of our competitors, the comparable figure is less than one-third, and for several it is less than one-fifth.7
Previous article: Consumer credit, Kyle Herkenhoff and Gordon Phillips
Next article: Monetary policy, Alan Blinder
Financial inheritances worsen this inequality of life chances dramatically. Indeed, 30 percent of the correlation between parent and child incomes—and more than 50 percent of the correlation between the wealth of parents and the wealth of their children— is attributable to financial inheritances.8 This is more than the impact of IQ, personality, and schooling combined.
Increasing the progressivity of income and payroll taxes would go a long way toward addressing both of these types of inequality.9 But it would leave significant holes if not accompanied by stronger taxes on wealth transfers. Under current law, for example, if a wealthy individual bequeaths assets with $100 million in unrealized gains, neither the donor nor the heir ever has to pay income or payroll tax on that $100 million gain. In addition, the recipients of large inheritances never have to pay income or payroll tax on the value of inheritances they receive, whether attributable to unrealized gains or not.10
Some argue that any income or payroll tax previously paid by a wealthy individual on gifts and bequests they make should count as tax paid by the heir. But they are two separate people. When a wealthy individual pays his assistant’s wages out of after-tax funds, we don’t think the assistant has thereby paid tax on their own wages. In short, today the income and payroll taxes effectively tax unearned income in the form of inheritances at a zero rate.
Wealth transfer taxes play an important role in partially addressing this inequity of excluding inherited income from the income and payroll tax bases.11 But inherited income is still taxed at less than one-quarter of the rate on income from work and savings. (See Figure 2.)
Figure 2
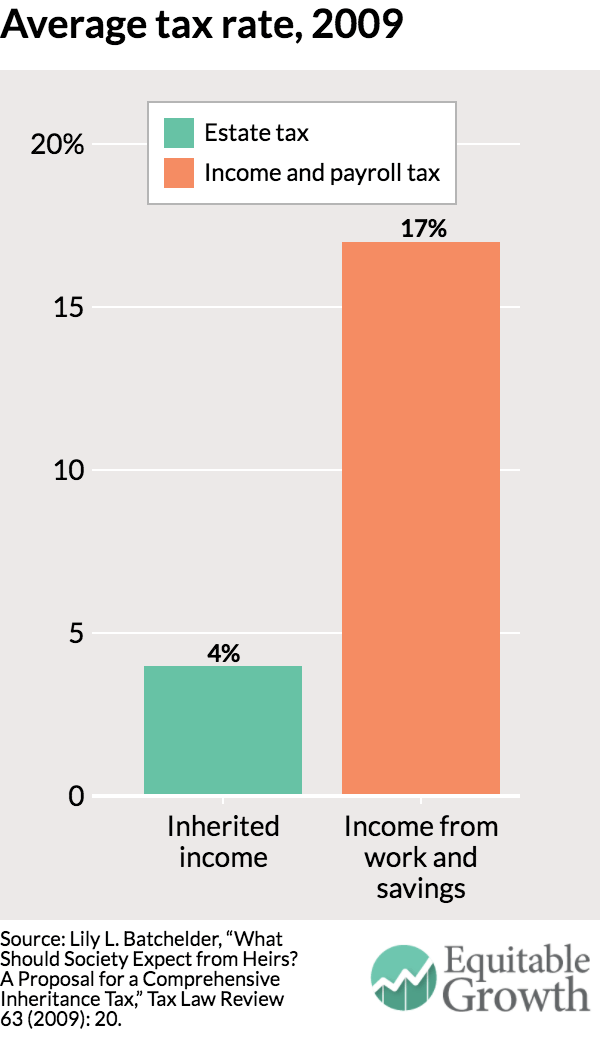
A fairer tax system would tax income in the form of large inheritances at a higher rate than income from work. Recipients of large inheritances are better off than people who earn the same amount of money by working. In economist-speak, they have no “opportunity cost;” they have not had to give up any leisure or earning opportunities in order to receive the inheritance. All else equal, it is therefore fairer for them to pay more taxes, not less. But all else is not equal. Heirs of large inheritances also typically have a huge leg up in earning income if they choose to work—with access to the best education, influential family friends, interest-free or low-interest loans, and a safety net if they take risks that don’t pan out. This further strengthens the case for taxing inheritances at a higher rate.
More progressive income and payroll taxes cannot address this inequity in the tax system and ensure that large inheritances are taxed at higher rates than wage income.12 The same is true of proposals to adopt a tax on wealth as opposed to wealth transfers.
Importantly, bipartisan experts agree that wealth transfer taxes are largely borne by the heirs of large estates, not their benefactors.13 As a result, it would be more accurate to call wealth transfer taxes “silver spoon” taxes, not “death” taxes as their opponents prefer.
In addition to playing a critical role in making the tax system fairer, wealth transfer taxes are relatively efficient. It is an article of faith among estate tax opponents that wealth transfer taxes harm the economy because they discourage work and saving among very wealthy individuals. But in order to have these effects, the wealthy would need place a high value on the amount their heirs will inherit after-tax when making work and saving decisions. In fact, a large body of empirical research finds this is not the case, and that the amount that the affluent accumulate for wealth transfers is relatively unresponsive to the wealth transfer tax rate.14
People with very large estates typically have saved for multiple reasons. They may enjoy being wealthy, with the prestige and power that it confers while they are alive. They may have saved to have enough for their retirement needs, including unanticipated health expenses. And they may, of course, have saved to give to their children. But the empirical evidence to date suggests the first two motivations are so strong that the wealthy do not reduce their saving by all that much if they expect their estate to be taxed at a high rate. Put differently, a lot of the reason why people save is to have wealth while they are alive, which wealth transfer taxes do not affect.
Moreover, any negative incentive effects of wealth transfer taxes on wealthy donors are at least partially offset by their positive incentive effects on the next generation. Such taxes induce heirs to work and save more because heirs do not have as large an inheritance to live off of as a result.15 Wealth transfer taxes also improve business productivity. Several studies have found that businesses run by heirs perform worse because nepotism limits labor market competition for the best manager.16
For all these reasons, wealth transfer taxes may be more efficient than comparably progressive income and wealth taxes17—in addition to playing a unique role in mitigating inequality of economic opportunity.
How to strengthen wealth transfer taxes
There are two main components of the wealth transfer tax system: the estate tax on bequests and the gift tax on wealth transfers made during life.18 In 2016, transferors are entitled to a lifetime exemption of $5.45 million ($10.9 million per couple). If their combined gifts and bequests exceed this threshold, the excess is taxed at a rate of 40 percent. Transferors also can exclude $14,000 in gifts each year to a given heir from ($28,000 per couple), meaning such gifts don’t even count toward the lifetime exemption. Currently only 0.2 percent of estates owe any estate tax.19
Option #1: raise the rate
The simplest way to strengthen wealth transfer taxes would be to raise the rate. Restoring the 2009 estate tax parameters (a $3.5 million exemption and a 45 percent rate) would raise $160 billion over 10 years.20 Also raising the rate to range from 50 percent to 65 percent to the extent that estates exceed $10 million to $1 billion would raise about $235 billion over 10 years instead.21
At a minimum, large inheritances should be taxed at the top marginal tax rate that applies to labor income—roughly 50 percent when one includes state and local income taxes.22 But a higher rate would be fairer and more efficient. The optimal tax rate on extremely large inheritances is estimated to be between 50 percent and 80 percent.23
Reducing the lifetime exemption amount also is worth considering, but it should be a lower priority. A higher rate focuses wealth transfer taxes on the wealthiest heirs and limits compliance costs.
Option #2: replace the estate and gift taxes with an inheritance tax
A more fundamental improvement would be to replace the estate and gift taxes with an inheritance tax. The lifetime exemption for the estate and gift taxes applies to the amount transferred, not the amount inherited by the heir. Suppose Richie Rich is an only child and receives $5 million in bequests from each of his parents and stepparents. Under current law, the $20 million he inherits is exempt from estate and income taxes because each bequest is under the exemption. But under an inheritance tax, the exemption would be based on how much he receives instead.
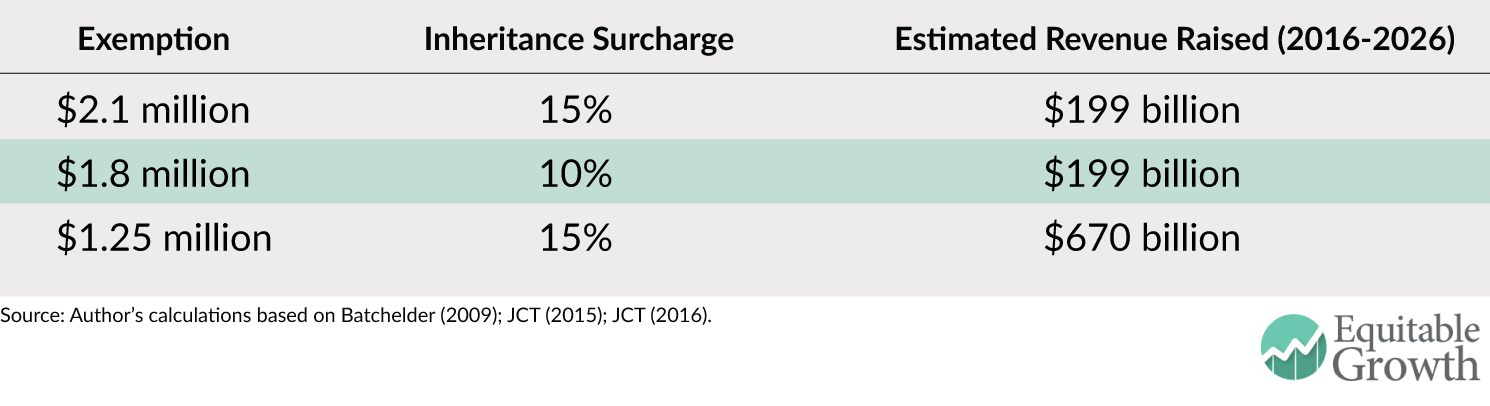
I propose requiring heirs of large inheritances to pay income tax plus an inheritance surcharge on amounts they inherit above a large lifetime exemption. If the lifetime exemption were $2.1 million and the surcharge were 15 percent (roughly equal to the maximum payroll tax rate) then such an inheritance tax would raise roughly $200 billion more over 10 years than the current estate tax. Dialing the rates up or the exemption amount down could raise more revenue. (See Figure 3.)24 To state the obvious, $2.1 million is a lot of money. An individual who inherits $2.1 million at age 21 can live off her inheritance for the rest of her life without anyone in her house ever working and, on average, her annual household income will still be higher than about 7 out of 10 American families.25
Figure 3
There are several advantages of an inheritance tax relative to an estate tax. First, it would more equitably allocate wealth transfer taxes among heirs. Both types of taxes are borne by wealthy heirs and not their benefactors. But not all large inheritances come from the largest estates, and some small inheritances come from relatively large estates.
In addition, the type of inheritance tax outlined here would apply different rates to heirs based on their total income. As a result, about 30 percent of the burden of the inheritance tax in dollar terms would fall on different heirs than under a revenue-equivalent estate tax.26 While roughly one-third of heirs burdened by the estate tax have inherited less than $1 million, none would owe any inheritance tax.27
These differences should not be taken as a fundamental critique of the estate tax. It is overwhelmingly borne by the recipients of large inheritances: Less than 4 percent of the revenue comes from individuals inheriting less than $1 million. Its burdens are just allocated among the recipients of large inheritances less precisely than under an inheritance tax.
A second, and perhaps even more important, advantage of an inheritance tax is that it could better align public understanding of wealth transfer taxes with their actual economic effects. The structure of an estate tax makes it easy for opponents to characterize it as a double tax on the frugal, generous entrepreneur who just wants to take care of his family after his death. In fact, nothing could be further from the truth. The estate tax is actually the only tax that that ensures wealthy heirs pay at least some tax on their large inheritances—even if at a much lower rate than their personal assistants. But this imagery is powerful. Perhaps as a result, most countries around the world that historically had estate taxes have repealed them, while those with inheritance taxes have not.28
The structure of an inheritance tax makes the inequities of our current system clearer. It simply requires wealthy heirs to pay income tax on their large inheritances just as all American workers pay tax on their earnings. Even with a surcharge, wealthy heirs would still typically pay a lower rate of tax on their inherited income than workers pay on a similar amount of labor income because of the large exemption, which workers cannot claim on their wages.
There are ancillary advantages of an inheritance tax as well. It would be simpler because it permits a wait-and-see approach for split and contingent transfers, rather than requiring taxpayers and the Internal Revenue Service to guess upfront what portion of the transfer will ultimately go to tax-exempt individuals or charities. At the margin, it could induce the wealthy to share their estates more broadly. And it is clearly administrable. Inheritance taxes are far more common than estate taxes cross-nationally.29
Option #3: repeal stepped-up basis
Regardless of whether the estate tax is expanded or replaced with an inheritance tax, policymakers should repeal stepped-up basis.30 This is the provision that completely exempts all accrued gains on bequeathed assets from income and payroll taxes, by “stepping up” the basis of asset to its fair market value when it is transferred.
President Obama has proposed repealing stepped-up basis, subject to several carve-outs including an exemption for the first $100,000 in accrued gains ($200,000 per couple).31 Together with raising the capital gains rate to 28 percent, this proposal would raise $210 billion over 10 years and significantly more over time as it fully phases in.32 While not technically an estate or gift tax reform, repealing stepped-up basis would accomplish all the same objectives as strengthening those taxes. It is highly progressive because inheritances are distributed so unequally and accrued gains are distributed even more unequally.33
The U.S. Department of the Treasury estimates that 99 percent of the revenue raised would come from the top 1 percent and 80 percent from the top 0.1 percent.34 It helps ensure that large inheritances are taxed at a rate closer to income from working. And it is highly efficient. Indeed, repealing stepped-up basis is even more efficient than raising wealth transfer tax rates because it reduces current law’s “lock-in” incentives to hold on to underperforming assets purely for tax reasons.
If repealing stepped-up basis is not an option then the next best solution would be to apply carryover basis to bequests.35 This would allow heirs to delay paying income tax on accrued gains on their inheritances indefinitely. But heirs would at least need to pay the associated income tax when they ultimately sell the asset. As a result, it would reduce lock-in incentives, but not by nearly as much as stepped-up basis repeal. It would also raise significantly less revenue.36
Option #4: broaden the wealth transfer tax base
A number of smaller reforms to broaden the wealth transfer tax base should also be pursued. Many of these proposals, such as limiting gaming around grantor-retained annuity trusts, are in President Obama’s budget. Together, these budget proposals would raise $17 billion over 10 years.37 The next President should also finalize the current Administration’s recently issued regulation addressing loopholes using valuation discounts, and ensure that Congress does not repeal it.38
An additional option worth considering is harmonizing the tax treatment of gifts and bequests. Currently gifts are often tax-advantaged because of the annual gift tax exclusion, the lack of present-value adjustments when calculating the lifetime exemption, and the fact that the top rate on very large gifts is effectively 29 percent, compared to 40 percent for bequests.39 Cutting the other way, bequests are tax-advantaged because they are eligible for stepped-up basis while gifts are not. These countervailing incentives create substantial tax planning costs, traps for the unwary, and inequities between similarly situated heirs. These problems could be largely addressed by repealing stepped-up basis, indexing the value of gifts to a market interest rate when calculating the lifetime exemption, and taxing gifts at the same rate as bequests.40
Option #5: address strawman arguments against wealth transfer taxes
Finally, policymakers should consider addressing talking points against wealth transfer taxes that resonate but have little or no basis in fact. A prime example is family farms. A principal rallying cry against the estate tax has long been that it forces families to sell their farms. But neither the American Farm Bureau nor The New York Times has been able to identify a single instance of this happening, even when the exemption was much lower.41
To counter this argument, one option is to adopt the proposal by former Senate Finance Committee Chairman Baucus (D-MT) to allow taxpayers to defer indefinitely any estate tax payments due on farm land at a market interest rate, provided the farm continues to be actively managed by the family.42 Because it is so rare for such farms and ranches to be subject to the estate tax, the proposal would only cost $5 billion over 10 years.43
To be clear, this proposal should only be considered if it is includes all the guardrails in the full Baucus proposal and interest accrues at a market interest rate. Otherwise, it could become a large loophole and reduce the number of farms owned and actively managed by families as opposed to passive investors in large corporations.
Conclusion
Wealth transfer taxes play a critical role in mitigating economic disparities, especially inequality of opportunity. The proposals offered here would soften the relative advantages of being born at the very top while leaving more than 99 percent of financial gifts and bequests unaffected.44
At the same time, these reforms options would raise a significant amount of revenue that could be used to mitigate the barriers to economic mobility that children from low- and middle-income families face. Effectively, they could fund a form of social inheritance through investments that partially make up for such families being unable to fund large financial wealth transfers to their children. The hundreds of billions of dollars raised could be used to fund universal pre-Kindergarten, expand the child tax credit for low- and middle-income working parents with young children, or increase the wage subsidy provided by the Earned Income Tax Credit for childless, frequently young adults. These proposals are estimated to significantly improve infant health, heighten academic achievement, boost labor force participation, and increase lifetime earnings for children from relatively disadvantaged backgrounds.45
President Franklin Delano Roosevelt once said “inherited economic power is as inconsistent with the ideals of this generation as inherited political power was inconsistent with the ideals of the generation which established our government.” The same could be said today. Rather than falling near the bottom among our competitors on this score, we can recommit to creating a society where one’s financial success depends relatively little on the circumstances of one’s birth. A first step is to start taxing extraordinarily large inheritances like we tax good, old hard work.
(I am grateful to Len Burman, Michael Graetz, Chye-Ching Huang, and Wojciech Kopczuk for helpful suggestions. All errors are mine.)


