The Tax Foundation’s treatment of the estate tax in its macroeconomic model

I recently wrote a critique of the Tax Foundation’s macroeconomic model in the context of the organization’s score of the Tax Cuts and Jobs Act as introduced by House Committee on Ways and Means Chairman Kevin Brady. In that critique, I identified two flaws in the Tax Foundation model. First, the interaction between federal and state corporate income taxes in the model was—at the time the critique was published—incorrect. Second, the organization’s approach to modeling the estate tax is incorrect and, moreover, inconsistent with other assumptions made in its modeling.

The Tax Foundation subsequently acknowledged the first error. However, the organization also published a response in which the authors assert that the organization’s approach to modeling the estate tax is reasonable. In this note, I evaluate the Tax Foundation’s response to my critique and conclude that it does not justify the organization’s current modeling approach. There appear to be important flaws in the Tax Foundation’s treatment of the estate tax that affect every dynamic score the organization has produced for the Tax Cuts and Jobs Act.

As noted in the original piece, I am unable to offer a complete assessment of the Tax Foundation model, which would require information about the equations that make up the model that is not publicly available. I continue to have substantial concerns about the Tax Foundation model beyond those described in the original piece or this update. These concerns are not merely about the appropriateness of the individual assumptions the Tax Foundation relies on in its modeling, but also about whether the seemingly ad hoc collection of equations that make up the Tax Foundation model form a coherent whole. The Tax Foundation’s response to my concerns about its modeling of the estate tax highlights the importance of this second concern.

The Tax Foundation’s assertion that the marginal investor is subject to U.S. taxes on savings likely cannot be reconciled with its small open economy assumption

The most striking element of the Tax Foundation’s response regarding the estate tax is its assertion that the marginal investor in the U.S. capital stock is a domestic investor and thus subject to U.S. taxes on saving. That assumption is consistent with a closed economy, or one in which there are no international capital flows or trade. In a closed economy, domestic investment is necessarily financed entirely by domestic savings.

Yet the Tax Foundation has repeatedly endorsed the idea that the United States is appropriately modeled as a small open economy. In a small open economy model, there is no necessary relationship between domestic investment and domestic savings, as any required funds can be obtained from investors abroad. The classic small open economy model is thus one in which the marginal investor is foreign. As a result, the rate of return on investment (after accounting for taxes imposed at the business level) is determined by global capital markets and is unrelated to the particular circumstances of the domestic economy. There is an obvious tension between the assumption that the marginal investor is domestic and the assumption that the United States is a small open economy.

The Tax Foundation justifies this inconsistency on the grounds that the marginal business investment is higher risk and foreign investors are relatively more risk averse. Thus, even though foreign investors could invest in U.S. business assets, they choose not to do so. The Tax Foundation further asserts that in response to a reduction in the tax rate on capital income foreign investors increase their holdings of low-risk U.S. assets, such as government debt, and domestic investors shift into higher risk assets, such as corporate stock. As a result, the Tax Foundation explains, “the United States can have strong financial inflows while the marginal investor remains a domestic investor.”

Notably, this justification for the assumption that the marginal investor is domestic even as the rate of return is fixed—because the United States is appropriately modeled as a small open economy—appears to exist entirely outside its model. As best I can determine from the information publicly available, the Tax Foundation model itself appears to include no explicit model of markets in government debt (or other low-risk assets), the composition of savers’ portfolios, and the allocation of assets between domestic and foreign investors. Thus, while the Tax Foundation asserts that a difference in risk tolerance between domestic and foreign investors justifies its modeling assumptions, it is simply impossible to consider these issues rigorously in the organization’s macroeconomic model.

Notwithstanding the impossibility of a direct assessment of these issues in the Tax Foundation’s model, a model that seriously grapples with these issues would likely work quite differently from what the Tax Foundation suggests, for at least two key reasons:

  • If the marginal investor is domestic then the supply of capital is likely to be far less elastic that the Tax Foundation assumes. If domestic savers are the sole source of funds for business investment at the margin, then reference to the global supply of savings is not sufficient to justify a fixed after-tax return on that investment—the cornerstone of the Tax Foundation’s modeling approach. Instead, the relevant question is whether domestic investors are willing to provide the necessary capital and at what return. Moreover, if business investment is riskier than other types of investment, then it suggests that domestic investors would require a higher return to compensate them for taking on that risk as they increase their investment in these relatively higher-risk assets. (A precise evaluation of the latter issue would require a model of the supply of savings in which the potential impact of changes in wealth on risk aversion and other issues could be weighed against the effect of an increased exposure to higher-risk assets.)
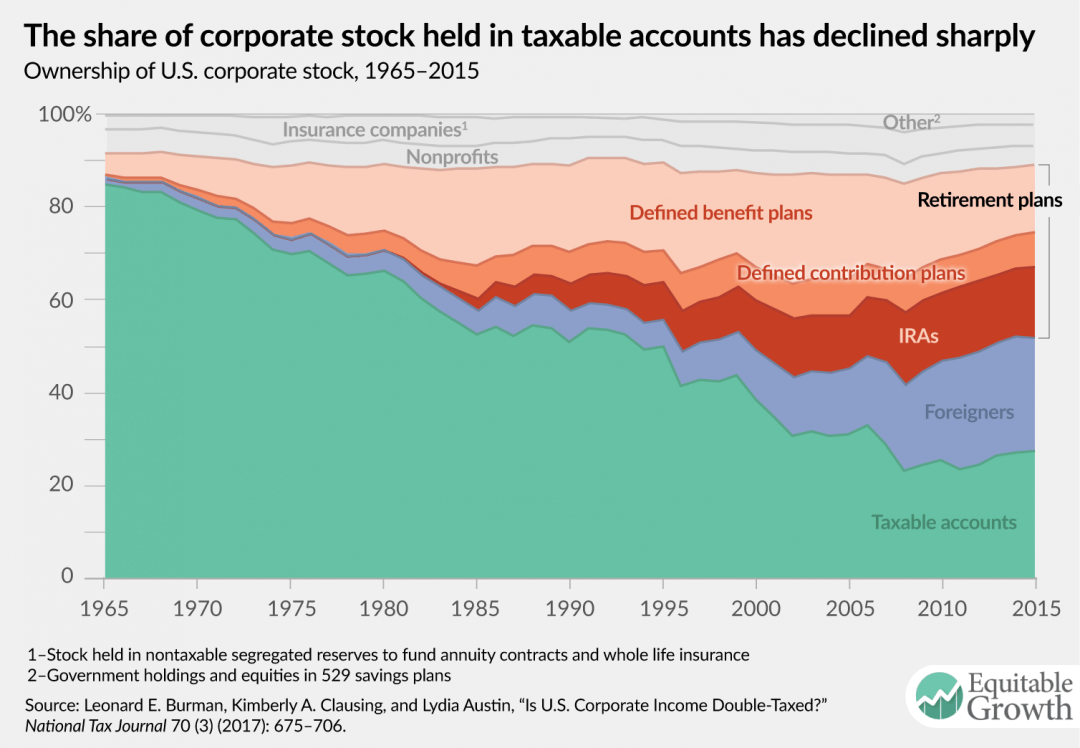
  • The claim that foreign investors are never marginal for business investment decisions is empirically untenable. The assumption that foreign investors are unwilling to invest in relatively higher-risk assets regardless of the differential between the U.S. return on investment and the foreign return is difficult to justify. In the Tax Foundation’s model, this differential appears to be large and determined solely by the parameters of the U.S. tax code. Yet recent empirical analysis suggests not only that foreigners own U.S. corporate equity, but also that the share of corporate equity owned by foreigners has grown markedly in recent years. In addition, the U.S. corporate sector includes foreign-parented firms. The implicit assumption that foreign-parented firms are unable to access capital abroad is likewise difficult to justify.

In short, the Tax Foundation assumes a fixed after-tax return consistent with a small open economy model, assumes an effective marginal tax rate consistent with a closed economy model, and explains the inconsistency between these two assumptions by reference to an argument about risk and ownership that appears to exist only outside its model and that suffers from at least two major weaknesses.

The Tax Foundation’s response thus raises the question of whether a rigorous justification for the apparently ad hoc collection of equations that make up the model has been—or even can be—constructed.1

The Tax Foundation’s response does not justify its assumption that the estate tax affects the marginal investor

The Tax Foundation model features homogeneous capital. In other words, there is nothing unique about assets held by one business relative to those held by others or about the capital provided by one investor relative to another. If capital is homogeneous, then there is no reason the marginal supplier of capital is necessarily subject to the estate tax. This is particularly true if the marginal investor is foreign, as would be the case in a small open economy model. But it can also be the case if the marginal investor is domestic, as in a closed economy model or as the Tax Foundation suggests.

Suppose all individuals discount future consumption at the same rate (an assumption broadly consistent with the style of modeling the Tax Foundation adopts), the supply of savings is infinitely elastic (as the Tax Foundation would likely need to assume to justify its other results), and only a small minority of the population with wealth far above average is affected by the estate tax (as is the case in practice). Then the estate tax would likely not be marginal to the supply of capital even in a closed economy model. In such a model, the estate tax would cause some households to reduce their savings, but other households would be willing to increase their savings to exactly offset this reduction, leaving the overall supply of savings and the return to the marginal investment unchanged on net. The marginal investment, therefore, would be financed by an investor who is not subject to the estate tax.

The Tax Foundation’s response on this point ignores the fundamental issue. The Tax Foundation explains how the estate tax can affect financial incentives for a hypothetical household and, therefore, may affect that household’s savings decisions. Yet the issue I raised—and the one that matters for the effect of the estate tax on the economy—is whether and how changes in behavior by households translate into a change in the equilibrium rate of return, the return that generally prevails in financial markets. As the example above illustrates, the mere fact that the estate tax affects the incentives of a given household does not necessarily imply that the estate tax has any effect on the equilibrium return.

Thus, when the Tax Foundation incorporates an average estate tax rate into its cost-of-capital formula, it is making implicit assumptions about the distribution of the increase in domestic savings that would finance an increase in the capital stock and whether those assets are held at death (probabilistically). These are the assumptions in question. The Tax Foundation’s response does not discuss these assumptions and is thus inadequate to address the issue I raised.

The weakness of the response may reflect that (as noted above) the Tax Foundation appears not to explicitly model the sources of savings in any way. If this is the case, then the Tax Foundation cannot justify its assertions about the source of savings as they relate to the relevance of the estate tax in its model because the model does not address these issues.

The Tax Foundation’s justification for treating the estate tax as a nondeductible property tax paid by businesses is incorrect

Finally, there is the issue of treating the estate tax as a nondeductible property tax paid by businesses. As I discussed in my original critique, this treatment can generate spurious interactions between the statutory corporate tax rate and the estate tax rate that could cause the Tax Foundation to overstate the growth that would result from a reduction in the statutory corporate tax rate.

In response, the Tax Foundation argues that because the estate tax is akin to a property tax and because the estate tax is not deductible against income taxes, it is appropriate to model it as a property tax paid by businesses that is not deductible against the corporate income tax. This argument is incorrect because it ignores the distinction between a property tax paid by individuals and a property tax paid by businesses.

If, as the Tax Foundation asserts, it is appropriate to model the estate tax as a property tax paid by individuals, then the estate tax would increase the equilibrium rate of return required by investors in financial markets. The estate tax would thus have a negative impact on the capital stock, but would not interact with the statutory corporate tax rate in the manner that it currently does in the Tax Foundation model. A modeling approach that treats the estate tax as a property tax paid by individuals would not generate the spurious interaction I identified in my critique because decisionmakers within a firm would not analyze potential investments under the assumption that the firm itself pays the estate tax.2

The Tax Foundation itself acknowledges this issue elsewhere in its response to my critique. The Tax Foundation states that as “estate taxes are not paid by the firm, they only affect the discount rate of the individual.” In contrast, in their modeling, the Tax Foundation treats the estate tax as having no effect on individual discount rates and a direct effect on the investment decisions made by firms that behave as if they pay the estate tax. These two approaches are not equivalent.

Conclusion

A complete assessment of the Tax Foundation model is not possible given the limited information about the model available. Nevertheless, my original critique identified two flaws in the model. The Tax Foundation has acknowledged the first while arguing that the second is not actually a flaw. This analysis evaluates the Tax Foundation’s response to my critique and finds it lacking.

Moreover, the Tax Foundation’s response raises further questions about the organization’s macroeconomic model, including whether a rigorous justification for the seemingly ad hoc collection of equations that make up the model has been—or even can be—constructed. As noted in my original piece, these issues with the Tax Foundation’s model raise questions about the reliability of the organization’s estimates of economic growth and suggest that policymakers and the press should be skeptical of the results.

What if we took equity into account when measuring economic growth?


Featured image from Flickr user Charles & Hudson. Image has been cropped.

Jason Furman’s provocatively titled new paper, “Should Policymakers Care Whether Inequality is Helpful or Harmful for Growth,” poses important questions about how we should think about the relationship between economic inequality and growth. Furman, the former chairman of the White House Council of Economic Advisers in the Obama administration (and new member of Equitable Growth’s steering committee), examines a key concept in economics dating back to the 1975 publication of Arthur Okun’s book Equality and Efficiency: that there is a tradeoff between an efficient, growing economy and an equitable economy. Furman questions several aspects of this basic premise.

Most subversively, Furman asks if economists are even measuring growth correctly. Forget the whole idea of “growth” for a moment and imagine instead that the question is simply “is inequality good or bad for society?” How can economists evaluate the good or bad part of this statement? Should they be interested in total economic output or something more granular such as wage growth for the middle class? Should they include noneconomic phenomena such as the health of citizens? Furman believes that insufficient thought has been given to this question as it relates to the study of inequality.

Traditionally, economists and policymakers measure the success of the economy using growth in Gross Domestic Product, which is a measure of all the goods and services produced within the United States. Growth in GDP means that there is a rise in the total economic output of the nation. But while journalists and policymakers alike often treat GDP growth as a sacred, inviolate marker of the health of our economy, economists know that GDP is just one measure among many that can be used to measure success. There is a vast universe of such possible measures, ranging from those that merely tweak the idea of GDP growth to those that upend it entirely. Those measures give us a very different picture of the economic progress of the nation. Importantly, the more these measures account for what economic growth looks like up and down the income spectrum, the less rosy the economic picture is in recent years.

How else can we measure success?

The question of how to measure success has been the subject of many book-length treatments and landmark reports. Some sociologists and economists have long taken the view that GDP isn’t measuring much of use.3 GDP does not measure the work of homeworkers, for example, or care about environmental quality or health outcomes. A country with high and increasing GDP could nevertheless be quite an unpleasant one to live in.

Furman focuses on one particular facet of this debate by noting that GDP growth places the same value on $1 of new income earned by the richest member of society as it does on $1 earned by the poorest member of society. But surely society would prefer to value more highly the $1 for the poor person because society values equity to some degree and because the rich person presumably values an additional dollar much less than the poor person does. And it might be better for growth too: The poor person is more likely to spend that $1, contributing to overall demand in the economy, while the rich person is likely to save it in ways that protect wealth but may not necessarily improve growth down the line. We can capture this moral and economic preference for equity by adjusting our measures of success. Furman gives three suggestions.

Median income

GDP growth is based on mean income—a simple average calculated by dividing total income (measured by GDP) by the number of people in the economy. When an economy includes many very rich people, this will pull up average income. Median income, which would be the income of the person in the exact middle if you lined up all the people in the United States from poorest to richest, doesn’t change if an already rich person gets significantly richer. It’s just the person in the middle. Thus, it’s an accurate indicator of success for someone in the middle of the income distribution. (See Figure 1.)

Figure 1

Growth for some particular slice of the income distribution

Furman suggests that economists and policymakers might simply look at only the slice of the income distribution they care about most. He suggests the bottom fifth of income earners, meaning the poorest 20 percent of society. While this is important, we focus in this analysis on what we call the upper 40 percent—that is, adults with incomes between the 50th and 90th percentile. This group represents the middle class and upper-middle class. Research shows that this group, though affluent, is losing ground relative to society’s truly rich in the top 1 percent of the income distribution. If overall growth outpaces growth in this group, then it suggests that growth is high for either the poorest earners or the very richest. This measure ignores other parts of the income distribution and cares only about growth in this slice. Income gained by someone in the top 10 percent—or the bottom 10 percent—will not impact this measure at all.

Mean log of income

This is an economic concept that requires a little explanation. Economists use this measure because it stretches out the bottom of the income distribution. For this measure, we transform the income of each person in the economy by taking the natural log of their income—we’re not going to explain here what a log is, but the figures below show how logging income affects its distribution. This will inflate small numbers and shrink large numbers relative to the rest of the numbers in the series because the log curve stretches the bottom of the chart out, increasing the importance of the gap between the poor and the middle class, and compresses the top of the curve, decreasing the importance of the gap between the middle class and the very rich. (See Figure 2.)

Figure 2

The graph on the left side of Figure 2 shows the 2014 U.S. income distribution logged. Notice how the incomes of the top 10 percent, which dominated the scale of Figure 1, are compressed. To show how mean log of income works, we massively inflated incomes of the top 10 percent in the second panel of Figure 2. Our manipulation represents a massive increase in total economic output: By traditional measures, we have increased economic output by 56 percent. But notice how little the mean moves in the second panel. The log of mean income increases just 7 percent in this scenario. Because this change in income was so inequitable, it had very little impact on the mean log of income.

Using mean log of income means that income changes for the poor will have a large impact on growth, whereas income changes for the rich will matter very little for growth. An additional $1 in the hands of a rich person matters less for overall growth than $1 in the hands a poor person, reflecting the intuition Furman advances about equal amounts of growth having different values to different people and to the economy as a whole.

Examining different measures of growth

How would economists and policymakers’ view of growth in the United States change if they looked at some of these alternate measures? We used the Distributional National Accounts dataset created by economists Thomas Piketty at the Paris School of Economics and Emmanuel Saez and Gabriel Zucman at the University of California, Berkeley to evaluate each of the alternative growth measures mentioned above. The Distributional National Accounts dataset takes aggregate GDP—about $19 trillion in the United States right now—and estimates how it is distributed between all adults in the economy.4 By disaggregating economic growth in this way, economists can use it to construct various national income measures from the dataset that might otherwise be difficult to observe and that are directly comparable to total output growth.

Distributional National Accounts is based on Net National Income, which is a bit different from GDP but exhibits similar patterns of growth.5 All the measures we have calculated here are for income after all government taxes and transfers are accounted for—think government programs such as Supplemental Nutrition Assistance or the Earned Income Tax Credit—which tend to reduce inequality in the United States.

1963–1980

Figure 3 shows the trend in overall Net National Income growth and our three alternative measures of NNI growth from 1963 to 1980. The thick green line shows overall NNI growth. For most of this period, all four lines are very close to one another. This suggests that growth was relatively even across all income groups. (See Figure 3.)

Figure 3

The one exception is in the mid-1960s, when growth in the mean log of income is much higher than growth in the other three measures. Remember that mean log of income will tend to highlight gains at the bottom much more than gains at the top. This discrepancy between 1965 and 1967 indicates that growth in those years was very strong for those below the median income.

1980–1990

In the 1980s, we start to see some real divergence in our measures of growth. Most notably, Figure 4 shows that at three growth peaks in 1981, 1984, and 1988, overall growth is higher than any other measure of growth. Those in the upper 40 percent of the income distribution registered growth running a little behind headline growth, with both running several percentage points ahead of the mean log of income. Income inequality started to take off in the 1980s. In 1984, for example, growth for the top 1 percent was a stunning 19 percent, while growth for the bottom 90 percent was just 4.2 percent. (See Figure 4.)

Figure 4

Our alternate measures of growth also solve the mystery of the “double dip” recession of the early 1980s highlighted in Figure 4. The recovery in 1981 was really only a recovery for those with high incomes. Any other measure of growth would have shown that the economy was still in recession during this period.

Compare Figure 4 to Figure 3. Notice that the booms of the 1980s that appear to surpass or equal those of the 1960s and 1970s would be much less impressive if economic growth were measured using the mean log of income or median income. The 1984 peak would be comparable to the 1973 and 1976 peaks, while the peak of 1987 and 1988 would be seen as quite weak in this historical context.

1990–2014

In the 1990s, the various measures once again move into relative alignment. As Figure 5 shows, however, overall growth continues to be about half a percentage point larger than growth by our alternative measures in most years. (See Figure 5.)

Figure 5

Of particular note in this time period is the Great Recession, spanning from the end of 2007 to mid-2009, when overall growth was significantly less negative than mean log of income growth. Although the Great Recession hit all income brackets hard, it was particularly damaging for those at the bottom of the income ladder. Earners in the bottom 50 percent of the income distribution saw income growth almost 3 percentage points lower than those in the top 1 percent.

What is the right measure of growth?

The four measures shown in the graphs above could all be reasonable ways of thinking about measuring progress in the U.S. economy. Each requires making a value judgement about what kind of growth we value. This is no less true of GDP growth. As Figure 4 demonstrates, GDP growth can paint a very misleading picture of the health of the economy, suggesting that we are in a robust recovery when, in fact, only a small number of households are benefitting.

Furman is right to suggest that this is a debate economists and policymakers should have. Unfortunately, the economic indicators reported by the U.S. Bureau of Economic Analysis do not provide sufficient detail to calculate, for example, the mean log of income. In fact, the quarterly GDP indicators, called the National Income and Product Accounts, provide no distributional information at all. The task of decomposing growth by income quantile has fallen to academic economists. Until the BEA takes up the task of reporting distributional income totals, decisionmakers will continue to lean on GDP growth, and they will continue to be misled by it.

The Tax Foundation’s score of the Tax Cuts and Jobs Act

Update: The Washington Center for Equitable Growth has issued a statement regarding the Tax Foundation’s response to this critique.

The Tax Foundation last week released an analysis estimating that the recently released Tax Cuts and Jobs Act would increase U.S. Gross Domestic Product by 3.9 percent.6 The Trump administration and congressional Republicans have made it clear that they will justify their new tax proposals in large part on the basis of claims about economic growth and an associated increase in incomes, and proponents of the legislation immediately seized upon the Tax Foundation’s estimates as support for their claims. This note identifies two issues in the Tax Foundation’s analysis that suggest its estimated increase in GDP is probably substantially overstated.

First, the Tax Foundation appears to incorrectly model the interaction between federal and state corporate income taxes, thus overstating the effect of statutory rate cuts. Second, the Tax Foundation appears to treat the estate tax as a nondeductible annual property tax paid by businesses, which results in inflated estimates of the effect of repealing the tax. Appropriately addressing the issues raised in this note could reduce the Tax Foundation’s estimate of the increase in GDP that would result from the legislation to 1.9 percent—a reduction of roughly half—even if there are no other issues with the Tax Foundation’s estimates.

There is substantial uncertainty in this estimate of the GDP impact that would be generated by a revised version of the Tax Foundation model since it depends on an attempt to approximate the results of a model for which only partial documentation is publicly available. The estimate that would be generated by a revised model could be larger or smaller than this value.

Nonetheless, the significance of this difference raises important questions about the reliability of the Tax Foundation’s estimates. Critical assessment of the Tax Foundation’s analysis is particularly warranted, as some legislators have suggested that they might consider dynamic scores from organizations other than the nonpartisan Joint Committee on Taxation—the traditional source of nonpartisan estimates of congressional tax proposals—in determining the budgetary effects of the legislation.

This note does not attempt a complete assessment of the Tax Foundation model, which would be impossible without greater knowledge of the equations that make up the model. The criticisms raised in this analysis are based on inspection of publicly available estimates and documentation, as well as communication with Tax Foundation staff.7

The Tax Foundation appears to incorrectly model the interaction between federal and state taxes, inflating the effects of changes in the statutory corporate rate

The Tax Foundation model assumes that there is a fixed return required by investors. The long-run capital stock is set equal to the level at which a $1 increase in investment yields a pretax return sufficient to generate exactly that fixed required return after taxes. In computing the taxes on this $1 increase in investment, the Tax Foundation uses an estimate of the effective marginal tax rate on new investment.

It is well understood that the effective marginal tax rate on new investment can differ substantially from the statutory tax rate on business income. For example, in the case of a business tax system that allows full expensing—a policy under which businesses may deduct the full cost of any investment in the year the expense is incurred—the business-level effective marginal tax rate is zero, regardless of the statutory rate.8

Given this general finding, it is surprising that estimates generated by the Tax Foundation model suggest large effects of reductions in the statutory corporate rate, even after adoption of full expensing. The Tax Foundation’s estimates of House Republicans’ “Better Way” tax plan, for example, suggest that even after adopting full expensing and repealing the estate tax, reducing the corporate income tax rate from 35 percent to 20 percent would increase the size of the economy by 1.7 percent.9

A more recent Tax Foundation analysis concluded that full expensing for C corporations would increase GDP by 3 percent, a reduction in the statutory corporate rate from 35 percent to 20 percent would increase GDP by 3.1 percent, and both policies together would increase GDP by 4.5 percent.10 This analysis thus suggests not only a large effect of statutory rate cuts on top of expensing, but also finds that a 15 percentage point reduction in the corporate rate would have a larger effect than full expensing. This result is surprising, as expensing would be expected to have an effect roughly equivalent to reducing the statutory corporate rate to zero in a model like that used by the Tax Foundation.

These results are unusual for a model that determines the capital stock based on the effective marginal tax rate on new investment. Changes in the statutory rate could have an effect on the economy independent of the effective marginal tax rate in a model that assumes shifting of real economic activity across borders in response to changes in statutory rates. The Tax Foundation model, however, does not appear to include this channel, so this cannot explain the results.11

Another potential reason for the large effects of the statutory rate reduction could be that the Tax Foundation might compute effective marginal tax rates on intellectual property using a different methodology than for other types of assets. Some analysts have suggested that traditional effective marginal tax rate computations are inappropriate for intellectual property because the nature of such investments differs. But there is no indication that the Tax Foundation has chosen this approach.12

One factor that may partially explain these unexpected results could be that the Tax Foundation’s estimates of proposals to provide full expensing do not include expensing of inventories. If this is the case then proposals to reduce the statutory corporate rate would reduce the effective marginal tax rate on inventories, yet proposals for full expensing would not. As inventories account for less than 10 percent of the corporate capital stock, this could have a modest but noticeable impact on the results.13

In response to an inquiry about the growth from cutting the statutory rate, even after enacting expensing and repealing the estate tax in the “Better Way” plan, Tax Foundation staff attributed this growth to interactions between the federal corporate income tax and property, excise, and state and local taxes. On its surface, this does little to resolve the mystery, as state and local taxes are generally deductible from federal corporate income taxes, and the deductibility of such taxes would seem likely to moderate or eliminate most interactions.14 A recent paper from the Tax Foundation, “Measuring [the] Marginal Tax Rate on Capital Assets,” offers a potential explanation for why the Tax Foundation’s model might generate this surprising interaction.15

Specifically, the formula in this paper for computing the service price of capital—the pretax return gross of depreciation required for an investment to yield the required after-tax return—appears to suggest that federal corporate taxes are deductible from state corporate taxes when determining the value of depreciation allowances, but also that federal corporate taxes are not deductible from state corporate taxes when determining the rate at which profits are taxed.16

This apparent inconsistency would inflate the estimated tax rate on investments by undervaluing the depreciation deductions to which a business is entitled. More importantly, it would create a potentially spurious interaction that would cause reductions in the statutory corporate tax rate to reduce the effective marginal tax rate in the model—even when no such effect exists in practice. It would also likely cause the model to understate the growth impact of expensing.

To get a rough sense of the quantitative significance of this interaction, assume that the Tax Foundation’s recent estimate of the growth impact of expensing for C corporations and a 20 percent corporate rate is an approximately valid estimate for the impact of a proposal to expense capital investment including inventories. (This assumption is likely not precisely correct. Expensing of inventories would tend to increase the estimate and the potentially spurious interaction with state and local taxes likely could increase or decrease it depending on other details of the model.)

In models like that used by the Tax Foundation in which the effective marginal tax rate drives economic behavior, reducing the statutory corporate rate to zero would tend to yield the same result as providing full expensing. Thus, a rough estimate of the impact of reducing the statutory rate would be the ratio of the proposed reduction in the statutory corporate rate to the current statutory rate multiplied by the economic impact of full expensing including inventories. This suggests an estimate of the GDP impact of reducing the statutory corporate tax rate from 35 percent to 20 percent of 1.9 percent, rather than 3.1 percent.

This approximation for a revised estimate of the impact of reducing the statutory rate from 35 percent to 20 percent in the Tax Foundation model is subject to several sources of uncertainty. First, it assumes that the diagnosis of a spurious interaction between federal corporate taxes and state corporate taxes in the Tax Foundation model is correct. Second, it uses the Tax Foundation’s recent estimate of the impact of full expensing for C corporations and a 20 percent corporate rate as an estimate of the impact of full expensing including inventories. This could be understated if the impact of expensing inventories on GDP is particularly large, due to the impact of the federal-state interaction on the growth impact of expensing, or due to other interactions with the corporate rate such as that discussed in the next section. Third, it uses a linear approximation for the relationship of the rate cut proposal to a full expensing proposal, which likely slightly overstates the adjustment.

Notwithstanding this uncertainty, using this estimate of the increase in GDP from a reduction in the statutory rate from 35 percent to 20 percent would reduce the growth effect from 3.9 percent to 2.7 percent, a reduction of about one third. Even if the appropriate adjustment is somewhat overstated, it would still reflect a substantial change in GDP. Notably, this potentially spurious interaction would appear to affect any estimate generated by the Tax Foundation model for proposals that change the corporate tax rate—not only its estimates of the Tax Cuts and Jobs Act.

The Tax Foundation appears to treat the estate tax as an annual property tax paid by businesses, which would overstate the effects of repeal

As noted above, the capital stock in the Tax Foundation model is set at the level at which a $1 increase in investment yields a pretax return sufficient to generate a fixed return required by investors. In computing the tax rate for this computation, the Tax Foundation appears to incorporate a cost associated with the estate tax that would be equivalent to treating the estate tax as an annual nondeductible property tax paid by businesses.17 The tax rate appears to be based on a measure of the average estate tax liability divided by the capital stock, which is then grossed up to reflect a marginal rate.18

Treating the estate tax as a property tax paid by businesses would not be an accurate description of the practical operation of the tax. The estate tax applies to the transfer of personal estates with a value of more than roughly $11 million at death for couples.19 If this is, in fact, the modeling assumption adopted in the Tax Foundation model, it would seem to suffer from several flaws.

First, the Tax Foundation model is a model of homogeneous capital. In other words, there is nothing unique about assets held by one business relative to those held by others or about the capital provided by one investor relative to another.20 If capital is homogeneous, then there is no reason the marginal supplier of capital would necessarily be subject to the estate tax at all. Indeed, the underlying assumption of the model appears to be not only that increases in investment financed by increases in saving are uniform (in percentage terms) across the population, but also that they translate into increases in assets held at death, which also need not be true.21

Second, as noted above, the Tax Foundation assumes a fixed required rate of return. The assumption that there is a fixed rate of return required by investors is often referred to as the small open economy assumption and is justified on the basis that there is a global pool of capital ready and willing to finance profitable investments in the United States. Tax Foundation staff have endorsed this label and justification in descriptions of their model.22 Yet assuming that foreign investors are the marginal source of finance can dramatically change the effects of the tax system on the economy. In the extreme case in which capital is perfectly mobile across countries—the assumption made by the Tax Foundation—investor-level taxes in the United States that do not apply to foreign investors become irrelevant to the determination of the capital stock.23

While there are cases in which foreign residents are subject to the U.S. estate tax, there are numerous ways for foreigners to avoid the tax through planning or careful selection of assets. There is no compelling reason to think that in a small open economy model, foreign residents would treat the U.S. estate tax as fully marginal in their decision-making.

Third, this modeling approach appears to treat the estate tax as a nondeductible tax for the purposes of business income taxes.24 If the tax is nondeductible, then businesses must not only pay the estate tax but also corporate income tax on the additional return they earn to cover the estate tax. This modeling assumption would appear to create spurious interactions between different taxes. Suppose, for example, the United States adopted full expensing at both the federal and state levels. Corporate income taxes would then not affect the rate of return on an investment. But because the Tax Foundation model appears to treat the estate tax as a nondeductible tax, the statutory corporate tax rate would still discourage investment because it would increase the effective estate tax rate. Thus, even if the U.S. estate tax did affect the effective marginal tax rate in a small open economy model, the modeling approach would still appear to be inappropriate.

In the context of the Tax Cuts and Jobs Act, the Tax Foundation estimates that repealing the estate tax would increase GDP by 0.9 percent.25 But if this estimate is based on a decision to model the estate tax as a property tax paid by businesses, then this result is likely inappropriate. In a small open economy model with homogeneous capital, zero would probably be a more appropriate estimate. Reducing the impact of estate tax repeal from 0.9 percent to zero would represent a roughly 25 percent reduction in the growth effects of the plan.

It is important to note that the estate tax could, at least in theory, have important effects on the level of output in models that reject other assumptions of the Tax Foundation’s model. But this would require more substantial changes to the Tax Foundation model that would have significant consequences for estimates of the effect of other policies. In a closed economy model, for example, it might be reasonable to assume that some portion of the additional savings necessary to finance an increase in investment would come from wealthy families subject to the estate tax. Or, as another possibility, recognizing the heterogeneous nature of capital and the frequency of company founders and their heirs among the wealthiest Americans, one could argue for impacts based on indirect taxation of new businesses. Yet pursuing this latter approach would require a more significant recognition of the estate tax as a burden on labor rather than capital than the Tax Foundation’s current marginal tax rate computations suggest.

Conclusion

This note is far from a complete assessment of the Tax Foundation model, and conducting such an assessment would be challenging given the limited information publicly available about the model. Nevertheless, this note concludes that the Tax Foundation’s model probably includes at least two important flaws. Addressing these two flaws could reduce the Tax Foundation’s estimates of the growth impact of the Tax Cuts and Jobs Act roughly in half. The significance of this change raises substantial questions about the reliability of the Tax Foundation’s estimates of economic growth and suggests that policymakers should be skeptical of the results, especially when considering substituting these estimates for those from traditional legislative scorekeepers at the nonpartisan Joint Committee on Taxation.

Republican tax plan slams workers and job creators in favor of the rich and inherited wealth

The tax plan released by Republicans in Congress and praised by President Donald Trump is a remarkable document in many ways, but most notably in that it achieves the opposite of its stated goal. Presented as a tax cut for workers and job-creating entrepreneurs, it is instead a giant tax cut for the rich and inherited wealth.

First, the proposed legislation cuts the top rate on profits recorded by so-called pass-through businesses from 39.6 percent to 25 percent, with a trick that neatly summarizes the philosophy of the bill: The reduced rate applies only to passive business owners, not to active entrepreneurs. Investors who own shares in lucrative firms for which they do not work will pay 25 percent on the profits flowing to their bank accounts. But entrepreneurs who work to earn income from start-ups in which they are actively involved will pay the higher rate of 39.6 percent. Wealthy investors win bigly. More jobs are not created. Workers get nothing.

The proposed plan contains complicated rules to avoid active businessmen angling to pay the lower 25-percent rate by pretending to be passive owners. If these rules work as intended, passive owners will be the sole beneficiaries of the bill—again, a perverse outcome. But if clever tax accountants abuse the new rules, or lobbyists in Washington succeed in getting the lower tax rate enacted for all owners of pass-through businesses, we will see an even larger tax cut for the top 1 percent of income earners and a federal budget deficit that balloons even more.

Second, the Republican plan reduces, and then eliminates, the estate tax. The beneficiaries of this measure will be the heirs and heiresses of the wealthy who die with more than $5.5 million in net wealth—who don’t need to create a single job for this reward. Conveniently, the provision would allow the Trump family to avoid more than $1 billion in federal taxes—if they have not already organized their affairs to dodge the estate tax by creating family trusts. Inheritors, who by definition have not earned their wealth, will be able to keep their full inheritance free of any federal tax.

Third, the proposed bill cuts corporate income taxes by $846.5 billion, primarily by reducing the corporate tax rate from 35 percent to 20 percent. Whatever one believes about the long-run effects of cutting corporate taxes, it is clear that in the short and medium term, the cut overwhelmingly benefits shareholders, who do not need to do any work to reap their profits.

So, here is what the Republican tax plan boils down to: A retired passive business owner in Florida gets a huge tax cut, with his marginal income tax rate falling from 39.6 percent to 25 percent and his corporate investments reaping higher returns due to the corporate tax cut. His children will inherit a bigger estate and will not have to pay any tax on it.

In contrast, the successful start-up owner who is actively growing his business in Silicon Valley sees his marginal tax rate increase from 47.6 percent to 52.9 percent (when taking California taxes into account) because of the repeal of the deductibility of state income taxes. Of course, some Silicon Valley start-uppers will one day become Florida retirees, but if Congress want to help entrepreneurs, it seems more logical to cut their taxes while they’re young, rather than the taxes of their future selves.

Republicans will noisily claim that cutting taxes on wealthy business owners will boost economic growth and end up benefitting workers down the income ladder. The idea is that if the government taxes the rich less, the wealthy will save more, grow U.S. capital stock and investment, and make workers more productive. The evolution of growth and inequality over the past three decades makes such a claim ludicrous. Since 1980, taxes paid by the wealthy have fallen dramatically and income at the top of the distribution has boomed, but gains for the rest of the population have been paltry. Average national income per adult has grown by only 1.4 percent per year—a poor performance by both historical and international standards.

As a result, the share of national income going to the top 1 percent has doubled from 10 percent to more than 20 percent, while income accrued by the bottom 50 percent has been almost halved, from 20 percent to 12.5 percent. There has been no growth at all in the average pretax income of the bottom half of the population over the past 40 years—during which trickle-down enthusiasts promised just the opposite. Now they’re doing it again. Will we listen?

—Emmanuel Saez and Gabriel Zucman are professors of economics at the University of California, Berkeley.

This piece is cross-posted at UC Berkeley Opportunity Lab.

Learning public policy from Amazon

Amazon.com Inc. CEO Jeff Bezos walks onstage for the launch of the new Amazon Fire Phone in Seattle.

Amazon.com Inc. Chief Executive Jeff Bezos late last month cracked a bottle of champagne at the top of a 300-foot wind turbine for the opening of the Amazon Wind Farm in Scurry, Texas. This project, developed by Lincoln Clean Energy, will now provide Amazon with clean energy to power the equivalent of 90,000 houses. But the project itself is part of a controversial economic development project that offers policymakers insights into whether state and local tax incentives are worth offering to companies shopping around for new places to invest and do business. The lessons could be particularly relevant to states and localities that late last month also finalized their economic development pitches to Amazon for its proposed $5 billion new second headquarters, which the technology giant says will result in the creation of 50,000 new jobs.

The wind energy project that Bezos celebrated atop that wind turbine came to be through a state program called Chapter 313, which I examined in a recent working paper. A more detailed look at this particular project is worthwhile because of the way it abates companies from local taxes. Under Chapter 313, individual school districts in Texas authorize a limit on local property taxes, but then these school districts are made whole by the state. So, school districts give out incentives, but the cost is ultimately paid for by state taxpayers. Estimates are that the accumulating costs of these tax abatements for this wind energy farm will total more than $1 billion per year by 2022.

The wind farm in question—originally called Dermott Wind—was authorized by the program, but not without controversy. Wind farms receive incentives at the federal, state, and local level. For this project, the major federal incentive—the Production Tax Credit—was set to expire in 2016. Like many wind projects, the developers of this wind farm sped up early construction to qualify for the production credit for that location. In short, the company locked in a lucrative federal incentive by starting construction in December 2015.

After beginning construction of this $300 million project, the company applied for the Texas Chapter 313 program. This program would authorize the $300 million project to be taxed at a value of only $30, providing more than $22 million in incentives from the Texas taxpayer, alongside an additional $1.2 million in incentives from local tax abatements. Yet the 313 program requires a company to claim that Chapter 313 is a “determining factor” in its decision to invest in the locality within Texas, and that without the program, the company would invest in a location outside the state. So, Lincoln Clean Energy needed to apply for a federal incentive claiming it was already building in Texas and, at the same time, claim to Texas that it could move elsewhere if it didn’t qualify for 313 treatment.

These mutually exclusive claims did not go unnoticed by the Texas Comptroller’s office, where formal certification indicates even further evidence of building on the site prior to receiving incentives. Yet despite this evidence that the project was locked in this location, this incentive was authorized by the school district and certified by the Texas Comptroller. The paper trail, including the federal Production Tax Credit, indicates the company was coming to Texas whether or not this 313 incentive was authorized.

What does this odd case tell us about economic development? Let’s look at that other and much-larger project in which Amazon’s Bezos has a very direct hand. Amazon late last month also closed its public call for proposals from cities and states around the country for a giant new second headquarters. This direct appeal by the company for public subsidies led to shocking offers of $7 billion in tax and other public incentives from New Jersey and a number of playful stunts, ranging from the mayor of Kansas City, MO positively reviewing 1,000 Amazon products to a town in Georgia offering to rename itself in honor of the company.

The Texas wind energy project—and now Amazon’s proposed new headquarters—highlights two important points. First, many of the companies applying for incentives around the country have already made their decisions about where to invest. My work on the Texas 313 program indicates that 85 percent of the companies seeking to avail themselves of the tax abatements were coming to Texas even without the incentives. Other studies find that roughly two-thirds to three-fourths of incentives are redundant, in that they are being provided even though they do not really affect companies’ decisions about where to invest and build. One study even finds that 70 percent of corporate executives who received incentives in North Carolina didn’t even know they received them. Doesn’t sound like they were very enticing.

Second, many of these state and local incentive programs are designed to provide very weak tests for providing incentives. The Texas Chapter 313 program says companies simply need to state that incentives are “a determining factor” in their decision. To qualify, companies only need to claim they have other options or that the incentive is necessary to make the project financially viable. No disclosures are required.

The bidding war for Amazon’s second headquarters demonstrates that some public officials are losing sight of many of these lessons. Many cities and states are putting on the table their best possible offers, but is that really good public policy? What if Amazon has already chosen a location—or, more likely, narrowed the choice down to a select few places and is simply taking bids to maximize its benefits? Whatever location wins the new project needs to be sure it conducts a thorough cost analysis to learn whether any tax abatements are really worth the cost.

Tax Reform and Equitable Growth

As members of Congress consider tax reform, their focus should be the living standards of American families, particularly middle-class families and families striving to reach the middle class. This page collects recent research, analysis, and commentary from Equitable Growth that can help policymakers understand the consequences for American families of potential changes in tax law and inform their choices about the substance of tax reform.
 

Issue Briefs

If U.S. tax reform delivers equitable growth, a distribution table will show it
Greg Leiserson

What is the federal business-level tax on capital in the United States?
Greg Leiserson


Columns

The ‘Unified Framework’ is a proposal for two new wasteful tax expenditures
Greg Leiserson

False promises about corporate taxes and American workers
Kimberly A. Clausing

In defense of the statutory U.S. corporate tax rate
Greg Leiserson

It’s no surprise that the Kansas tax cut experiment failed to create jobs
Greg Leiserson


Reports

Strengthening the indispensable U.S. corporate tax
Kimberly A. Clausing

Taxing Capital: Paths to a fairer and broader U.S. tax system
David Kamin


Testimony

Testimony before the House Committee on Ways and Means Tax Reform Forum
Heather Boushey


Value Added

Expanding the Earned Income Tax Credit is worth exploring in the U.S. tax reform debate
Nisha Chikhale

How would homebuyers respond to a less generous U.S. mortgage interest deduction?
Nisha Chikhale

Preferential pass-through tax rates and the declining share of labor income in the United States
Nisha Chikhale

The ‘Unified Framework’ is a proposal for two new wasteful tax expenditures

President Donald Trump speaks about tax reform.

The “Unified Framework for Fixing Our Broken Tax Code” recently released by the Trump administration and congressional Republicans proposes sharp reductions in the corporate tax rate—from 35 percent to 20 percent—and in the tax rate for income from pass-through businesses, from 39.6 percent to 25 percent. These two proposals and a related proposal to repeal the corporate alternative minimum tax would cost more than $2.5 trillion over the next decade, according to the Tax Policy Center’s preliminary analysis. Together, they account for more than all of the plan’s net cost.

While proposals for large rate cuts may seem consistent with the tax reformer’s mantra of broadening the base and lowering rates, these preferential rates for business income are better understood as two huge new tax expenditures. The broaden-the-base, lower-the-rate mantra applies to the tax system as a whole. Corporate income taxes and individual income taxes on income from pass-through businesses are constituent parts of the tax system. Preferential rates for specific types of income are appropriately viewed as tax expenditures.

There is no reason to accept the creation of these new tax expenditures as a necessary element of reform. Superior approaches exist that would—at much lower cost—achieve proponents’ stated objectives with respect to the financial incentives for profit shifting, inversions, and capital investment. However, if policymakers continue to place preferential business rates at the center of their proposals, recognizing that preferential rates would create new tax expenditures also points to a new class of offsets that should be considered: surtaxes on the domestic cash flow of U.S. businesses. A surtax on the domestic cash flow of U.S. businesses would scale back or eliminate the tax expenditure for excess returns that preferential rates create, while still providing the reduction in the headline rate and the change in financial incentives for which proponents advocate.

Preferential business rates should be viewed as tax expenditures

Tax expenditures are defined by the Congressional Budget Act as “revenue losses attributable to provisions of the Federal tax law which allow a special exclusion, exemption, or deduction from gross income or which provide a special credit, a preferential rate of tax, or a deferral of tax liability.” Of course, as noted by the U.S. Treasury Department in its annual summary of tax expenditures, the determination of which provisions of law are tax expenditures depends critically on the hypothetical tax system to which the actual tax system is compared.

The Treasury’s traditional approach uses two baselines, both of which are modeled after a comprehensive income tax.26 However, the baselines include certain features of the existing tax code that would not be present in a more conceptually pure comprehensive income tax such as taxing capital gains when assets are sold rather than as they accrue and taxing nominal gains and losses rather than adjusting those gains and losses for inflation. Importantly, both baselines assume the existence of a separate corporate income tax in addition to the individual income tax. Thus, while a preferential rate for pass-through income should be viewed as a tax expenditure against either of these baselines, a substantial reduction in the corporate tax rate might not be viewed as a tax expenditure.

In contrast to the income tax benchmarks used in the annual Treasury analysis, a true comprehensive income tax would tax all income once according to a single rate schedule. In other words, the corporate income tax would be integrated with the individual income tax. It does not necessarily matter whether income is taxed on a separate corporate tax return or the profits are allocated to owners on their individual tax return (or both), but the combined effect of the tax system would be to tax corporate income at the same rate as income from noncorporate businesses, wages, or any other source. (The Treasury Department has provided analysis using this type of benchmark as a supplemental analysis in the past.)

Judged against this true comprehensive income tax hypothetical, a sharply lower tax rate on corporate income would be appropriately viewed as a tax expenditure because the lower corporate rate would provide a preferential rate of tax for income earned by corporations compared to other sources of income such as wages.

Notably, the conclusion that preferential business rates are appropriately viewed as tax expenditures is unaffected by the debate over whether an income tax or consumption tax would be a preferable system of taxation, which frequently plagues tax expenditure analysis. (The same Treasury analysis providing estimates using a comprehensive income tax benchmark also provided analysis using a comprehensive consumption tax.) The key difference between a consumption tax and an income tax is the treatment of deductions for capital investment. A comprehensive consumption tax would allow businesses to write off capital spending when it occurs—also known as expensing. A comprehensive income tax would instead allow businesses to write off the cost of assets over time as they lose value. In either system, the same statutory rate would apply to business income as to other types of income.27

Preferential business rates create a tax expenditure for excess returns—returns in excess of the risk-free return, including returns to risk, luck, market power, and labor when not paid out as wages. Excess returns would also include returns to tax avoidance and sheltering strategies that involve shifting income from the individual tax base into the business tax base motivated by preferential rates. As noted above, these returns are part of the tax base in both income tax systems and consumption tax systems. Judged relative to an income tax system, preferential business rates also create tax expenditures relating to the normal return.

One criticism of this argument could be that the U.S. tax system creates the potential for double taxation of corporate income because corporations are subject to the corporate income tax and investors are subject to tax on capital gains and dividends. Thus, according to this view, a lower corporate rate could be a desirable step toward achieving the same rate of tax on income from all sources. However, recent research questions the practical relevance of investor-level taxes on average. Burman, Clausing, and Austin (2017), Austin and Rosenthal (2016), and the U.S. Treasury Department (2017) all find that the share of corporate equities held in taxable accounts is about 25 percent to 30 percent (see Figure 1). Moreover, even when investors are subject to tax, preferential rates generally apply. In addition, the Congressional Budget Office (2014) estimates that only 70 percent of interest payments deducted at the corporate level are taxable when received by lenders. Finally, the maximum corporate rate of 35 percent is already below the maximum individual rate of 39.6 percent. Thus, it is difficult to argue that a large reduction in the statutory corporate rate is necessary to avoid double taxation. A preferential rate for corporate income is appropriately viewed as a tax expenditure.

Figure 1

Superior alternatives to preferential business rates exist

Tax expenditures can be justified if they achieve a compelling policy objective at reasonable cost, but preferential business rates fail this test. A reform that includes preferential business rates would be more expensive, more regressive, and less economically beneficial (if not actively harmful) than one that focuses on the tax base.

Proponents of preferential business rates—or of a sharply lower corporate rate in isolation—tend to fall back on the idea that it is too politically difficult to pursue one of these superior approaches to reform. Yet, at the same time, it is a widely shared goal that tax reform be revenue neutral, and starting with statutory rate cuts means that policymakers aiming to achieve revenue neutrality will ultimately be looking for policies to offset the cost of those rate cuts, with only a very short list of politically difficult options to choose from. The major options include such controversial notions as restricting or repealing interest deductibility, the mortgage interest deduction, the deduction for charitable contributions, the state and local tax deduction, and the deduction for employer-provided health insurance premiums. There is little reason to think these offsets are easier to enact than a superior approach to tax reform would be in the first place. Moreover, even if legislation following this approach were enacted, a large portion of the gross revenue changes from the component policies would be attributable to swapping an existing set of tax expenditures for a new set of even more regressive tax expenditures.

However, if policymakers recognize that preferential business rates are appropriately viewed as tax expenditures, it expands the universe of offsets that should be considered and creates a third potential path for tax legislation. Under this approach, policymakers would offset the cost of preferential business rates with measures that have the effect of scaling back or eliminating the tax expenditures resulting from preferential business rates.

The essence of such an approach would be to combine reducing statutory business tax rates with the creation of new surtaxes on businesses’ domestic cash flow.28 Such a surtax is not a base-broadener in the traditional sense of repealing a tax expenditure on the annual lists put forth by the Treasury Department or the congressional Joint Committee on Taxation. Rather it would serve to offset the newly created tax expenditure resulting from the creation of preferential business rates, while still addressing the concerns about the international tax system and the cost of capital that motivate many to call for reductions in the statutory corporate tax rate.

In effect, rather than converting taxes on business income into a destination-based cash flow tax—as was proposed in modified form in the blueprint for tax reform released by House Republicans in 2016—this approach to reform would use a modestly scaled destination-based cash flow tax as an offset that scales back the tax expenditure created by cutting statutory tax rates.

The modified destination-based cash flow tax proposed in last year’s blueprint raised several major concerns in the public debate. First, it applied a preferential rate of tax to corporate income. As discussed above, a preferential rate for corporate income relative to other types of income would constitute a large and extremely regressive tax expenditure. Second, to neutralize the impact on the public of the border adjustment implicit in the proposal, the dollar would have needed to appreciate by roughly 25 percent. This required appreciation in the exchange rate naturally raised questions about the economic impacts of an appreciation at that scale, as well as questions of whether the exchange rate would, in fact, appreciate by 25 percent. And third, to comply with World Trade Organization rules, the border adjustment would have needed to be considered part of a consumption tax system. However, the blueprint contained an explicit denial that it included a value-added tax, or VAT, and a reinterpretation of the broader U.S. tax system as a subtraction method VAT would have been challenging.

To illustrate the advantages of using a surtax to avoid creating a tax expenditure for excess returns attributable to domestic operations, consider an alternative proposal that reduces the statutory corporate tax rate by 7.65 percentage points and creates a new 7.65 percent surtax on corporations’ domestic cash flow. All three of the concerns about the blueprint reviewed above would be moderated under this approach. First, by imposing a surtax at a rate equal to the reduction in the statutory corporate tax rate, it would eliminate the tax expenditure associated with preferential treatment of domestic profits. Second, a more modest tax on domestic cash flow would result in smaller exchange rate movements.29 And third, with a surtax at a rate that matches the employer portion of the payroll tax, U.S. tax law could be more easily amended to explicitly create a subtraction-method value-added tax that would be compatible with World Trade Organization requirements.30

Conclusion

The proposals at the center of the “Unified Framework” are large cuts in the statutory tax rates on business income. While these cuts may seem consistent with the broaden-the-base, lower-the-rate mantra of tax reformers, they are more appropriately viewed as new tax expenditures. Ideally, the notion of making large statutory business rate cuts the starting point for reform would be discarded. But, failing that, reformers should add offsets that scale back or eliminate the very tax preferences they are creating to the list of those under consideration to pay for reform.

In conversation with Kimberly Clausing

“Equitable Growth in Conversation” is a recurring series where we talk with economists and other social scientists to help us better understand whether and how economic inequality affects economic growth and stability.

In this installment, Equitable Growth’s Executive Director and Chief Economist Heather Boushey talks with Kimberly A. Clausing, the Thormund A. Miller and Walter Mintz Professor of Economics at Reed College. They discuss tax reform, changes to the corporate income tax, and who gains when taxes on capital are cut.

[Editor’s note: This conversation took place on Monday, September 25, 2017.]

Heather Boushey: Hi, Kim. Welcome! This is so great to have you here today.

Kimberly Clausing: I’m happy to be here.

Boushey: I’m going to get right into it. The White House recently released some more guidance [previews of the Administration’s Unified Framework] on its tax plans but not really anything specific. The ball is now with Congress, so I’m going to try and keep this conversation at a high level.

Often here in Washington, D.C., when the economic policymaking community talks about taxes, it’ll say that the federal government needs to change the tax rate and broaden the base, increasing the amount of income that is taxed. So, when it comes to the corporate tax, what in your view actually needs to be fixed? Is it the tax rate or is it the base?

Clausing: I think the tax rate is important for some companies, but companies in the United States pay a lot of different tax rates, and for some of them, effective tax rates are very low. For the big multinational companies, the federal statutory rate [of 35 percent] bears little resemblance to what they’re actually paying. And many of those big companies have even gone on the record in saying that they don’t care primarily about the statutory tax rate; they care more about other things. But many smaller companies that pay closer to the statutory rate do care a lot about the rate.

One of the really interesting features of our business landscape today is that there’s a lot of concentration of activity and profit at the very top of business ladder, just like there’s a concentration of income at the very top of our income distribution. If you look at the top 1 percent of corporate returns, big corporations account for the vast majority of all the profit, more than 90 percent. And those firms are disproportionally multinational, and they’re disproportionately likely to have profits derived from intangibles assets. And these companies are able to reduce their tax burdens in part by shifting income out of the United States toward other countries. And my work suggests such profit shifting is presently costing the U.S. government more than $100 billion each year in lost tax revenue.

So, I think good corporate-tax reform could both lower the tax rate and increase the tax base, and that would please economists and policy wonks. But it’s not clear that the corporate community is driven by both of those objectives.

Boushey: Tell me a little bit more of why so many of those firms at the top of distribution do not pay the statutory rate.

Clausing: Some of the base narrowing comes from simple things such as the research and experimentation tax credit, the production activities deduction, and other various provisions that lower the tax rate. But the biggest driver is international profit shifting.

Companies such as General Electric Co., for instance, have used the rules of our tax system to move income that really should be in the U.S. tax base to other jurisdictions—often in tax-havens. As a consequence, their effective tax rates are often in the single-digits. In General Electric’s case, its effective rate is nearly zero over the past decade or so here in the United States. Yet the company is still earning billions of dollars over that period throughout the world. It’s just that most of the income is being artificially moved offshore. And so, when you look at its taxes paid on U.S. income, it’s quite low.

Boushey: As we broaden the base, are there ways to do this so that we get around that problem?

Clausing: Yes. There are a couple of things that policymakers could do. For instance, one of the largest tax expenditures in the business area is deferral, which is this idea that you don’t have to pay U.S. tax on your foreign income until it’s repatriated. The companies that benefit from this want to remove that repatriation tax entirely and create a super-highway of tax avoidance where there’s no speed limit and you can simply shift profits to the islands [tax havens such as the Cayman Islands or Bermuda] and never worry about the U.S. government taxing it.

But a more effective way to proceed would be to still tax that income. We can combine taxation of foreign income with a lower rate (and a tax credit for foreign taxes paid), but we’ll actually collect the tax due at that lower rate. On a revenue-neutral basis, policymakers could probably lower the corporate tax rate to about 25 or 26 percent, get rid of deferral, and end up with the same amount of revenue. Basically, what would happen is that tax revenue would go up for the multinational firms that are shifting their income out of the U.S. tax base, and tax revenue would fall for domestic companies that aren’t using these techniques, and those two effects would cancel out.

Now, that approach is extremely unpopular with the multinational business community. One option short of that idea, but still moving in that direction, would be a per-country minimum tax, where you basically limit U.S. taxation of foreign income to countries with very low tax rates. So, if a multinational firm earns income in a tax-haven jurisdiction such as Switzerland or Luxembourg, then the United States applies a minimum tax as the income is earned. If these big firms’ profits haven’t been taxed substantially abroad, then the U.S. federal government reserves the right to tax it at some other rate.

The Obama administration championed this sort of per-country minimum tax regime, suggesting a minimum tax rate of 19 percent, but it wasn’t very popular with the business community. From its perspective, whatever tax rate is chosen for the minimum tax, it will still be a lot higher than zero. So, there are going to be political problems getting that idea through Congress. Still, it is a promising approach.

Boushey: Walk us through this kind of international profit shifting. What’s the scale? Is this the biggest problem we need to solve? Are there other problems that are just as big or is this one above and beyond any other?

Clausing: I think that this is the biggest tax base problem on the corporate side. My estimates suggest this costs the U.S. government about $100 billion a year, which is pretty big.

Boushey: You could invest in a lot of infrastructure with that.

Clausing: Yes, and there are other ways that our corporate tax base has eroded. Look at the interest deductibility provisions, for instance. Those imply that many companies actually face a negative corporate tax rate on debt financed investments, which also lowers tax revenues in the business sector. Also, there is the lost tax revenue from pass-through income, which also is calculated to cost about $100 billion from the domestic side of business income. There’s a nice study by eight economists, five from the U.S. Treasury Department, that shows that the average tax rate paid by pass-throughs is 19 percent, which is far lower than the statutory corporate rate.

Boushey: One of the arguments that you hear time and time again for why Congress needs to reduce the corporate tax rate is that doing so will boost investment in overall economic growth. Tell us a little bit about how strongly investment would react to a reduction in the tax rate at the corporate side?

Clausing: On the corporate side, there are a couple of considerations to keep in mind. One is that the distribution of corporate income within the tax base is highly skewed, with about three-quarters of it due to excess profits or rents. What are excess profits or rents? Well, there’s a normal return of capital, which enables a company to pay the interest costs or the equity costs of raising capital, but any income earned above that normal return is an excess profit.

For those firms that have a lot of excess profits—the Googles and Apples and General Electrics of the world—they are earning more than we normally expect for business activity. It’s not clear that giving them a windfall is going to lead to new investments. They already have more than enough after-tax profits from which to make investments.

If policymakers believe more after-tax profits are the way to suddenly spur investment, we might ask why it hasn’t already happened, since these kinds of firms are sitting on piles of cash. It’s unclear that giving them a bigger pile of cash is going to spur investment. We need companies to have desirable investments. And often what’s stopping them is not the absence of funds, but the absence of viable investments they want to make. If policymakers really think after-tax profits are what’s needed to drive investment, then we should already be in an investment nirvana, since lately we’ve had much higher profits than we’ve ever had in the past 50 years of our history.

Boushey: And yet our investment rate is quite low right now.

Clausing: Right. That’s why I don’t think after-tax profits are the answer.

Boushey: When talking to business owners, there is a wide range of things that drive their investment decisions—everything from consumer demand or where they sit in the supply chain or the quality of infrastructure around them that makes it possible to leverage their investment. Is there anything that you want to add to that list?

Clausing: When you get into tax reform debates, the business community acts as if tax is the only thing that drives its competitiveness, whereas investment decisions and competitiveness are really driven by a lot of other factors. Infrastructure, the education of the workforce, the health of the middle class—these are all crucial things for business success and competitive businesses. And, from a policy perspective, it is likely more important to focus on these factors than on making after-tax profits that are already historically high even higher. And funding education and infrastructure requires government revenue.

So, at a minimum, policymakers should pursue revenue-neutral reform, but there’s actually a case for revenue-gaining reform right now. If you look in the next decade, we are going to have 2 percentage points of GDP in additional deficits because of our commitments to the baby boomer generation’s Medicare and Social Security benefits. Also, to expand business investment opportunities, the federal government needs to make investments in infrastructure and education and in a healthy middle class.

Also, right now the U.S. economy is amid a historically long expansion, which means we’re due for a recession before long. That in itself will drive up deficits, so this seems like a particularly poor time to reduce the revenue stream for all those reasons.

Boushey: If a tax reduction in the statutory rate isn’t going to do much to boost investment, explain to us how it will actually boost the wage of the workers. President Trump and the Republican leaders in Congress claim that tax reform will boost the middle class.

Clausing: They are relying on this idea that corporate tax cuts raise investments, which raise worker productivity, and then higher worker productivity translates into higher wages. You’ll notice several things have to happen for corporate tax cuts to cause a wage increase, and each step entails some faith and some luck.

Start with the fact that the corporate tax base is mostly excess profits, so we’re not sure that extra profits are going to stir extra investment. But even if it did serve to boost investment, that would still have to translate into a wage increase for workers. The evidence on this point is pretty thin on the ground. There is some evidence from Europe that if companies with excess profits receive tax cuts, they’ll share those with their workers, but that’s not the same as causing a wage increase for workers as a whole. If policymakers give Google a big tax cut and Google employees get paid more, that’s nice for the Google employees but it’s not necessarily helping the workers in the economy as a whole.

And we have so many easier ways to help workers directly that it seems odd to rely on such an indirect mechanism. Extending the earned income tax credit is a great way to target the employment and wages at the bottom of the income distribution. Or how about giving the middle class a tax cut by lopping a couple of percentage points off the payroll tax? All of those would go straight to the workers. We have mechanisms in place already that target workers directly, so it seems odd to rely on this very indirect mechanism.

Boushey: So, it doesn’t seem like lowering the statutory tax rate is actually going to spur the kinds of investments that are going to get us to that point where productivity gains translate into higher wages for workers.

Clausing: There are better ways to target worker productivity structured around R&D investments, infrastructure investments, and education investments.

Boushey: My last questions. What’s a piece of research on this topic that doesn’t exist today that you would like to see, and what’s the question on business taxation you really wish we had more evidence on?

Clausing: I’d like to see a lot more research on the excess profits question. How important are excess profits in the modern picture of business activity? A lot of anecodotal data suggests this is a very important issue in today’s global economy, but I don’t think we have a clear picture of just how important.

I also think that there’s some promise in getting a better picture of profit-shifting behavior if we get access to better data on these questions. One of the things that the OECD [Organisation for Economic Co-operation and Development] and the G-20 [Group of Twenty] has worked on is a “Base Erosion and Profit Shfiting” initiative. And one of their items for action is to improve the public access to data on profit shifting. For example, if there were more researcher access to tax data of multinational company earnings, we could get closer to figuring out what’s happening inside the multinational firms.

Also, another one of the recommendations of that OECD group is for country by country reporting, where firms would have to tell each country government where they are earning off their profits. And just by shedding light on what’s going on, this helps curtail some of the profit-shifting activities. And if we made that reporting public as well, it shines a light on the activities of the company. The companies themselves don’t want it—they make the argument that this will basically give away some of their business secrets. But you have to ask, why is how much income you’re booking in the Caymans a business secret? Isn’t that itself a problem?

And if you are really too embarrassed to admit to the public that 90 percent of the company’s income is being booked on an island, then don’t do that in the first place. So, I think there are ways to use corporate social responsibility motives and transparency. More information will help harness the power of consumers and workers and shareholders so that we can better allocate our purchasing and investment and employment decisions. So, I think that would be a minor step forward.

Boushey: To clarify something: So, all that money that’s sitting on those islands—is it literally just sitting there? Or is it being loaned out and invested in boosting economic capacity somewhere?

Clausing: It is being invested—in fact if you look at the data, about 50 percent of it is back in U.S. financial markets—so, you’re certainly allowed to make types of investments with this money. You’re not allowed to return it to your shareholders as dividends or share repurchases, but you can invest it in a financial institution, and that often makes the funds available to U.S. capital markets.

This repatriation issue is an important one because we are distorting repatriation decisions by having this repatriation tax. But I don’t think we’re dramatically changing the investments found in the United States. The companies that have profits abroad can borrow against them to finance any desired investment. And some of the money isn’t really truly abroad—it’s invested in U.S. assets. To the extent that U.S. investment opportunities are high, we will draw more of the capital into the United States regardless.

Boushey: Interesting.

Clausing: But there are still good reasons to get rid of that distortion—I think either ending deferral or the per-country minimum tax would be an important move in that direction. Of course, the territorial system gets rid of this distortion too, but then you run the risk of exacerbating our large profit-shifting problem unless you’re serious about base protection.

Boushey: I think we’re probably out of time. Thank you so much, Kim.

Clausing: You’re welcome. It was a pleasure talking with you.

Just how tight is the U.S. labor market?

People head to a job fair at Dolphin Mall in Florida.

Overview

Is the U.S. unemployment rate as low as it can go? After years of a very weak labor market, during which many jobless workers gave up trying to find employment due to the lack of employer demand, many economists and analysts now believe the labor market is now as tight as it can sustainably be. The unemployment rate is close to 4 percent, and most of the participants of the policy committee of the Federal Reserve believe the unemployment rate is at or below its long-term rate.31

Download File
Just how tight is the U.S. labor market?

Read the full PDF in your browser

What’s more, recent research by economist Alan Krueger of Princeton University argues that fewer workers will actively search for jobs these days due in part to opioid addiction.32 This kind of view, also articulated by New York Times columnist Eduardo Porter, holds that the problem in the labor market now is one of supply—a lack of available workers eager to work—rather than demand for labor among employers.33

But if the current unemployment rate is indicative of a very tight labor market, then why does wage growth continue to be so tepid? If the supply of potentially employable workers is tapped out, then the price of labor—wages—should grow at an increasingly faster pace. Yet as the unemployment rate has declined and hit levels many associate with “full employment,” wage growth has yet to break out of the range of 2 percent to 2.5 percent per year. One simple explanation of this anomaly of a tight labor market with weak wage growth is that the labor market is not actually that tight.

Indeed, the unemployment rate currently does not do a good job of predicting wage growth. What the data show is that a given unemployment rate can be associated with a wide range of wage-growth levels. This issue brief examines, through regression analysis, the strength of the relationships between various measures of labor market slack and wage and compensation growth. The strongest association for wage and compensation growth is with the prime employment rate, the share of workers ages 25 to 54 with a job. This statistic still stands below its pre-recession peak, suggesting the U.S. labor market is not yet at full employment.

The unemployment rate is still a useful measure of the health of the labor market. But it should be taken in the context of other measures. Even if two labor markets have the same unemployment rate, one will be tighter than the other if their employment rates vary significantly. When assessing the health of the labor market, policymakers have to look at both unemployment and employment. If the U.S. labor market still has room to run, then policymakers should look favorably at monetary and fiscal policies that would increase aggregate demand. This information is particularly important for policymakers at the Federal Reserve as they consider the pace at which they raise interest rates.

Measures of labor market tightness

The unemployment rate is by far the most commonly cited labor market statistic. Using responses from the Bureau of Labor Statistics’ monthly Current Population Survey, workers are reported as unemployed if they do not have a job and have been actively searching for a job in the recent past. The unemployment rate is the number of officially unemployed workers as a percentage of the total labor force. The labor force is the combined ranks of these unemployed workers and workers with a job.

This is why the unemployment rate is a very appealing measure of the health of the labor market. It’s trying to capture the share of workers who want a job (the labor force) but don’t have one (the unemployed). A declining share of the labor force who are unemployed means a tighter labor market because those who want a job are increasingly finding them. It’s possible, however, that there are many workers who are not actively searching but are willing and able to take a job if they think they can find one. If there is a significant number of these workers, then the unemployment rate could be overestimating the health of the labor market.

A measure of the labor market that doesn’t have to make a judgement call about who is or is not likely to get a job is the prime employment rate. This statistic—better known as the prime-age employment-to-population ratio—is simply the share of the population ages 25 to 54 with a job. It, similar to the unemployment rate, comes from the Current Population Survey. By simply counting a worker as employed or not employed, it avoids the ambiguity of the unemployment rate. Whereas a declining unemployment rate may be due to more workers leaving the labor force, a rising prime employment rate will always mean more workers with a job.

The restriction of only looking at prime-age workers helps eliminate potential biases by looking at all workers. Lower employment rates for younger individuals and older workers are mostly for reasons society looks upon favorably: education and retirement, respectively. Looking at workers in their prime working years means the prime employment rate doesn’t see these positive phenomena as a sign of a weak labor market. Indeed, as the U.S. population ages with the baby boomer generation, more workers will retire and push down the employment rate for all workers. Again, that’s not necessarily an indication of a weakening labor market, while including these workers would bias the employment rate toward underestimating the health of the labor market.

Both the unemployment rate and the prime employment rate are “stock” measures of the labor market. They compare the total pool of employed or unemployed workers to the total pool of potential workers. Compare that to “flow” measures that look at the movement of workers between unemployed and employed, or from job to job. These flow statistics not only help us understand what’s driving changes in the two stock measures. Looking at flows can also tell us, for example, if the unemployment rate is increasing because more workers are moving from employment to unemployment or if it’s because of more flows out of the labor force into unofficial unemployment.

A particularly useful group of flow measures is the statistics that capture the movement of workers between jobs. An employment rate can tell us how many people have a job, but data on job switching tell us how frequently already-employed workers are moving to new jobs. Job switching moves with the health of the labor market. As the labor market strengths, employers will poach employees from other firms, adding to the amount of job switching. As more already-employed workers switch jobs, unemployed workers are likely to be hired. But because data on job switching only directly looks at the already employed, it’s useful to think about this measure as showing the tightness of the labor market for already-employed workers. The Job-to-Job Flows (J2J) data from the Longitudinal Employer-Household Dynamics complied by the U.S. Census Bureau is a good source for job switching data.

Measures of wage growth

Before we can determine which labor market indicator can best predict wage growth, we need to decide on what measure of wage growth to use. The most commonly cited measure of wage growth is the average hourly earnings series from the monthly Current Employment Statistics survey. This series measures the average hourly wage rate for workers using data from the payroll of their employers. This means the data are only for cash wages and do not include other forms of compensation such as employer-provided health insurance or employer contributions to retirement savings vehicles such as 401(k) plans.

The lack of coverage of other forms of compensation might be a concern for using the average hourly earnings series, as nonwage compensation has become a larger share of total compensation in recent decades. A data series that had comparable data for both wage growth and compensation growth would be quite useful. Alas, the Current Employment Statistics series only looks at wages.

Another potential issue with average hourly earnings is that it does not adjust for the composition of workers. Why would this matter? Consider the changes in demographics of the workforce. Let’s say a lot of jobs that are created during an economic recovery go to younger workers, who tend to get jobs in occupations with lower wages. The growth of the average wage would be reduced, as the average wage gets pushed down by the addition of these new jobs. Yet there could be stronger wage growth within occupations that gets washed out by the changes in worker composition. Again, the average hourly earnings data from the Current Employment Statistics series does not adjust for composition.

Luckily, though, data from the Employment Cost Index overcomes these limitations.34 The dataset has series for both wages and total compensation, and adjusts for the compensation of the workforce. But one downside to the series is that these data are released on a quarterly basis, so they are updated less frequently than the monthly Current Employment Survey. In this analysis, we will use the series that cover only private-sector workers.

Another question is whether wage and compensation growth should be adjusted for inflation or left in nominal terms. The argument for keeping the wage and compensation in nominal terms notes that changes in inflation that seemingly change wage growth may be transitory in the short-term. But workers care about how much their wages will be able to purchase in the future, so adjusting for inflation also makes sense. This analysis will present results for both nominal series and series adjusted for consumers’ expectations of future inflation, using data from the Survey of Consumers by the University of Michigan.

What measures best predict wage and compensation growth?

The analysis in this issue brief uses two ways of seeing how well various labor market statistics can predict wage and compensation growth. Both involve running what’s known as an Ordinary Least Squares regression analysis on the data to calculate a linear relationship between the labor market statistics and wage or compensation growth. First, the analysis looks at how much of the variation in wage and compensation growth each labor market statistic can explain on its own. Second, the exercise shows how much explanatory power each statistic has when tested in conjunction with other statistics.

A fuller description of the analysis is below, but the results are quite clear. The prime employment rate is the single strongest predictor of wage and compensation growth, both in nominal and inflation-adjusted terms. This is true both when looking at a period starting in the early 1990s, covering the past three expansions, or in early 2000s, covering the past two. When all three variables are included in a regression, a percentage point increase in the prime employment rate is associated with a larger or at least as large an increase in wage or compensation growth as the other two variables.

First, let’s run through the results for the explanatory power of each individual labor market statistic. From the end of the 1991 recession until the second quarter of 2017, the prime employment rate explains about 80 percent of the variation in nominal wage growth, about 52 percent of variation in nominal compensation growth, roughly 60 percent of variation in wages adjusted for inflation expectations, and about 43 percent for adjusted compensation growth.

Compare that to the results for the unemployment rate during that same time period. It explains 50 percent of the variation in nominal wage growth, about 25 percent of variation in nominal compensation growth, roughly 37 percent of variation in wages adjusted for inflationary expectations, and about 22 percent for adjusted compensation growth. (For full results of the regressions covering this time period, see Table 1 in the Online Appendix.)

Figures 1 and 2 below show the relative predictive power of the two different statistics. Figure 1 looks at the relationship between the unemployment rate and nominal wage growth. Not only are the dots spread farther apart, indicating a weak relationship, but the most recent data (the second quarter of 2017) also show wage growth is much lower than would be expected from the historical relationship (the red trend line). Using the trend line, we would have expected 3.2 percent nominal wage growth in the second quarter of 2017 with a 4.4 percent unemployment rate. In reality, wage growth was 2.4 percent. (See Figure 1.)

Figure 1

Figure 2 shows much tighter plots for the prime employment rate and a much smaller difference between the actual most recent data and the prediction from the trend line. We would have expected 2.7 percent nominal wage growth using the prime employment rate as a predictor, which was close to the 2.4 percent of reality. (See Figure 2.)

Figure 2

When we restrict the time period for which we have data from the J2J data (the second quarter of 2000 until the fourth quarter of 2015), the prime employment rate still explains the most variation. For nominal wages, the prime employment rate explains 85 percent, the unemployment rate explains 65 percent, and the job-switching rate explains 67 percent. For inflation-adjusted compensation, the prime employment rate explains 50 percent, the unemployment rate explains 31 percent, and job switching explains 37 percent.

As Tables 3 and 4 in the appendix show, when all three labor market statistics are included in the analysis, the prime employment rate is associated with the strongest increase in wage or compensation growth. Models that include both the unemployment rate and the job switching rate explain less of the variation in wage or compensation growth than the prime employment rate by itself. Interestingly, the job-switching rate seems to have about the same explanatory power as the unemployment rate, with job switching explaining more of the variation in several regressions. (See the Online Appendix for more details on the results from the regressions used in this analysis.)

The results for the unemployment rate are particularly interesting in these regressions. When unemployment is included with the prime employment rate, an increase in the unemployment rate is associated with an increase in wage and compensation growth—the opposite of what we might expect. By including the prime employment rate, these regressions are calculating the relationship between wage and compensation growth and the unemployment rate for a given prime employment rate. In other words, it’s asking how wage growth would change if the unemployment rate went up or down while the prime employment rate stayed the same.

The only way for the unemployment rate to change while the overall employment rate is constant is for either a shift of workers into the labor force from unemployment or from unemployment to out of the labor force. An increase in the unemployment rate in this case would be due to more workers joining the ranks of the officially unemployed, most likely because they are feeling optimistic about the chances of getting a job. In the flip case, a decline in the unemployment rate would be due to flows from unemployment out of the overall labor force. The association with wage and compensation growth makes more sense in this interpretation. (Though, of course, this analysis uses the prime employment rate, so there could be something else going on here. But regressions using the unemployment rate for workers ages 25 to 54 also show a positive relationship). A rising unemployment rate with a constant employment rate would likely be a sign of more labor market optimism—and conversely, a declining unemployment rate in that situation probably indicates pessimism.

Implications

The analysis in this issue brief demonstrates that the U.S. labor market is not as tight as the unemployment rate would have us believe. While this analysis does not directly look at the possibility of workers moving into the labor force, the strong relationship between the prime employment rate and several measures of wage and compensation growth suggest a number of nonemployed workers who can and may find a job are not being counted in the unemployment rate.

As of the third quarter of 2017, the prime employment rate was 78.7 percent. The level of the employment rate associated with a nominal wage growth of 3 percent—the lowest level that could reasonably be called healthy—is 79.2 percent. It would take roughly six more months to get to that level if the prime employment rate grows at the same rate as the previous year. And that would only get the labor market to the lower edge of acceptable nominal wage growth. The labor market does not yet appear to be at full employment.

Many workers who seem locked out of the labor force may, in fact, be able to get a job if the labor market continues to tighten. Research by University of California, Berkeley economist Danny Yagan finds that about three-fourths of the decline in the age-adjusted employment rate was caused by the still-reverberating shocks from the Great Recession of 2007–2009.35 It’s possible that these shocks can be reversed by increasing labor demand via monetary or fiscal policy, bringing workers back into the labor force. Overestimating the strength of the labor market and leaving these workers unemployed would be a tragedy not only for those workers, but for the U.S. economy as a whole.

Why, despite post-racial rhetoric, do racial health disparities increase at higher income levels?

A research technician at the University of Pittsburgh Medical Center collects blood pressure data from a patient.

Persistent disparate health outcomes between black and white Americans are a major contributor to the United States’ poor performance on international measures of health. These disparities cannot be explained by socioeconomic status alone. While health outcomes generally improve with socioeconomic status, the disparity in health outcomes between black and white Americans not only persists but often worsens with higher socioeconomic status.

In my new working paper, “Post-racial rhetoric, racial health disparities, and health disparity consequences of stigma, stress, and racism,” I explore this paradox, placing it within the context of neoliberal rhetoric and the political narrative that the United States has entered a “post-racial” era, and I propose a new framework for empirical research to explore and explain this trend.

One example is that the racial differences in infant mortality actually worsen with higher levels of both education and income. The infant mortality rate for all white women, regardless of education, was 5.07 per 1,000 from 2007 to 2013; for black women, the corresponding figure was 10.81 per 1,000, a ratio of 2.13. When you break down infant mortality rates by education, you find that disparity actually worsens at higher levels of educational attainment. While the infant mortality rate for babies born to white women with at least a bachelor’s degree is 3.36 per 1,000, for babies born to black women with the same level of education the rate is 7.5 per 1,000, which is still more than the rate for babies born to white women with less than a high school degree. The ratio of black to white infant mortality rates for babies born to a mother with at least a bachelor’s degree is 2.23, the highest ratio for any level of educational attainment. (See Table 1). In fact, the ratio rises fairly steadily for each level of educational attainment.

Table 1

This pattern is not limited to infant mortality. An analysis of health data by Ahmedin Jemal and his co-authors found this pattern of mortality disparities with rising levels of educational attainment across many major disease types, including cancer, heart disease, stroke, and HIV-related causes.

That disparities in health outcomes increase with educational attainment flies in the face of American political rhetoric that emphasizes personal responsibility and hard work. This neoliberal rhetoric, combined with a narrative that the United States is now post-racial, places responsibility for continued disparities in outcomes squarely on individual choices and actions and ignores structural factors and an environment of continuing racism. Personal responsibility, hard work, perseverance and—especially—education are supposedly all that one needs to achieve better life outcomes, regardless of where you come from, how much your parents earned, or the color of your skin.

But the evidence contradicts that rhetoric. Across health, wealth, employment, and education, racial disparities persist, regardless of socioeconomic status, in all four outcomes with the exception of one: educational attainment. Ironically, education is an indicator in which blacks perform relatively better than whites once family socioeconomic background is controlled.

So, what explains the increasingly disparate health outcomes for more highly educated black Americans? Research on racial health disparities has largely focused on socioeconomic status as an explanatory factor, as William W. Dressler and his co-authors point out in their literature review of models of racial health disparity. According to this theory, it is because black Americans are overrepresented in lower socioeconomic strata that they have worse health outcomes. However, as we have just seen, even when controlling for socioeconomic status, not only is there still a disparity in health outcomes, but the racial disparities often worsen with more education.

A new framework is needed to analyze the paradoxical health outcomes for high socioeconomic black Americans. Research by Sherman James offers a starting point for this new theoretical framework: “John Henryism,” a reference to the fable of the black railroad worker who beats a machine in a race to dig a tunnel only to collapse to death from his overexertion.

In this framework, the disparate health outcomes of black Americans—especially related to hypertension—are analyzed within the context of the disproportionate race-related stress they face. Blacks from lower socioeconomic strata are presumed to be chronically exposed to psychosocial stress such as threat of job loss, having to make ends meet, and social insults related to race and class, among other factors. They have to exert considerable energy on a daily basis in order to cope with these conditions of uncertainty and corresponding high anxiety. James developed a scale, which he labeled John Henryism, to quantify this “effortful coping,” which measured efficacious mental and physical vigor, a strong commitment to hard work, and single-minded determination to succeed.

In a series of experiments, James found that the combination of high John Henryism ranking and low socioeconomic status was associated with high blood pressure. When examining within races, James found that there was very little difference in blood pressure within socioeconomic strata among whites, regardless of their John Henryism scores. However, among blacks, those with low socioeconomic status and high John Henryism scores had the highest blood pressure. The unfortunate irony is that these findings suggest that blacks who work the hardest to cope with a stressful situation experience worse health outcomes.

While James only analyzed the intersection of socioeconomic status, health, and “effortful coping” within race, his work could provide a framework for further analysis and empirical studies into the paradox of worsening health disparities for black Americans of higher socioeconomic status across race.