Bolstering the bottom by indexing the minimum wage to the median wage

The federal minimum wage today stands at $7.25 an hour, unchanged since 2009 despite rising prices and rising nominal wages for other workers. Without legislative action by Congress every year—a very difficult policy endeavor—the minimum wage for the nation will continue to stagnate. New legislation now before Congress seeks to overcome that perennial policy hurdle by proposing to index the minimum wage to the median wage—the exact middle point in the overall distribution of wages in the U.S. economy—after first raising it to $12 an hour in 2020.

Indexing the minimum wage to the median wage would automatically increase the minimum wage so that it keeps pace with the typical worker’s wage. Currently, 15 states and the District of Columbia index or have future plans to index the minimum wage to the annual rate of inflation, so that when prices rise each year the minimum wage rises accordingly. Indexing the minimum wage instead to the median is different because it links the minimum wage to overall conditions in the labor market rather than to the general level of prices. In this way, those earning the minimum wage experience annual wage gains according to overall demand for labor in the market rather than a less-direct measure of prices. Moreover, wage indexing improves the ability of the minimum wage to reduce inequality.

Indexing the minimum wage to the median is preferable to indexing it to the average wage. Raising the minimum wage would affect average wages, whereas pegging the minimum wage to the median wage would not. This issue brief explains all of these economic reasons for indexing the minimum wage to the median or typical worker’s wage, and shows what an indexed minimum wage would like over time.

View full PDF here alongside all endnotes

Indexing the minimum to median wage is good economics

Indexing the minimum wage to prevailing wage levels accomplishes two goals. First, indexing to wage levels increases the efficacy of the minimum wage as a policy tool to reduce wage inequality. In particular, wage indexing ensures those earning the minimum wage will not increasingly fall behind the typical worker.

Economic research on the minimum wage shows that between 1979 and 2012, more than 38 percent of the rise in inequality between the wage paid to the 10th percentile wage (the bottom ten percent of U.S. workers earn this wage or less) and the median wage is due to the minimum wage failing to keep up with the median wage. By indexing the minimum wage to the median wage, policymakers will help prevent widening disparities between those at the bottom and the middle of the wage distribution.

Second, wage indexing allows the minimum wage to rise in ways that the labor market can easily accommodate. Indexing the minimum wage to the general wage level means that roughly the same proportion of workers will earn the minimum wage year after year when the minimum wage rises. As long as underlying wage inequality does not change too much, fixing the distance between the minimum and median wage will keep constant the share of workers earning at or near the minimum wage.

What’s more, because a minimum wage increase will not alter the share of workers earning the minimum, employers will more easily adjust to regular increases in the minimum wage based on wage-indexing—as opposed to the irregular and larger increases typical of the current federal procedure, and many of the state and local procedures, for setting the minimum wage. Indexing to the median wage would require employers to raise wages for roughly the same proportion of their employees each year, whereas failing to index typically results in employers being required to raise wages for a much larger share of their workforces on less predictable basis.

What an indexed minimum wage would look like

Examining how the minimum wage would change over time if it were indexed to other measures of economic activity, such as prices or wages, is fairly straightforward. Immediately after the increase in the federal minimum wage back in 1996 and 1997, Congress could have indexed the new federal minimum wage of $5.15 an hour. Figure 1 shows how the minimum wage would have risen had it been indexed to the median wage or inflation from 1998 to 2014.

Figure 1

06XX15wage-indexing

Because Congress did not index the minimum to either prices or wages, the federal minimum remained unchanged for a decade before increasing in three successive increases in 2007, 2008, and 2009, to a level in between where it would have been if it had followed the path traced out by either indexing policy. The same figure also illustrates that the federal minimum wage has remained flat now for six years since the 2009 increase.

The median-wage indexed minimum wage is higher today than the minimum wage indexed to the Consumer Price Index because during the late 1990s and early 2000s nominal wages grew faster than inflation, resulting in real wage growth (after accounting for inflation). As a result, the median-index minimum wage would have been more than $8.25 in 2014. The inflation-indexed minimum wage would have been just over $7.60. Either way, the current federal minimum wage is lower than both indexed minimum-wage levels, standing at $7.25 an hour.

View full PDF here alongside all endnotes

We can also consider what the minimum wage would be had we indexed it to the median wage in 1968, which was the high point of the minimum wage relative to the median wage. In 1968, the minimum wage was more than 52 percent of the median wage of full-time workers, whereas in 2014 the minimum wage is about 37 percent of the full-time median wage.  If Congress had indexed the minimum wage to the median wage starting in 1968 than the minimum wage in 2014 would have been $10.21—more than 40 percent higher than the current minimum of $7.25.

Indexing the minimum to the median wage in 1998 or 1968 would have obtained substantially different minimum wages in 2014. The $10.21 minimum wage resulting from an increase in 1968 would have been almost 24 percent larger than the $8.26 that would have resulted from an increase in 1998. This underscores the importance of setting the appropriate level of the minimum wage before indexing it to the median wage. The minimum wage will only help a small portion of the workforce if it is set at a low fraction of the median wage and subsequently indexed. Wage indexing only maintains the position of the minimum wage relative to the typical wage, but indexing does not help set the initial level of the minimum wage.

By linking the minimum wage to the median wage, wage indexing keeps the minimum from falling to levels that many consider to be unfairly low or out of step with broader wage growth in the labor market. In addition, economists and political scientists alike recognize that economic fairness—and specifically the relationship between the minimum wage and the overall distribution of wages in the U.S. economy—is a major determinant of what the American public thinks is appropriate minimum wage policy.

There are precedents for wage indexing the minimum wage

Using the median wage as an index is natural to economists because they typically compare the minimum wage to the median wage in order to gauge the strength of the minimum wage. Where the minimum wage lies in the overall distribution of wages across the economy is central to contemporary economic theory. Academic research on so-called wage-spillover effects relies on comparisons of the minimum to the median wage. And when assessing the strength of minimum-wage policies across countries and across time periods, economists contrast national minimum-to-median wage ratios.

Keeping the minimum from slipping away from the typical wage also has policy precedents. In the run-up to increase minimum wages in the late 1980s and early 1990s, congressional bills included provisions to index the minimum wage to 50 percent of the average wage. And in the United Kingdom today there is an independent body called the Low Pay Commission, which advises the government on the appropriate annual minimum wage increase by factoring in the distance of the minimum wage to the to the median wage.

The median wage is the best wage to use as an index

To index the minimum wage to the general wage level, policymakers should use the median hourly wage instead of the average wage. The median wage is a good index because it is unaffected by the minimum wage. Minimum wages in the United States today cover less than ten percent of the workforce. When the minimum wage rises, it directly increases the wages of these low-paid workers. It also indirectly increases the wages of many of the workers who earn above minimum wage but still fall within the bottom 25 percent of wage earners, leaving the middle or median of the wage distribution unaffected.

This approach is better than using the average wage, or mean wage, as the peg for the index. If the minimum is indexed to the mean wage, when minimum-wage workers receive a raise, the average wage rises, which then increases minimum wages, and so on. Over time this process increases the share of the workforce earning the minimum wage, compelling employers to bear continually larger increases in labor costs.

In contrast, if the minimum is increased in line with the median wage, then the share of the workforce earning the minimum wage will remain roughly constant over time. This is because the median wage moves independently of the minimum wage. The benefit of keeping the minimum wage constant as a share of overall wages is that workers competing for low-wage jobs would find demand for their labor among employers equally constant.

In practice, the potential feedback effects from indexing to the average wage are small in a given year, but they may accumulate to economically meaningful sizes over time. Similar feedback effects would also be present in initiatives to index the minimum wage to the Consumer Price Index. If employers pass minimum wage increases onto their customers as price increases, then the minimum wage would indirectly affect the rate of inflation. These inflationary feedback effects, however, would be much smaller than feedback effects of indexing the minimum wage to the average wage because labor costs comprise only a part of the total costs of the production of goods and services.

The lack of any feedback effects from indexing the minimum wage to the median wage is yet another point in favor of this method of raising the minimum wage on an annual basis. Policymakers in Congress should seriously consider such legislation now in order to institute this new way of raising the minimum wage beginning in 2020.

View full PDF here alongside all endnotes

Mis-measuring U.S. income inequality at the very top

A recent working paper by David Price and Nicholas Bloom of Stanford University, Fatih Guvenen of the University of Minnesota, and Jae Song of the Social Security Administration argues that nearly the entire rise in earnings inequality in the U.S. labor market between 1980 and 2012 is accounted for by rising inequality in average wages across firms. In other words, it isn’t that well-paid chief executives are pulling away from their employees, but rather that the salaries at some firms are pulling away from their competitors—even within the same industry.

The working paper, “Firming Up Inequality,” got a lot of attention because it conflicts with research that shows rising inequality is due in large part to skyrocketing compensation by “supermanagers,” a position advanced by Thomas Piketty of the Paris School of Economics in his book “Capital in the 21st Century” and in separate research by Piketty, Emmanuel Saez at the University of California-Berkeley, and Stefanie Stantcheva at Harvard University, in their 2014 American Economic Journal: Policy  paper “Optimal Taxation of Top Labor Incomes: a Tale of Three Elasticities.” Other analysis of extraordinary CEO pay comes courtesy of the Economic Policy Institute.

My new research note, however, shows that the sampling procedure in “Firming Up Inequality” is biased in two distinct ways. Together, these two statistical biases reduce the scale of rising earnings inequality and hence minimize the very phenomenon the paper seeks to investigate. Importantly, both sources of bias get worse the more inequality grows, which is exactly what happened over the period studied in the paper.

The first problem is that the paper analyzes only a single 1/16th random sample of the distribution of labor earnings in the United States over the full period studied. Normally taking such a large sample of a population wouldn’t bias the outcomes, but it does when the variable of interest is very unequal, as is the case with labor earnings. Analyzing a 1/16th sample biases inferences about inequality because by its very nature a random sampling misses some observations—and the point of inequality is that a small number of observations matter a great deal.

For simplicity, imagine an extreme case with a population of 16 people in which 15 earn nothing and only one person has any earnings. If you select one person at random from this population to estimate the average earnings of all 16 people, then the result will be biased downward (to zero in this case). On average, in 15 out of 16 cases, the estimate of average earnings for the group will be zero, which is too low. Of course, in 1 out of 16 cases—when the highest earner is chosen—the estimate of the average wage of the population will be too high.

Critically, the higher the income of the one person who earns anything, the more biased the result. Continuing with the simple example, the difference between the average wage estimate of zero and the true average wage would be larger.

The second problem is that the paper “Winsorizes,” or caps, the earnings of the top 0.001 percent of earners. The reason why capping top earnings introduces bias is obvious—it eliminates information about the earnings of the very highest earners. The larger share of total earnings they control, the more bias that procedure introduces. The paper does not report the exact number of capped earners, but public data from the U.S. Social Security Administration suggests that in 2013 this would exclude about 1,500 people, who collectively earn at least $40 billion. As a result, the procedure greatly reduces the degree of measured inequality because earnings disparities are so extreme at the very top.

In the note, I conclude that the first source of bias (the small sample) alone is probably not large enough to affect the results, given the current actual level of inequality. But in combination with the second bias from capping top earnings, the results change significantly, especially when “Firming Up Inequality” makes inferences about whether and how much CEO pay contributes to rising inequality.

The most important point here is not biased sampling in this one paper, but rather that inequality inherently introduces a number of methodological concerns that wouldn’t matter if income and wealth were distributed more equally. In “Capital in the 21st Century,” Piketty reports that the share of income of the top one percent was 8 percent in 1979, rising to 20 percent in 2012. If the top 1 percent share were still 8 percent, then the statistics in “Firming Up Inequality” wouldn’t be biased. Because it’s 20 percent, they probably are.

OECD report says income inequality hampers economic growth

Give credit to the Organisation for Economic Cooperation and Development, or OECD—an organization that has so often either mirrored or defined (depending on your point of view) the consensus on economic policy issues—for so thoroughly embracing the idea that high and growing income inequality may well be bad for growth. The Paris-based organization of leading developed and developing economies late last month issued its latest finding in its report “In It Together: Why Less Inequality Benefits Us All, which finds that “econometric analysis suggests that income inequality has a sizeable and statistically significant negative impact on growth.” (Emphasis in the original.)

The new report finds that between 1990 and 2010 gross domestic product per person in 19 core OECD countries grew by a total of 28 percent, but would have grown by 33 percent over the same period if inequality had not increased after 1985. This estimate is based on an econometric analysis of 31 high- and middle-income OECD countries, which concluded that lowering inequality by just one “Gini-point” (a standard measure of inequality used by economists) would raise the annual growth rate of GDP by 0.15 percentage points.

In a world where policies that boost growth rates by one or two tenths of a percent per year are a big deal, these kinds of outcomes are at the high end of what we can reasonably hope from most policy interventions. To give an idea of the scale of shifts in inequality under consideration, OECD data show the United States is about six Gini-points more unequal than Canada; between 1983 and 2012 income inequality in the United States increased just over five Gini points.

Indeed, the implied benefits of reducing income inequality are big for the United States, where inequality has always been high and is rising rapidly by OECD standards. Using the same OECD estimates, if the United States could  reduce its inequality to the level in Canada, U.S. GDP would rise about 0.9 percentage points per year. This is a large effect relative to the average annual growth rate since 1970 of U.S. inflation-adjusted GDP of about 2.8 percent.

The OECD believes that inequalities in access to education are the most important factor behind the connection between inequality and growth.  According to the OECD, “One key channel through which inequality negatively affects economic performance is through lowering investment opportunities (particularly in education) of the poorer segments of the population.” This conclusion is based on the observation that children in low-income families trail children in high-income families with respect to educational attainment (degrees earned and years in school) and with respect to scores on international tests of numeracy and literacy. This relationship holds in all the countries studied, but the educational outcome gaps between rich and poor were bigger when inequality was higher, suggesting that higher levels of inequality exaggerated the disadvantages faced by poor children. As the OECD report notes: “Income availability significantly determines the opportunities of education and social mobility.”

The OECD report complements an Equitable Growth report released earlier this year. In “The Economic and Fiscal Consequences of Improving U.S. Educational Outcomes, Equitable Growth Visiting Fellow Robert Lynch found that improving U.S. educational test scores to levels achieved by Canada would result in greater real GDP growth of $2.7 trillion by 2050, and $17.3 trillion by 2075.

The OECD’s policy discussion and recommendations in this latest report are pretty bold. “Focusing exclusively on growth and assuming that its benefits will automatically trickle down,” the report says, “may undermine growth in the long run.” But, policies that help in “limiting or—ideally—reversing the long-run rise in inequality would not only make societies less unfair, but also richer.” Specific policies discussed include “raising marginal tax rates on the rich … improving tax compliance, eliminating or scaling back tax deductions that tend to benefit higher earners disproportionately, and … reassessing the role of taxes on all forms of property and wealth.”

The econometric analysis behind the conclusions and recommendations is careful, but probably won’t persuade skeptics. The findings are based primarily on a small data set of just over 100 observations on 31 countries at various points over the past four decades. But the results are consistent with a growing body of work finding a negative connection between inequality and growth, including researchers at the International Monetary Fund.

U.S. scholars need access to public and private big data

Big Data holds the promise of a wealth of information to uncover new insights into how our economy works but also the peril of exposing private information that could harm individual citizens. We all know that commercial ventures primarily use data gathered on their customers to track their purchases and spending habits—promising to varying degrees to protect such individual information—but now some private companies are allowing select scholars access to this information for research usage after the companies “anonymize” it.

One case in point is the JPMorgan Chase Institute, which last week unveiled its first report on the financial habits of retail banking customers at JPMorgan Chase & Co. The new research institute tapped into the commercial banking arm’s internal administrative data to determine how income and consumption fluctuate on a monthly and yearly basis. These findings will have important policy implications for lawmakers seeking to improve citizen’s financial well-being.

Researchers are constantly looking for new sources of information in order to answer the most challenging economic questions. But it is important to understand that by definition, JPMorgan Chase’s data can only tell us about their own customers. It cannot give us insight into the whole U.S. population—or even specific demographic groups. To create effective policies, we must gather information on all banking customers, not just those from one bank.

Still, researchers are flocking to private sources of data such as those released by JPMorgan Chase as well as credit-reporting companies. Yet the private sector is not the sole source of administrative data out there. Not by a long shot. The U.S. government holds tax records, school district filings, social security information—the list goes on—in order to administer its tax and benefit programs. Such recordkeeping has gone on for decades, but recent technological advances have made it easier to process these large datasets. Most importantly, government administrative data is representative of the entire population.

But because of perfectly reasonable privacy concerns this data is difficult to access, making a critical source of information—one that could allow us to investigate deep into our economy and provide better questions for policymakers to consider. But when handled correctly, these privacy concerns can be resolved. Those who are able to access the data have done amazing things. Work done using information from the U.S. Internal Revenue Service, for example, has transformed our understanding of the composition of incomes for those at the very top of the income ladder. And using administrative data, Harvard University economics professor Raj Chetty has repeatedly illustrated the extent to which your family and place of birth shape your success later on in life.

Such findings, however, are limited to the few scholars who have the means to gain access to this information. Even Chetty, the most well-known user of government data, must occasionally rely on European countries—many of whom have created secure data systems for researchers—to do his research on retirement subsidies, unemployment insurance, the effects of taxes on labor supply, among others.  Such research tells us a great deal about European economies and their labor markets, but cannot directly translate into usable information for policymakers in the United States—a tragedy for U.S. researchers and policymakers alike.

Because scholars do not have the necessary access to U.S. government data in the same way that European countries provide access, it is welcome indeed that researchers can turn to the private sector. But this is a temporary solution to a much bigger problem. Yes, privacy surrounding government data is an issue. At the same time, we tacitly allow private companies to track our information with little vocal apprehension. What companies find out about us—and in the case of banks, they find out quite a lot—can be used to answer important economic and behavioral questions, but also by firms seeking to expand their profits.

Without full access to public administrative data, U.S. researchers cannot explore Big Data in pursuit of meaningful research. And firms like JPMorgan Chase cannot completely fill that gap. We need both public and private sources of information and, right now, public access is far behind.


Is finance doing what it’s supposed to?

Seven years after the financial crisis and five years into the Dodd-Frank era of better supervision of the financial services industry, why is finance still controversial? Despite significant progress in reducing large financial institutions’ risk of failure and some financial abuses reined in around the edges, there’s ample evidence that much of finance is still detracting from rather than contributing to economic wellbeing.

How do we know? Because even as the global supply of capital soars to new heights, thanks to both expansionary monetary policy and excess private saving, corporate profits, particularly in finance, hit record levels, while average people are still paying a high price for borrowing. This paradoxical confluence of abundant capital for the well-connected and high corporate profits implies that corporations face little competition, because in theory abundant capital would make it easy for competitors or incumbents to expand their profitable operations, driving margins down. These same facts also suggest that what economists sometimes call the “real economy” hasn’t been cut in on the sweet deal available to banks, quasi-banks, and others with access to the privilege of cheap money. The result is a profusion of economic rents—unearned resource extraction by economic actors in a lucky position to profit from their advantage.

These were some of the conclusions from events held by the Roosevelt Institute last Wednesday to release a report called “Rewriting the Rules,” and by the Institute for New Economic Thinking on “Finance and Society” the week before. Both offered alternative interpretations of what the financial sector does, why it has become so large, powerful, and profitable, and what can or should be done to reform it without harming the economy as a whole.

Everyone from Federal Reserve Board chair Janet Yellen and International Monetary Fund managing director Christine Lagarde to Nobel Prize-winning economists Joseph Stiglitz and Robert Solow (as well as random ranters in the audience) noted that finance is a necessary feature of the economy. The sector provides liquidity and channels capital from savers to borrowers. So why were two major conferences held on the premise that something is wrong with a sector whose existence benefits us all?

Because, as most of both events’ participants argued, finance isn’t doing that job. The process of moving capital from savers to borrowers is inefficient and funds are actually flowing in the opposite direction—out of corporations and the real economy and into the hands of the wealthy, providing them with a healthy return on their savings at the expense of everyone paying high prices for loans, for telecommunications, housing, education, and other important products and services. Finance may even be shrinking the pie by redirecting human resources away from productive activities and toward strategizing new ways to divert the flow of cash to narrow private benefit.

That entire structural re-engineering of the economy is the fundamental driver of rising inequality at the top of the wealth and income ladder while everyone else is struggling to make a living in a slack labor market.

At the Institute for New Economic Thinking event, both Esther George, the President of the Federal Reserve Bank of Kansas City, and Claudia Buch, the Deputy President of the German Bundesbank, agreed that by supplying so much liquidity, central banks had in effect done all they could for society. But the rules of the economy, both written and unwritten, don’t automatically translate abundant, low-cost capital for financial institutions into gains for the real economy.

The idea that abundant capital would automatically benefit the rest of the economy is a part of the economics mythology of the “invisible hand”—that the free market will allocate resources–in this case capital–most productively, benefiting everyone. It’s a useful theory when it comes to defeating any challenge to the status quo, but it isn’t actually true. As Robert Solow said at the Roosevelt Institute’s event, we have enough evidence at this point to add a fifth universal element to the classical Greek four: “Bullshit.”

The Roosevelt Institute’s report is a good place to start when it comes to reforming the financial sector and the economy as a whole. But important as individual proposals are, a new narrative is emerging that rejects the false promise of a self-regulating, naturally welfare-promoting economy, with its gears greased by a large and powerful financial sector. There’s nothing natural or foreordained about the economy we inhabit, and past experience shows that meaningful progressive policies do not destroy the foundations of economic wellbeing, but rather create them. That doesn’t mean such reforms are easy to enact, but it does mean that it’s time the ideological walls protecting ever-increasing inequality were breached.


Would graduating more college students reduce wage inequality?

In their influential 2010 book, The Race between Education and Technology, Harvard University economists Claudia Goldin and Lawrence Katz offer an explanation for the United States’ decades-long rise in wage inequality. In their view, the main reason that inequality has increased so much is because the supply of educated workers has not kept pace with an ever-growing demand–especially for workers with a college degree. The short supply of college-educated workers has driven up their price relative to the rest of the workforce, accounting for most of growing gap between workers at the top and the bottom of the earnings ladder. The research implies that the most direct and effective way to reduce the wage gap is to expand the share of the workforce with a college degree.

Goldin and Katz’s diagnosis and prescription represent the predominance of rising wage inequality within academic and Washington policy circles. But, this spring, first in public remarks and later in an interview with the Washington Post, Harvard economist Lawrence Summers declared that focusing on education and training as a way to reduce inequality is “whistling past the graveyard” and “fundamentally an evasion.”

After making these informal comments, Summers–together with Melissa Kearney and Brad Hershbein, both of the Hamilton Project at the Brookings Institution–produced a more formal analysis of how much increasing the share of college-educated workers could aid in reducing inequality. Their more formal analysis concluded “Increasing educational attainment will not significantly change overall earnings inequality” but would “reduce inequality in the bottom half of the earnings distribution, largely by pulling up the earnings of those near the 25th percentile.”

We argue that Hershbein, Kearney, and Summers get it right when they conclude that even a large jump in college attainment would have little impact on overall earnings inequality. But we also believe that they are overly optimistic in their assertion that increasing college attainment will reduce inequality at the bottom.

As Hershbein, Kearney, and Summers correctly argue, expanding the college-educated workforce would do little to lower inequality because “a large share of earnings inequality is at the top of the earnings distribution, and changing college shares will not shrink those differences.” The reason that the top one percent earn so much more than the rest of the workforce is not fundamentally because they have a college or advanced degree. About one third of workers already have a college degree or more, and inequality has increased substantially within that group between 1979 and 2014. As Hershbein, Kearney, and Summers maintain, even a sharp increase in the share of the college-educated population is not likely to put meaningful downward pressure on the earnings of those at the very top.

Their analysis is too sanguine, however, with respect to non-college-educated workers. The authors’ conclusions about workers at the bottom and the middle rest on two assumptions: First, that arbitrarily giving some non-college-educated workers a college degree will automatically give them access to earnings equal to those of existing graduates, and second, that reducing the supply of non-college-educated workers (by turning some of them into college graduates) will boost the earnings of the remaining non-college workers substantially. Both assumptions are unlikely to be true. As a result, the hypothetical plan to bestow 10 percent of non-college-educated men with a diploma would do nowhere near as much for inequality between the middle and the bottom as Hershbein, Kearney, and Summers suggest.

We note that Hershbein, Kearney, and Summers limit their analysis to men, because the period over which they estimate the effect of education attainment on wages is characterized by a large increase in the share of women in paid work, which complicates the analysis. Since the default for working-age men has been market labor throughout the period they analyze, it’s sensible to consider the effect of attainment on the wage distribution of men only, while understanding there are implications for women as well.

To help understand the Hershbein, Kearney, and Summers’ thought experiment, imagine that there are two bowls: one filled with non-college-educated men and one filled with college-educated men. The hypothetical exercise takes 10 percent of the people in the first bowl (of non-college graduates) and puts them into the second one (for college-graduates). This has three effects: It changes earned income for the people in the first bowl (those without degrees) by reducing the supply of non-graduates, bidding up their earnings. It changes earned income for the people in the second bowl (graduates) by increasing the supply, pulling down their wages. And it changes earned income for the people who were moved from the first bowl to the second bowl (from non-graduates to graduates) by giving them access to the higher earnings received by graduates. (See Figure 1.) In each of the three cases, however, the effects assumed by Hershbein, Kearney, and Summers are likely overstated.

Figure 1

hamilton-sim-02

Appealing to a 2010 paper by Daron Acemoglu and David Autor, both economists at the Massachusetts Institute of Technology, Hershbein, Kearney, and Summers argue that shifting 10 percent of men from the first bowl to the second would reduce the wage gap between college and non-college workers by 18 percent, which Hershbein, Kearney, and Summers divide half-and-half between an increase in non-college earnings and a reduction in college earnings. The main basis for that 18 percent estimate is the experience of the 1970s, when the share of college-educated workers increased substantially as the Baby Boomers entered the workforce with far more education than their parents’ generation. This large increase in the supply of graduates arguably drove down the earnings of college graduates relative to the rest of the workforce. When the growth in the college-educated share of the workforce slowed in the 1980s, the college wage premium opened up again. That pattern is the principal motivation for the idea that inequality is primarily “the race between education and technology.”

The decision to divide the 18 percent into two equal parts, with a 9 percent increase in earnings increase for non-college-educated men, drives the reduction in inequality in the bottom of half of earners, one of the key findings that the authors highlight. But the labor market now is very different than it was in the period that Acemoglu and Autor analyze. Since around 2000, the labor market has been deteriorating, jobs are scarce, and the share of the adult population that works has declined. The modest expansion of the mid-2000s did not bring workers back to where they’d been in 2000, and the recovery from the Great Recession of 2007-2009 has not (yet) brought workers back to where they were in 2008. There is simply too much slack remaining in the labor market–for both non-college-and college-educated workers—for reassigning workers from one camp to another to make much difference.

That excess supply is fundamentally why reducing the number of non-college-educated workers (removing workers from the first bowl) is unlikely to increase their earnings by 9 percent. All the college-educated workers who can’t find jobs or are in positions for which they’re over-qualified need to find work or better work first. Only then will we see the emergence of a seller’s market for the non-college-educated, one in which employers have to out-bid each other to find workers. That competition among employers, which we last saw at the end of the 1990s, is what’s necessary to trigger rising wages among the supply of non-college-educated workers.

A second empirical problem with the analysis is that the workers who are assumed to receive an instant college degree are, contrary to a core assumption of the analysis, unlikely to command the kinds of earnings received by those who already have a college-degree. Instead, these hypothetical graduates would continue to compete for the same jobs as the non-college-educated, but the degree would give the graduates a leg up. That, in turn, would push some of the remaining non-college-educated workers out of the labor market entirely.

So, yes, a college degree would improve the individual circumstances of the new graduates relative to those who were not granted an instant degree, but an important part of the payoff would be the ability to out-compete non-college graduates for jobs that don’t actually require a college degree. That, more or less, is what a 2015 study titled “Dropouts, Taxes, and Risks: The Economic Return to College under Realistic Assumptions,” by Alan Benson and Frank Levy of the Massachusetts Institute of Technology and independent economist Raimundo Esteva, finds. The economic benefit to obtaining a college degree for the population that is currently dropping out or otherwise on the cusp of getting one is quite modest. Our colleague Elisabeth Jacobs evocatively referred to this phenomenon as a “Cruel Game of Musical Chairs.” (See Figure 2.)

Figure 2

hamilton-sim-03

It’s worthwhile to place this analysis within the context of a larger debate about the labor market and why it’s not delivering broad-based wage growth to the people who comprise it. Since 2000, median wages have stagnated and the labor market participation rate has fallen, as have the rates of job-to-job mobility and household and small business formation. Young workers are not climbing the job ladder to the middle class. The share of national income earned by workers declined. Over an even longer timeframe, wages have not kept pace with worker productivity.

All of these phenomena suggest that the labor market isn’t working for most employees—problems that aren’t confined to those without a college education—and that suggests the problem isn’t that too few people have college degrees. Rather than focus on education attainment as the solution to inequality, it’s time for policy-makers to move on from the race between education and technology and focus on our stagnant labor market. As Summers said, “the core problem is that there aren’t enough jobs.” The key to reducing inequality is more jobs and a higher demand for labor. In the absence of more jobs, heroic assumptions about educational improvement are likely to deliver only modest economic benefits.


—Marshall Steinbaum is a Research Economist and John Schmitt is the Research Director at the Washington Center for Equitable Growth.

Today’s big U.S. economic trade-off isn’t equality or efficiency

This year marks the 40th anniversary of the publication of the late economist Arthur Okun’s book, “Equality and Efficiency: The Big Trade-Off.” Rereading Okun in 2015, however, feels about as relevant to my work as an economist as does reading Hilary Mantel’s “Wolf Hall,” about 16th century Britain. Both are interesting and enjoyable swings through the historical past–and I highly recommend them–but neither should be used as a roadmap for today’s policymakers.

Okun’s purpose in 1975 was to give political leaders guidelines for how to think about economic policy based on his understanding gleaned over the previous 40 or so years. In his view, policymakers face a trade-off between addressing economic inequality and promoting economic efficiency, which is to say, addressing inequality threatens the foundation for a competitive economy. He uses the idiom “we can’t have our cake and eat it too” to frame his fundamental concern, saying, “We can’t have our cake of market efficiency and share it equally.”

This question led him to steer social scientists toward a narrow focus on the whether and how of the “big trade-off.” He ends his book with this plea: “I do, however, hope to persuade others to share my views about the preconditions for optimization—a more focused public dialogue on the intensities of preferences for equality and a greater research effort by social scientists on the measurement of the leakages. In short, I am pleading for us all to face up to the tradeoff between equality and efficiency.”

Today’s policymakers might pick up Okun’s book as a roadmap for coping with today’s rising inequality. After all, his concern was when and how policymakers should tax the rich to give to the poor. As Okun put it then: “Because the bottom end of the income scale is at the top of my priority list, I shall concentrate largely on the tax-transfer options.” I would argue that this is not today’s question. Focusing on technocratic solutions for helping those at the bottom of the income ladder diverts our attention from what’s really going on in our economy and society today.

“The Big Trade-Off” examines a United States where “the relative distribution of family income has changed very little in the past generation,” and where Okun could argue that the most pressing question was how much equality was enough. Problem is, in the 40 years since Okun’s book was published, the gains of U.S. economic growth have not been shared as widely as they were in the post-war era that Okun examined. While our economy has grown and productivity has improved—that is, American workers produce more goods and services per hour worked—wages and incomes have failed to keep pace. The middle class has seen little growth and the bottom has seen no growth, while incomes at the top have exploded.

According to data from economists Emmanuel Saez at the University of California-Berkeley and Thomas Piketty at the Paris School of Economics, between 1976 and 2007 the bottom 90 percent saw their income grow by an annual rate of ¼ of 1 percent, adjusted for inflation, while the top 1 percent saw theirs grow by 4.4 percent. Put another way—and pulling forward to the most recent year of data—from 1975 to 2013, the top 10 percent of households have accrued 109 percent of all the income gained.

This wasn’t Okun’s economy. Between 1933 and 1975, the top 10 percent took home only 29 percent of the income gains. Certainly, that’s more than their equal share, but the bottom 90 percent did get 70 percent of the growth and saw their incomes rise at a pace of 3.9 percent per year.[i] Okun pondered a trade-off between equality and efficiency just when those at the top of the wealth and income ladder began hauling off all the gains of economic growth.

Our political discourse today is also strikingly different than in Okun’s time. In the era he lived in, there was broad agreement about the role of policy. It’s a world unrecognizable to those of us steeped in the severe partisanship of the Bush and Obama years. Okun could blithely write, “I do not know anyone today who would disagree, in principle, that every person, regardless of merit or ability to pay, should receive medical care and food in the face of serious illness or malnutrition” That is not America today, where lawmakers in Congress and in statehouses around the country push to cut spending on the Supplemental Nutrition Assistance Program and seek to limit the availability of Medicaid made available recently under the Affordable Care Act.

Okun was—as we all are—a product of his time. Specific economic and political realities led him to conclusions that are inapplicable to today’s economy. He argues that our society accepts more inequality in economic assets than sociopolitical assets. He boldly begins his book by saying, “American society proclaims the worth of every human being. All citizens are guaranteed equal justice and equal political rights.” That’s an audacious statement to make 40 years ago and remains so today.

I live on U Street, in Washington, DC, and over the past week protestors have marched through my neighborhood loudly proclaiming, “All lives matter. Black lives matter.” They are marching because citizen-documentarians across the nation have shown the sad truth of police brutality. To point to just one statistic: The unemployment rate for African Americans has held steady at twice the rate of whites for decades. This was true in 1975 and it’s true today.

It’s hard to reconcile today’s political reality with Okun’s bold beginning in “The Big Tradeoff.” Fundamentally, it comes down to whether the lack of economic inclusion for African Americans directly affects their political and social power. If we cannot separate economic and political rights as neatly as Okun does, there’s no other conclusion than that today’s policymakers should be wary—very wary—of taking this book as a roadmap.

Okun’s analysis leads him to dismiss the notion that those at the top can buy political and social power. In his view, we don’t need to worry about the power of those with money because the state has ample strictures in place to keep the “Howard Hughes’s”—who in his day was one of the richest men in the world—from controlling the political process. Of course, he was writing immediately after Watergate and a sense of optimism that campaign finance reform would be effective clearly shaped his thinking. He concluded that such regulation was far better than tax policy for curbing the power of the rich: “If the uses of fat checkbook in the political process can be tightly regulated, the plutocracy will lose much of its political punch.”

We cannot be so sanguine today. Thomas Piketty’s book “Capital in the 21st Century” soared to the top of the best-seller list no doubt because we are a nation looking for answers to what’s happened to our economy and our political system. U.S. economists haven’t been asking those questions or providing those answers in no small part to Okun’s dismissal of the notion that we need to focus on incomes (and power) at the top.

Indeed, Okun missed what would become the biggest question of our times. When Okun was writing, the typical CEO earned about 25 times the typical worker. How could he know that today, they earn nearly 300 times the typical worker? [ii] Given the era he lived in—long before the Supreme Court’s 2010 ruling in Citizens United v. Federal Election Commission that enabled unlimited campaign contributions by multimillionaires and billionaires—perhaps his conclusion was reasonable. Yet Okun’s thinking still dominates economic and political discourse. While policymakers argue whether government aid for the less fortunate in our society is more or less efficient for our economy, the big economic trend of the long-term of a growing gap in productivity and wages and the top income earners pulling further and further away from the rest are not thoroughly examined for their consequences on future U.S. economic growth. It’s taken the work of Piketty—and his many co-authors—to focus us on these larger questions. Piketty’s conclusion is that we need to take swift action, but so long as we remain trapped in Okun’s trade-off, we’re not having the right conversation.

Because Okun began from a premise that assumed that his status-quo economy would continue for the foreseeable future, he focused us on the wrong questions. He asked us to focus on society’s preferences for equality, rather than society’s preferences for a strong middle class. He asked researchers to focus on measuring the “leaky budget”—his term for what is lost to an economy when government tries to ease economic inequality—a technocratic focus that has not served us well. He dismissed the big questions and left us with technocratic debates over how much we should give the poor, rather than how strong and vital our middle class should be.

But, my critique goes deeper. It’s hard not to see Okun’s legacy as the problem rather than the solution. His view that we needn’t focus our energies thinking about the effects of rising top incomes and that the real problem was ensuring that we didn’t veer too far into ensuring equality steered us in the wrong direction. Had we not listened, would we be here today.

[i] Data are computations from the updated Excel files provided by Thomas Piketty and Emmanuel Saez, based on this research: Thomas Piketty and Emmanuel Saez, “Income Inequality in the United States, 1913–1998,” The Quarterly Journal of Economics 118, no. 1 (February 2003): 1–39.

[ii] “CEO Pay Continues to Rise as Typical Workers Are Paid Less,” Economic Policy Institute, accessed May 3, 2015, http://www.epi.org/publication/ceo-pay-continues-to-rise/.

How raising the minimum wage ripples through the workforce

States and cities across the United States are increasing minimum wages within their jurisdictions, sparking other policymakers around the nation and on Capitol Hill to consider whether these changes affect the wages of all workers—not just those at the very bottom of the hourly pay scale who immediately benefit from a higher minimum wage. This question is especially timely this year, as 19 states have already increased the minimum hourly wage. And many cities are also boosting low-income workers’ pay, among them Oakland, CA, which increased its minimum wage to $12.25 an hour, and Seattle, WA, which now requires large employers to pay at least $11.00 an hour.

So how will these boosts in pay across the nation affect workers? In addition to minimum wage workers who receive a direct increase, which portions of the workforce receive indirect raises from a minimum wage increase? When our nation’s capital, Washington, DC, raises its minimum wage in July to $10.50, how will that affect the wages of workers who already earn $11.50?

This question is important for gathering a more complete understanding of the effects of raising the minimum wage beyond the lowest-paid workers. This issue brief explores the available economic research on these ripple effects, finding that increases in the minimum wage do raise the wages of those earning above the minimum wage. These ripple effects are critical to reducing wage inequality between those earning low- and middle-class wages.

Although the minimum wages enhances the bargaining power of many low-wage workers, an increased minimum wage’s effectiveness in doing so dissipates as it spreads across the wage spectrum, essentially disappearing for middle-class wage earners. At the same time, assessing the exact impact of raising the minimum wage on specific earners may require higher-quality hourly wage data on all workers than is currently available in standard household surveys in the United States.

View full PDF here alongside all endnotes

What are minimum wage ripple effects and how do they occur?

In a recent study, Arindrajit Dube of the University of Massachusetts-Amherst, Laura Giuliano of the University of Miami, and Jonathan Leonard of the University of California-Berkeley find substantial evidence of a ripple effect in a large U.S. retailer’s pay policies. In 1996 and 1997, the federal government raised the minimum wage of $4.25 an hour in two steps to $4.75 and $5.15. The authors find that the large retail company, which was promised anonymity in order to provide data for study, raised its wages by 30 to 40 percent across its entire hourly workforce even though only 5 to 10 percent of this national firm’s employees earned less than the minimum wage.

There are good reasons to expect to see this same kind of ripple effect of raising the minimum wage more broadly in the U.S. labor market. In particular, economic theory suggests that increasing the minimum wage will raise the wages of other workers when employers need to compete for workers, as in some search-and-matching models of the labor market. Imagine all firms occupy rungs on a ladder, ranked by how well they pay their workers. After a minimum wage increase, the lowest paying firms raise their wage to the new minimum. This leads the next rungs of higher-paying firms to raise wages as well—to increase their ability to recruit and retain workers who would have better options elsewhere due to the minimum wage increase. The minimum wage then filters its way up the labor market, with ripple effects declining in influence further up the ladder.

Alternatively, workers may care about how they are paid relative to other workers at in their own workplace. After a minimum wage increase, will a supervisor be content with a wage similar to her now more highly paid staff? To the extent that employees are concerned about relative wages within a business, firms may raise wages in accordance with their institutional norms.

Whether ripple effects are largely market-mediated across firms or are instead based on relative pay concerns within the firm are open questions that get to the heart of wage-setting mechanisms in the labor market. The research by Dube, Giuliano, and Leonard on the large U.S. retailer suggests that within-firm pay concerns may matter a great deal because they affect how employees search for jobs. The retail industry famously boasts a high rate of employee turnover, and the authors find that workers quit their job significantly less often after minimum wage increases. This effect, however, largely occurs through relative pay concerns, such as when a worker receives a pay raise relative to her peers, she is far less likely to quit than if she had not received that relative increase in pay.

In addition to this one case study, economists find general evidence of these kinds of ripple effects from raising the U.S. minimum wage. The best estimates, though, appear in research conducted by economists David Autor of the Massachusetts Institute of Technology, Alan Manning of the London School of Economics, and Christopher Smith of the Federal Reserve Board. They study all state and federal minimum wage increases from 1979 through 2012, and measure the effect of the raises at each point of the wage distribution.

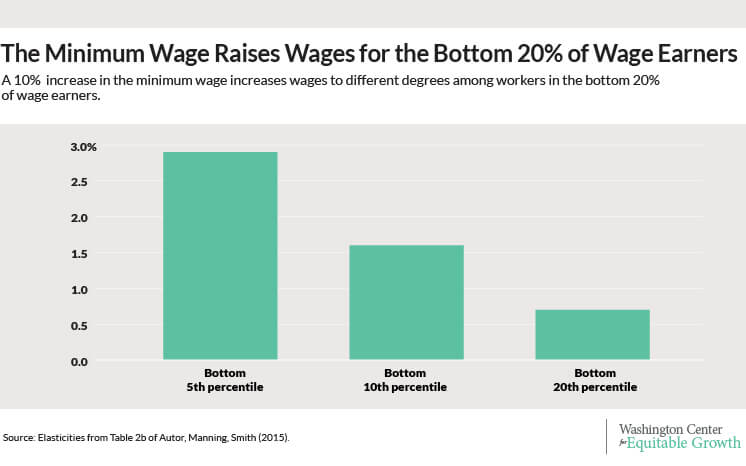
The authors find that the sharpest wage increases due to raising the minimum wage occur for workers at the bottom five percent of the wage scale, where U.S. minimum-wage workers are most likely to be concentrated. A ten percent increase in the minimum wage raises that 5th percentile wage by about 2.9 percent. The study also finds evidence of ripple effects as the minimum wage increases wages for workers who make more than the minimum—and that these ripple effects dissipate the further one moves up the wage ladder. The same ten percent minimum wage increase raises the wages of workers at the 10th percentile of wages by about 1.6 percent and raises the wages of those in the 20th percentile by a statistically significant 0.7 percent. After the 25th percentile, wage effects are typically very small and statistically indistinguishable from zero. (See Figure 1.)

Figure 1
How do ripple effects affect wage inequality?

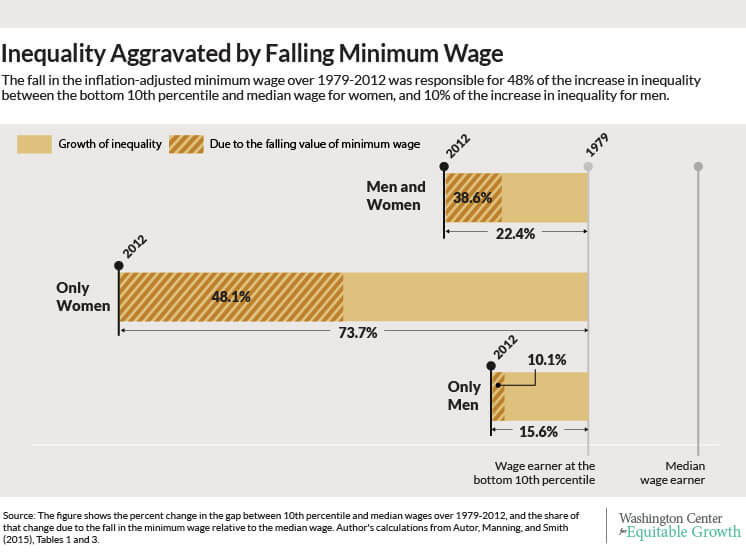
A ripple effect for the bottom 20 percent of workers has important implications for wage inequality among workers in the United States. Over the 1979-2012 period studied by Autor, Manning, and Smith, the real (inflation-adjusted) value of the minimum wage fell and wage inequality increased, with those workers at the bottom 10 percent of the wage scale falling relative to the median wage by more than 22 percent. The authors estimate that the declining minimum wage during that period was responsible for nearly 39 percent of the increase in wage inequality between the typical worker at the middle of the wage spectrum and the worker at the bottom ten percent. Without ripple effects, the minimum wage may not have affected inequality at all because most minimum wage workers fall below the tenth percentile wage during the study period. (See Figure 2.)

Figure 2

Because women are generally paid less than men and therefore fall closer to the bottom of the wage spectrum, the minimum wage has larger effects on female wage inequality. For wage inequality among women, Autor, Manning, and Smith find that the minimum wage had particularly strong consequences. Between 1979 and 2012, the declining minimum wage was responsible for 48 percent of the increase in female wage inequality between the bottom and middle of the wage distribution. (See Figure 2.) This finding highlights that raising minimum wages in general disproportionately affects women. A female employee is more than 60 percent more likely to be a minimum wage worker than a male employee.

As significant as these ripple effects seem on their own and for the causes of wage inequality, Autor, Manning, and Smith themselves raise an important concern about these estimates: could the results simply be a product of survey measurement error? The authors rely on the best available source for U.S. wage data, the Current Population Survey of households, but misreported wage data in this survey poses a problem for distinguishing true ripple effects from fiction.

To understand why misreported data may skewer the findings about ripple effects, consider the current minimum wage of $7.25, which is roughly at the 4th percentile of wage earners. If the wage data contain substantial measurement errors, then some of these workers earning the minimum wage may misreport higher wages, perhaps reporting wages up to the 10th percentile. In that case, even if there were no ripple effects, raising the minimum wage above $7.25 will appear in the data as though it increased wages at the 10th percentile, even if that didn’t happen in reality.

Although measurement error in the U.S. survey data may complicate estimates of the size of the ripple effects of raising the minimum wage, better quality data suggests these ripples do exist. The recent study of a U.S. retailer by Dube, Giuliano, and Leonard, which used high-quality payroll data, is one case in point. Similarly, using employer-reported data in the United Kingdom that may be more accurate than U.S. household survey data, Richard Dickens of the University of Sussex and Alan Manning and Tim Butcher of the UK Low Pay Commission find that although the minimum wage only affected the bottom 5 percent of the wage distribution, ripple effects extended to the 25th percentile.

Conclusion

Both the theoretical and empirical research point to economically meaningful ripple effects from raising the minimum wage, although even the best measurements of the exact size of these effects in the United States are not completely certain. The evidence also seems clear that in the short run, minimum wages do not appear to have ripple effects for those workers earning middle-class wages or higher. In particular, the kinds of changes in the minimum wage that the United States experienced over the past three decades do not seem to affect the median wage or the wages of those at the top. Minimum wages, then, are an important piece of the policy toolkit affecting wage inequality and boosting stagnant wages at the bottom of the wage ladder. Improving middle-class wages will require other strategies.

—Ben Zipperer is a research economist at the Washington Center for Equitable Growth

How to bypass U.S. estate taxes

Tomorrow is tax day, which comes amid a burgeoning debate around our annual payments to Uncle Sam. One particular fight has broken out this week over the estate tax— which affects only those Americans with estates worth more than $5.43 million per person or $10.86 million per married couple. This means the estates of 99.85 percent of all Americans will not be subject to the estate tax.

What’s more, this debate on estate taxes misses one critical point—that a loophole allows many of those who are wealthy enough to face estate taxes to largely bypass the law altogether. This is done through the clever usage of a complicated tax-preferred savings vehicle called a Grantor Retained Annuity Trust, or GRAT, which those at the tippy top of the U.S. wealth and income ladder use to pass on their estate to heirs without it being subject to the full estate tax.

Here’s a basic description of how GRATs work. The first step for the very wealthy is to place a large amount of assets into a GRAT, with instructions that the entire amount should be returned to them over a specified period of time (two annual payments over two years, for example). Because individuals are not taxed when gifting to themselves, no taxes are levied on the original value of the assets placed in GRATs. Any earnings in excess of the assets originally placed in these GRATs accrue to trusts that are bequeathed to specified beneficiaries.

When the GRAT is first set up, the U.S. Internal Revenue Service gives a “gift value” estimate, based on the IRS “Section 7520 Code,” of how much they expect the assets to increase in value. Once the term of the GRAT expires, the wealthy individual who set up the GRAT, the grantor, will have received the original contribution plus this theoretical interest. In December 2014, the 7520 code was 2 percent. So if an individual created a two-year GRAT in that month and put in $1 million, they should receive back the original $1 million contribution and 2 percent interest via annuity payments through December 2016. Any excess appreciation earned beyond the original contribution and IRS assumed rate of return can be transferred to beneficiaries—estate tax free.

Not surprisingly, many savvy grantors will put assets in GRATS that have a good chance of increasing exponentially more than assumed rate of return set by the IRS. Many of the original Facebook founders, for example, put their pre-IPO Facebook stock into GRATs—and then saw their value increase well beyond the predicted IRS rate. Or consider gambling magnate Sheldon Adelson, who set up GRATs during the Great Recession of 2007-2009 using much of his Las Vegas Sands Corp. stock, which had plummeted in value. Because the stocks’ value rebounded as the U.S. economy recovered, he was able to shelter a half a billion dollars for his heirs, none of which will be taxed.

Even if the initial value of the GRAT does not increase to these degrees,  giving heirs $100,000, let’s say (which, relative to some GRATS, is actually small), grantors can continuously reinvest their money in GRATS again and again until they die. And doing so is court approved. A 2000 U.S. tax court ruling found that Audrey Walton’s (part of Walmart Stores, Inc.’s Walton family) GRAT was indeed legal as long as the grantor is alive. If grantors die during the term of their GRATs, all the assets are indeed subject to the inheritance tax (making a short-term, two-year GRAT a popular option among older grantors).

The Obama administration proposes to discourage such practices by requiring a 10-year minimum term on GRATs, but the probability of enacting any kind of restriction in the current political climate is slim. Very wealthy Americans are not obligated to report how much each GRAT passes on to heirs. But one estimate puts the amount that bypassed the estate tax at $100 billion since 2000.

The estate tax was originally enacted in 1916 in order to break up the oligarchic power base created during the Gilded Age of the late 19th century. The soaring wealth gap was not squashed altogether, although it was greatly diminished in part through the economic transformation instigated by World War II. Yet the estate tax has provided a relatively consistent stream of government revenue ever since. What’s troubling, though, is the loophole’s contribution to today’s widening wealth gap, which is at its highest point since the 1920s.

There is a valid debate to be had over the degree to which the estate tax can help alleviate rising wealth and income inequality in the United States, but it remains somewhat irrelevant if the premise on which that debate is based—the existence and enforcement of an estate tax for the wealthiest families—is far too easy to circumvent through the use of GRATs or other similar loopholes.


Determining the optimal U.S. tax rate for higher earners

There are two constants in life: death and arguments about the optimal top marginal tax rate. The proper level of income taxation in the United States has been a hotly contested topic since the creation of the first federal income tax more than a century ago. The debate over the optimal tax rate has only intensified in recent years, as income and wealth inequality in the United States increases while taxes on the rich decline. Policymakers need an empirical answer to the question of the optimal level of taxation on top incomes.

How exactly do economists calculate an optimal level? Until very recently, economic research sought to determine the optimal rate by using just one concept—the highest tax rate that would maximize the amount of revenue collected, bearing in mind the disincentive to work created by taxation. Yet the most cutting-edge evidence tells us that our current estimates of the optimal tax rate are inaccurate because they’re missing important additional pieces of information about the behavioral response to taxes.

View full PDF here alongside all endnotes

So what is the optimal tax rate for top incomes? In order to determine that rate, policymakers should instead consider the following three ways that top earners might respond to tax changes:

  • by varying the supply of their own labor (working less)
  • by shifting between different types of income (wages and capital) to avoid taxes
  • by bargaining for different compensation levels from their employers


In this brief, we examine these three possible responses to higher taxes among the wealthy—responses that economists call elasticities—as posited by economists Thomas Piketty of the Paris School of Economics, Emmanuel Saez at the University of California-Berkeley, and Stefanie Stantcheva of Harvard University. Cutting to the chase, the three authors find that the optimal rate of taxation is much higher when we consider the responses quantified by three different elasticities as compared to one elasticity.

The analysis by Piketty, Saez, and Stantcheva finds that the optimal top tax rate is 83 percent. In contrast, the optimal rate using only one elasticity is 57 percent, which in turn compares to the current higher marginal tax in the United States of 39.6 percent. While 83 percent seems like a very high number, the underlying analysis of the paper is persuasive. Yet, the real take-away is the way the three authors calculate the much higher tax rate, and the importance of top earners bargaining for their compensation in calculating the optimal rate. U.S. policymakers need to understand the more complex responses of high earners to different tax rates. This new understanding is important given the country’s rising economic inequality and the relationship this rising inequality has to economic growth.

What is an elasticity?

Economists often seek to examine how responsive one economic variable will be to a change in another: What is known as an elasticity. Often they’ll explore the elasticity of Variable A to Variable B, such as the elasticity of employment to changes in the minimum wage or the elasticity of work hours to increases in the marginal tax rate. The resulting calculation of that elasticity would tell you how responsive the one variable is to changes in another. The larger the magnitude of the number, the larger the change.

In the case of the employment and the minimum wage, think of an elasticity of -0.1. This would mean a 10 percent increase in the minimum wage would result in a 1 percent decline in the level of employment. Or consider the elasticity of work hours to increases in the marginal tax rate, which economists calculate at -0.2—meaning a 10 percent increase in the marginal tax rate would result in a 2 percent decline in hours worked.

Obviously, many variables are at play in the complex U.S. economy. This is why factoring in other elasticities is important for economists to explore and for policymakers to understand.

A new approach to the problem

In their paper “Optimal Taxation of Top Labor Incomes: A Tale of Three Elasticities,” economists Piketty, Saez, and Stantcheva overturn conventional wisdom on optimal taxation by introducing empirical tests of three key ways that taxes can affect the behavior of top earners. The authors argue that the optimal tax rate for top earners isn’t the result of just one kind of response to taxation, but rather three different kind of behavioral responses, or three elasticities.

When the authors calculate the optimal tax rate using only the criteria that the rate not reduce the amount of time top earners spend working, they find that the optimal top tax rate would be 57 percent. But the authors argue that using just one elasticity misses out on too much that’s going on with the behavior of top earners when tax rates are changed. Instead, we should consider three elasticities.

Elasticity 1: Labor supply response

The labor supply of top earners is economic parlance for the amount of time wealthy individuals will put into work instead of leisure. To find the elasticity of their working hours to the tax rate  they pay, the authors first calculate the “supply side” elasticity, which measures the sensitivity of the labor supply of top earners to changes in the top tax rate. As the tax rate increases, individuals start to re-evaluate the trade-off between working and earning more money and not working and enjoying leisure time. If top earners were to stop working then the reduction in the labor supply would not only reduce the amount of taxes collected but, more importantly, could be harmful to economic growth.

That’s why policymakers need to know how responsive to taxation top earners are when it comes to their willingness to work. If they are very responsive, then the optimal tax rate could be lower, all other things being equal. If they are less responsive, the rate could be higher.

The authors calculate this first elasticity by looking at how both the share of income going to top earners in the United States, and U.S. economic output (measured by gross domestic product per person) changed as the top tax rate changed. They find that as the top tax rate went down between 1960 and the end of 2012 the top 1 percent of earners were able to keep more of their income but the growth of GDP per capita didn’t increase. That means this first elasticity is pretty low, at most 0.2.

In short, top earners do not substantially vary their labor supply in response to tax rates.

Elasticity 2: Tax avoidance

Another way that top earners can respond to taxation is to change the kind of income they receive so that they can avoid a higher tax rate. If the tax rate on labor income increases then top earners might shift their income toward capital income that is taxed differently. A chief executive officer at a big corporation, for example, might get his compensation shifted from purely salary to include stock options, which when exercised are treated as capital income. This doesn’t mean the top earners are changing their behavior. Rather they are trying to shelter their money from taxation.

A higher elasticity, or responsiveness, means that an increase in the tax rate would make the earner very likely to change the kind of income they earn. A low elasticity means that an earner would not change her source of income based on changes in the tax rate. In a situation where this elasticity is high, top earners will simply shift all their income away from labor and toward capital—so a high tax on the labor income of top earners would yield little revenue.

To calculate this elasticity, the authors compare the trends in the share of labor income going to the top 1 percent to the trends in the share of income that includes capital gains. What they find is that the trends of the two data series are nearly identical. In fact, Piketty, Saez, and Stantcheva say their estimate for the second elasticity is 0. Top earners in the United States do not tend to shift their income sources in response to changes in the tax rates.

Elasticity 3: Executive compensation bargaining

Many top earners are corporate executives. According to one estimate, 41 percent of the top 0.1 percent of income earners are executives, managers, or supervisors. A growing body of research demonstrates that corporate CEOs and other members of the corporate “C suite” (chief financial officers, chief information officers, chief operating officers, and the like) are not  responsible for all the gains in the company’s economic performance for which they are compensated. In other words, a substantial share of top corporate executives’ earnings are comprised of funds from the firm that might otherwise go to other workers, investments in the firm, or to shareholders.

When tax rates are lower, executives have a stronger incentive to bargain for higher compensation. And since this compensation isn’t necessarily due to higher productivity, the struggle is zero-sum—if executives receive compensation for productivity gains they aren’t responsible for then funds that would go toward other ends get diverted. Piketty, Saez, and Stantcheva explain that a higher elasticity means that executives are more likely to bargain for higher pay when tax rates are lower and therefore receive funds that might go elsewhere within the firm.

In order to calculate this elasticity, the economists look at international data to determine the relationship between top tax rates and CEO pay. The data show that in countries with lower tax rates, CEOs have higher average incomes after accounting for the kinds of industries in which their companies compete. Piketty, Saez, and Stantcheva interpret this finding as the sign of a high third elasticity, which they calculate conservatively at 0.3 at the lowest. This would mean a higher tax rate on top earners would reduce what economists call rent-seeking—the taking of undue compensation—within the firm, potentially increasing wages for average workers.

Conclusion: The optimal rate?

The research presented in “Optimal Taxation of Top Labor Incomes: A Tale of Three Elasticities,” by economists Piketty, Saez, and Stantcheva, suggests that the conventional wisdom around optimal taxation rates for top earners is missing some nuance in how top earners respond to taxation. Including the bigger picture would seem to leave substantial room for an increase in rates on top earners. Piketty, Saez, and Stantcheva’s calculate that the optimal top tax rate comes out to 83 percent, once their three elasticities—labor supply, tax avoidance, and bargaining—are combined.

Compare that result to the result of 57 percent when economists only consider the overall elasticity of income to tax rates. This level is also much higher than the current top federal income tax rate of 39.6. This isn’t to say that our current top tax bracket should be raised to 83 percent tomorrow. Rather, this is the optimal rate for those at the very top of the income ladder. The top tax bracket would have to be changed in order to tax only those individuals or households at the very tippy top at this new 83 percent rate.

The results of this research also indicate that the rise in income inequality at the very top of the income spectrum was driven primarily by the decline in tax rates, which allowed top earners to get higher incomes without increasing the pace of economic growth. So the main take-away from latest research is clear: Tax rates in the United States on incomes at the very top could be much higher without affecting output growth and potentially boost wages for average workers.