Should-Read: Betsey Stevenson: Manly Men Need to Do More Girly Jobs: “Donald Trump wants America to make things… bring iPhone assembly to the U.S…
…If he really wants to help his supporters, though, he should think twice about what kinds of jobs to promote…. Nearly half the private-sector jobs in the 1940s and ’50s were in the goods-producing sector. Today less than one in six are. The service sector has more than made up for the losses…. Lower-skilled men don’t seem to want service jobs….
Policy wonks like me have wondered why more lower-skilled men aren’t adapting…. Occupations conflict with traditional notions of masculinity. They require sitting, caring and communicating, as opposed to working with big machines…. The challenge for men is much greater than what women faced in the 1960s through the 1980s, when the latter entered the workforce in greater numbers. Women’s new role clashed with social norms around femininity, but they were able to merge the two…. By encouraging men to cling to work that isn’t coming back, Trump… [will] ll have to do something out of his comfort zone: make girly jobs appeal to manly men.
This strikes me as a bad mistake: fiscal needed to create space to normalize interest rates and give Fed room to fight next recession https://t.co/49djGBQRdS
If the Federal Reserve wants to have the ammunition to fight the next recession when it happens, it needs the short-term safe nominal interest rate to be 5% or more when the recession hits. I believe that is very unlikely to happen without substantial fiscal expansion. No, at least in the world that Janet Yellen sees, “fiscal policy is not needed to provide stimulus to get us back to full employment.” But fiscal policy stimulus is needed to create a situation in which full employment can be maintained. It would be a rash economist indeed who would forecast a short-term safe nominal interest rate above 3% when the time for the next loosening cycle arrives:
Thus if we do not shift to a more expansionary fiscal policy–and the higher neutral rate of interest that it brings–now, what do we envision will happen when the next recession arrives? Do we trust that congress and the president will then understand and react appropriately in a timely fashion and at the right scale to deal with the slump in aggregate demand?
Once again, it would be a very rash economist who would forecast that. An FOMC that does not press strongly for more expansionary fiscal policy now is an FOMC that is adopting a policy that threatens to make life very difficult indeed for their successors between two and six years from now.
And, of course, there is the chance–I see it as a substantial chance–that full employment is attained at a prime-age employment-to-population ratio of not 78% but 80%–or 81.5%. In that case, Janet Yellen is wrong to say that “fiscal policy is not needed to provide stimulus to get us back to full employment.”
Nick Bunker: What Could Boost U.S. Business Investment?: “German Gutierrez and Thomas Philippon… why business investment… has been so lackluster since the turn of the 21st century…
Simon Wren-Lewis: Ann Pettifor on Mainstream Economics: “Unfortunately her piece is spoilt by a final section that is a tirade against mainstream economists which goes way over the top…
Jacob Levy: The Defense of Liberty Can’t Do Without Identity Politics: Since Hayek’s time, liberalism has become more, and more self-consciously, amenable to what’s sometimes (and usually derisively) called “identity politics.” This is progress to hold onto, not a mistake to be abandoned…
What Is the Excellence of an Economist?: I have been thinking about John Maynard Keynes’s observations on the mysterious difficulty of being a first-class economist that I quoted a while ago (H)
I have been thinking about John Maynard Keynes’s observations on the mysterious difficulty of being a first-class economist that I quoted a while ago:
John Maynard Keynes (1924): Alfred Marshall: “The study of economics does not seem to require…
…any specialised gifts of an unusually high order. Is it not, intellectually regarded, a very easy subject compared with the higher branches of philosophy and pure science? Yet good, or even competent, economists are the rarest of birds. An easy subject, at which very few excel! The paradox finds its explanation, perhaps, in that the master-economist must possess a rare combination of gifts. He must reach a high standard in several different directions and must combine talents not often found together. He must be mathematician, historian, statesman, philosopher—in some degree. He must understand symbols and speak in words. He must contemplate the particular in terms of the general, and touch abstract and concrete in the same flight of thought. He must study the present in the light of the past for the purposes of the future. No part of man’s nature or his institutions must lie entirely outside his regard. He must be purposeful and disinterested in a simultaneous mood; as aloof and incorruptible as an artist, yet sometimes as near the earth as a politician…
I have been thinking about it because a couple of weeks ago I ran across a comment I once made:
The model says that attempting a 4%-point increase in government revenue as a share of GDP in Greece may well push you over the top of the Laffer Curve. It follows immediately that the excess burdens of a 1%-point increase are overwhelmingly large. It then follows immediately that any tax increases at all are inadvisable. Thus the only deficit-reducing policies that might possibly be advisable are those that cut spending. It would, therefore, seem to me that the paper ought to consist of one paragraph–that Greece is near the top of the Laffer Curve, hence what it urgently does not need is any tax increases–followed by fifteen pages documenting this claim on which all else depends: that Greece is near the top of the Laffer Curve. Yet those fifteen pages are missing…
It seemed to me very clear what was going on the moment I read: “We do not push the model to generate the full 4 percent increase in the [Greek] primary balance as a share of 2014 GDP… [because it] could push capital and labor taxes into the downward sloping portions of the Laffer curve…” And yet the well-regarded authors then spent fifteen pages calculating benefit-cost ratios–which were, of course, much less than one–rather than documenting their belief that Greece is near the top of the Laffer Curve.
I have been thinking about this Keynes passage in the context of Dani Rodrik’s “don’t blame economics–blame economists!”
It strikes me that a first-class economist needs to have a firm grasp of:
The economic models that might be used to analyze the situation.
The benefits and drawbacks of each possible model, and the reasons to on balance prefer one particular model and one particular analysis.
What dangers the assumptions needed to make one’s chosen model tractable expose one to.
…Rodrik argues that economics is not the problem, economists are… idealization, abstraction, utilization of unrealistic assumptions, methodological individualism are not problems as long as one appreciates the diversity of economic models and accepts the fact that each economic model is an attempt to understand some real world relationships in isolation. Market favoritism is not a problem of economics… [but] rather a problem created by some overconfident economists…. Economics is more pluralist than it appears…
…economists have chosen to act like institutions simply do not exist. Consider, as an example, the debate over fiscal stimulus. Economists have spilt vast amounts of ink over the last eight years…. What factors affect the multiplier on fiscal stimulus?… When is fiscal stimulus a necessary complement to monetary stimulus? How does government debt affect long-run economic growth (and how does fiscal stimulus affect government indebtedness)?… The crucial question regarding whether or not to use fiscal stimulus was a completely different one—which is more corrosive to the legitimacy of the institutions which make the prosperity of a liberal, global economy possible: a long economic slump, or a short-term stimulus so large that it inevitably leads to spending on low-return projects or lines the pockets of government-friendly firms? We were all tying ourselves in knots working out whether the multiplier on infrastructure spending was 0.7 or 1.2 or 2.5, when what we ought to have been asking was: what course of action is most likely to avert a crisis of institutional legitimacy that will leave everyone much worse off….
These sorts of macroinstitutional questions… [are] very hard…. It seems reasonable to argue that bail-outs for banks amid broad woes for workers led to a loss of confidence in the system. But what is that “confidence in the system”? How does it work? What is the relationship between an individual’s confidence and the public’s as a whole? How is it cultivated? How does it interact with other institutions, macro and micro? Can we measure it? But lacking the tools or theory to think through something does not mean that something isn’t important. It certainly doesn’t mean that academic economists should pour massively more effort into research describing the smallest details of models which assume macroinstitutions aren’t important…. Big-picture books by Daron Acemoglu and James Robinson, Thomas Piketty, and Branko Milanovic move gingerly in the right direction. Much more is needed…
Jobs—and quality jobs—are on everyone’s mind. Policymakers on both sides of the aisle are keen to address the economic shifts that wiped out more than 5 million manufacturing jobs since 1990, leaving a growing number of families financially insecure and victim to the country’s growing economic inequality.
But what many policymakers miss is that the growth in services sector has added more jobs than were lost in manufacturing—9 million over the same time period. These jobs are fundamentally different in nature. Manufacturing, for example, boasts a higher proportion of men. But according to a recent report by the Institute for Women’s Policy Research and Oxfam America, many of the occupations that will add the most jobs by 2024, including health care support, administrative assistance, early childhood care and education, and food preparation and services, are comprised of more than 70 percent women. Meanwhile, a growing number of men have stopped looking for work all together. This begs the question: Why aren’t men taking these jobs?
Last week, University of Michigan economist Betsey Stevenson wrote a piece for Bloomberg View arguing that the lack of men in these jobs is due in part to men’s reluctance to embrace traditionally feminine roles. Many of these new services jobs include duties such as cooking, cleaning, and caregiving, which she argues may not exactly appeal to someone concerned with their masculine demeanor. But Stevenson contends that if we care about getting men back to work, we have to make these “women’s” jobs more appealing to men as well.
Yet the lack of appeal of these jobs to many men might not only be because they are “feminine.” The Institute for Women’s Policy Research and Oxfam report identified the 22 fastest-growing, female-dominant occupations and found that they are characterized by low wages, a lack of benefits, and unpredictable schedules. This is the reality for the one quarter of working women employed in one of these professions, all of which pay less than $15 an hour and with few opportunities for advancement. Women of color are overrepresented in these occupations, which means that this pattern contributes to racial inequality as well.
No wonder men aren’t exactly excited about rushing back into a poor-quality job.
It’s notable, however, that not all of these jobs can be characterized as “low-skill.” In fact, workers in these low-wage, female-dominated professions are better educated yet still earn less compared to workers in other low-wage jobs. So why are these female-dominant jobs paid so little if they have become such a critical part of our economy?
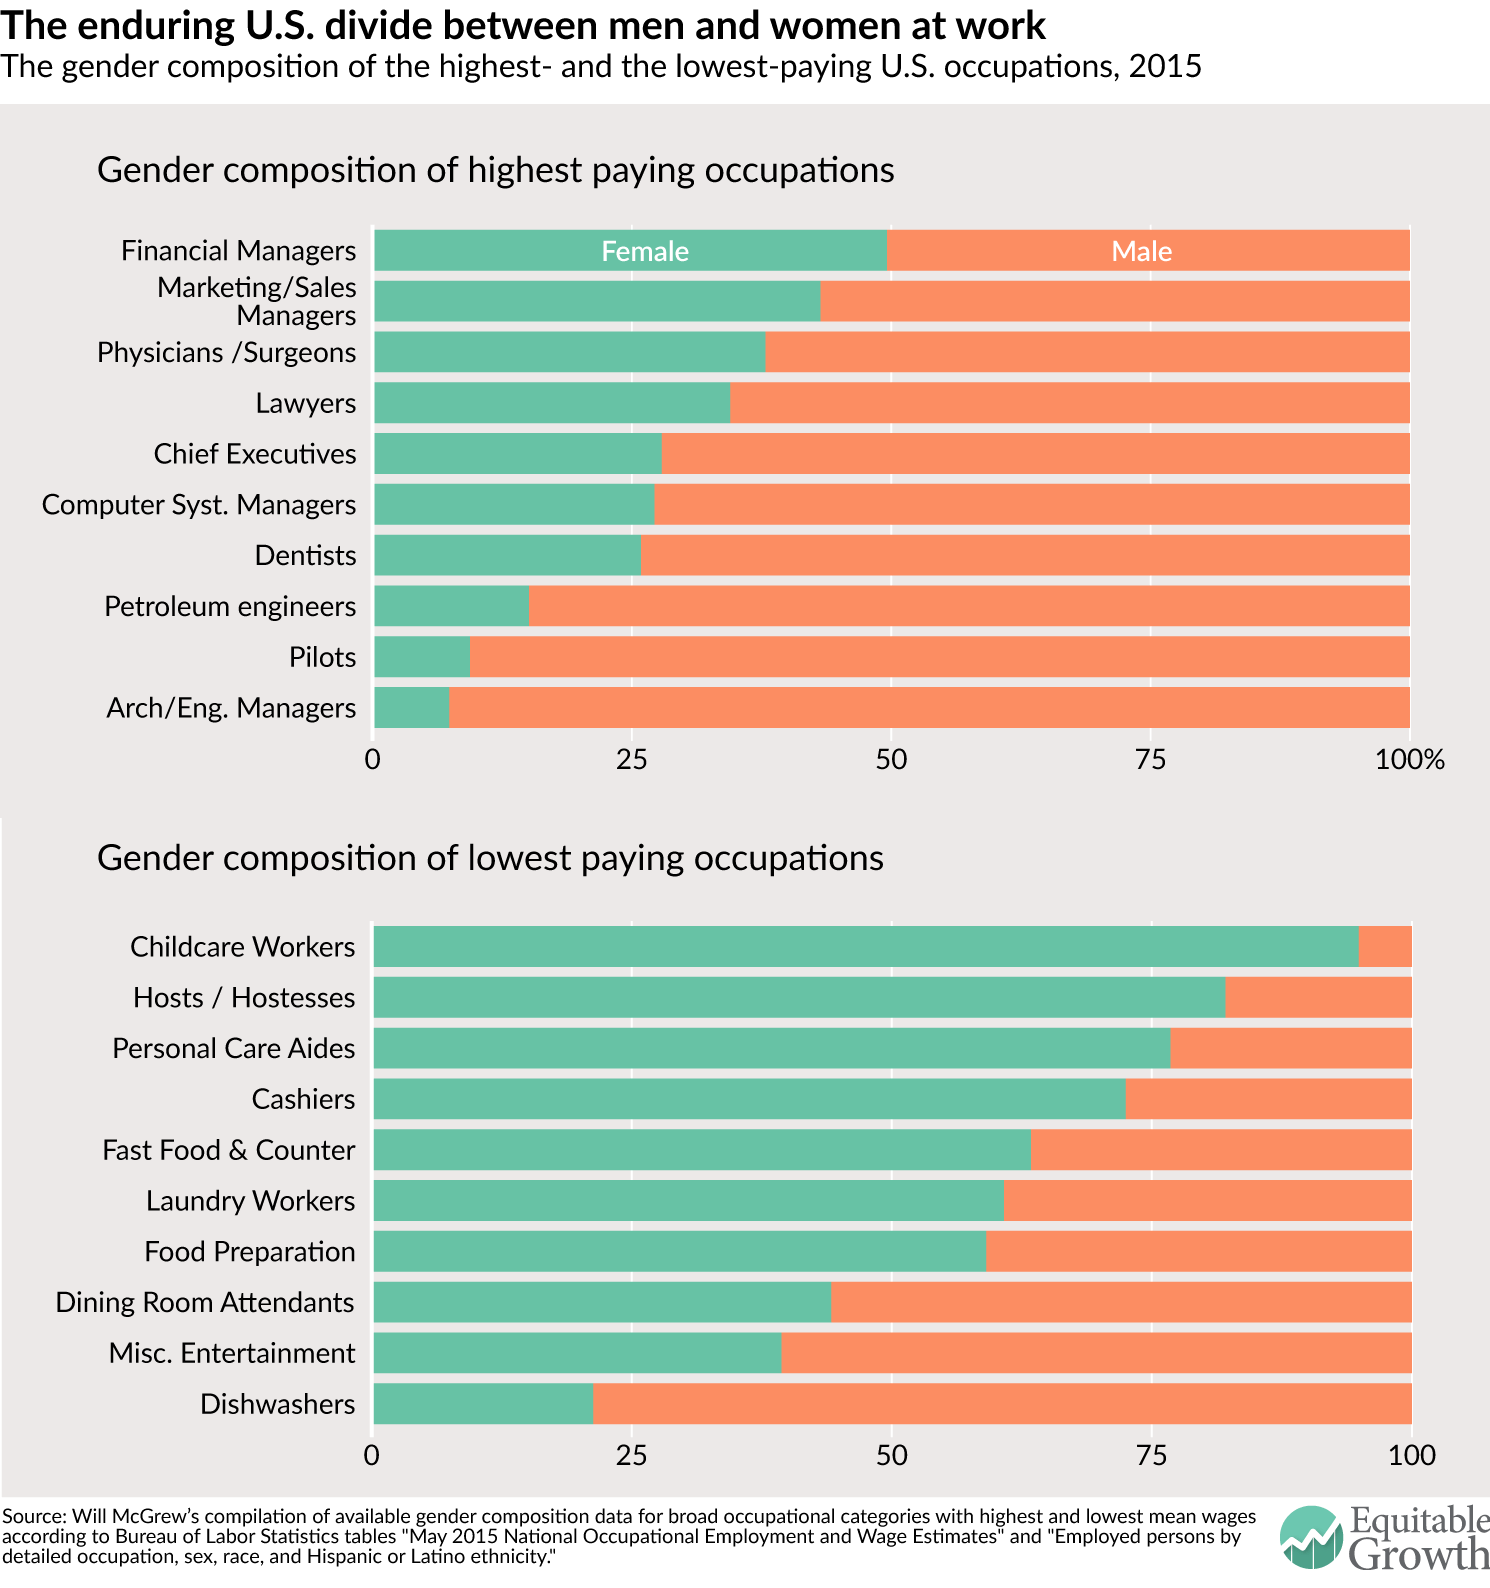
The report suggests these jobs include work, such as caregiving, cleaning, and cooking, that women have historically done for free, and were undervalued once they became paying jobs outside the home. But part of the lack of pay also is because work done by women, whatever it is, isn’t valued as much in the marketplace. A study by Cornell University economists Francine Blau and Lawrence Kahn finds that the difference in jobs that men and women work in is the largest cause of the gender pay gap. Occupations that have more men tend to be better paid regardless of skill or education level. (See Figure 1.)
Figure 1
Just one case in point—last year janitors were paid $142 more per week on average than housekeepers, despite the similar nature of the jobs, according to the U.S. Bureau of Labor Statistics. Another study by New York University sociologist Paula England finds that the amount of women in an occupation helps determine whether it is low- or high- paying. As the rate of women working in a given occupation increases, the pay in that occupation (even when controlling for education, skills, race, and geography) declines.
Addressing the way racial and gender inequities can influence job quality is one aspect of promoting these occupations as a jobs for all Americans, not just women. But considering that most families in the United States today rely on women’s earnings, policymakers must start with addressing the working conditions of those already employed in these professions.
When I was working in the Treasury in 1993, I was struck by how much it was the case that President Bill Clinton was still the ex-Governor of Arkansas, and that arguments that would have been powerful and important when directed at a Governor of Arkansas still resonated in his mind much more strongly than they perhaps should have if they were evaluated purely on technocratic grounds.
Arkansas, remember, was a small, poor state, heavily dependent on coupon-clipping from the Walton family and on the ability of Tyson Chicken to export to other states as its engines of economic growth. Those put constraints on Arkansas and make certain factors salient for Arkansas in ways that do not apply to the country as a whole.
Donald Trump has been a real estate developer–and a failed casino manager. The same where-he-comes-from-determine-which-arguments-resonate should apply here.
There thus ought to be an elective affinity between Donald Trump and proper technocratic fiscal policy: he ought to be very responsive to the very strong case for a real and substantial infrastructure construction-led fiscal expansion–and remember that investing in the human capital of twelve year olds is a very durable piece of infrastructure indeed. The math that shows that at current interest rates borrow-and-build is indeed a no-brainer for the economy is math that ought to be very familiar to Donald Trump.
And he ought to be very responsive to the Yellen caucus in the Federal Reserve. Very much like Reagan in 1980, Donald Trump has been told and from personal experience knows very different things about the Federal Reserve. by some that we need rigid Taylor Rules and has been told by others that we need a Gold Standard, but he also knows that high interest rates kill real estate values, real estate deals, and the solvency of real estate developers. Reagan’s goldbug and loose-money staffers fought each other to a standstill, and Volcker was left alone to manage the economy as best he could. There is a potential fight between the Donald Trump who develops real estate and the Donald Trump who wants to be a good Republican fighting for Republican causes he doesn’t really resonate with. My bet is that, if the issue can be properly framed, the valid technocratic arguments for loose money will prevail inside Donald Trump’s head, given the natural elective affinity with his past career.
And there is much to be done here…
One of my proudest moments was when, back in 1992, Larry Summers and I egged each other on to tell the Federal Reserve at Jackson Hole that, given the magnitude of recessionary shocks and the vulnerability of an economy to the zero lower bound, it was too hazardous to try to push the average inflation rate much below 5%/year. Great call. Completely correct. Totally ignored. One that I am very proud of.
But a 2%/year inflation target was set in stone for the U.S. by Alan Greenspan in the 1990s. Thereafter the Federal Reserve system fell in line and coalesced around finding reasons why that target was a good thing–not analyzing whether it was in fact a good thing.
It is now clear that it is not a good thing: shocks are too large. Perhaps the 2%/year target was appropriate if the Great Moderation was permanent. It wasn’t. We have radical uncertainty of many kinds, and a 2%/year target will have us slam into the zero lower bound appallingly often. The target inflation rate should be raised to 4%/year.
The only argument for keeping the 2%/year inflation target is that it helps build the Federal Reserve’s credibility. But the credibility that comes from doing stupid things consistently and persistently is not the kind of credibility you want to build or have, is it? It is important that people trust your promises. But the promises that you want to make and that you want credibility for are promises that you will do the right and smart thing–not the wrong and dumb thing–and thus that you will correct policies that turn out to have been clearly mistaken.
Germany does not have the rise of the overclass. And Germany does have the wage stagnation–even though it is done everything right to preserve manufacturing employment and nurture communities of engineering practicing excellence.
Can I take the Germany-U.S. comparison as strong evidence against the “globalization has driven wage stagnation” hypothesis?
Hmong Americans are less likely than the average American to have a household income over $50,000, be employed, or be a college graduate. But the livelihoods of these families, which originally hail from Southeast Asia and mostly migrated to the United States at the end of the Vietnam War, get lost in the aggregated data provided by local, state, and federal agencies. The reason: More than 17 million members of nearly 50 different races and ethnicities are generally categorized as a monolithic group—Asian Americans and Pacific Islanders.
When it comes to economic success in the United States, Asian Americans and Pacific Islanders are often pointed to as the exemplary achievers, or more stereotypically, the “model minorities.” But the rosy narrative that all the members of this group are relatively homogenous and successful puts many of these communities, such as Hmong Americans, at substantial risk of being underserved by their local, state, and federal governments.
Aggregated data for all Asian Americans and Pacific Islanders’ socioeconomic indicators, such as median income, employment rate, and educational attainment, helps to preserve ethnic-based inequities among many sub-groups in this catch-all category. Taking a closer look at the data through detailed race and ethnicity categories provided by the U.S. Census Bureau’s American Community Survey, we find a different story: Asian Americans and Pacific Islanders in the United States are richly diverse, and so too are their socioeconomic experiences. Through a series of four chart-based examples, this brief details how data disaggregation matters for Asian American and Pacific Islander communities.
1.
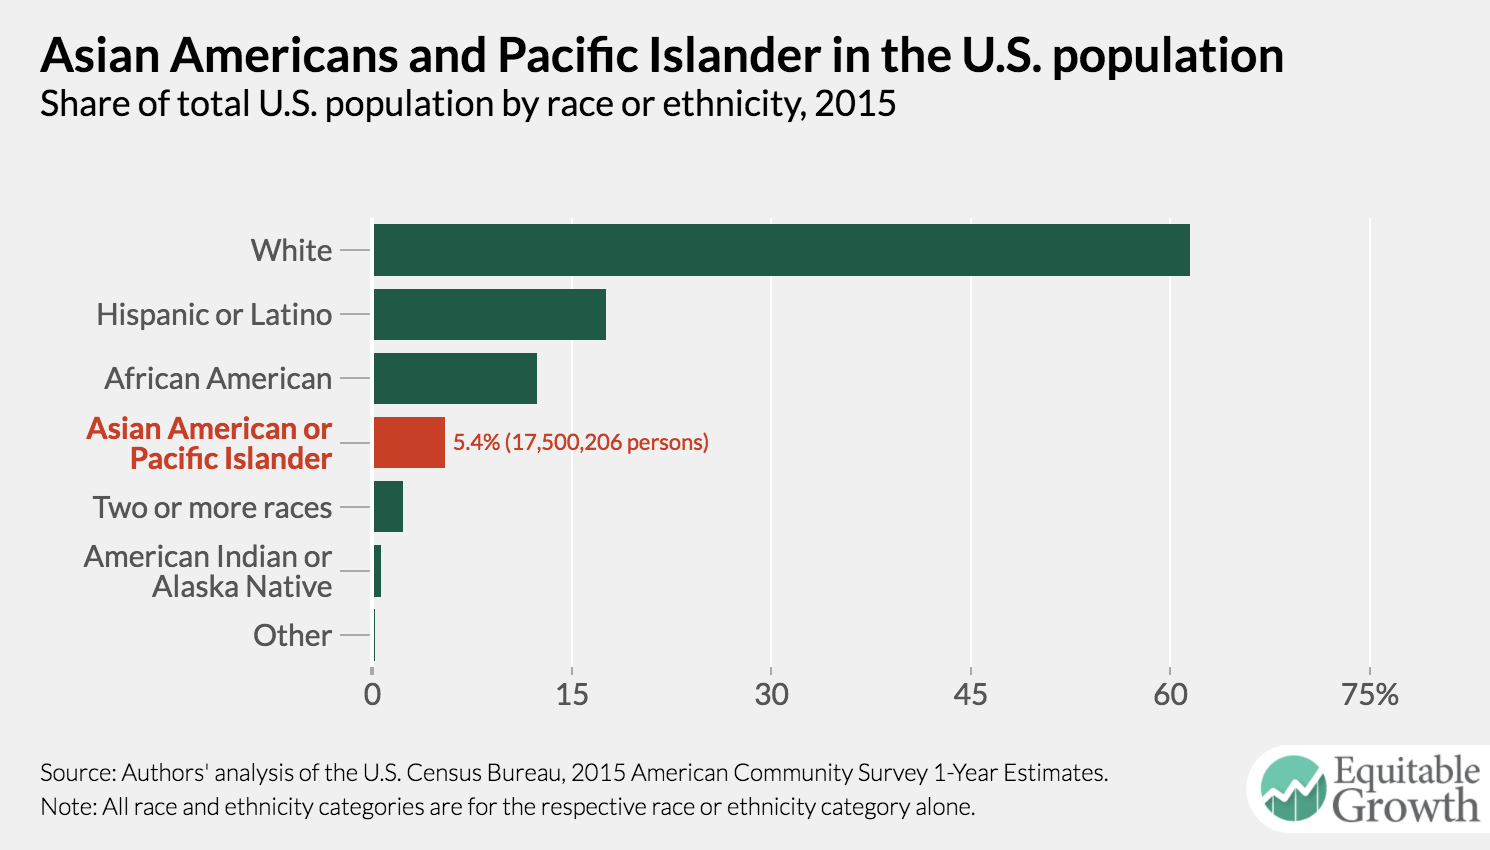
Asian Americans and Pacific Islanders are a small but diverse part of the U.S. population
Currently, there are more than 17 million Asians and over 500,000 Pacific Islanders in the United States. Although they make up only 5.4 percent of the U.S. population—a number that is projected to grow to 9.3 percent by 2060—they are composed of more than 50 different ethnic groups, speaking hundreds of different languages.
Though we don’t necessarily have data on every single ethnicity among all Asian Americans and Pacific Islanders in the United States, a cursory breakdown of their population by ethnic group or national origin reveals how diverse, and complex, the term actually is.
Breaking down the Asian American and Pacific Islander population in the United States
Use this interactive to explore the diversity of the share of the population in the United States comprised of Asian Americans and Pacific Islanders. Start by hovering over each circle.
disaggregating asian/PI
Unpacking Asian Americans and Pacific Islanders by detailed ethnicity or region of national origin yields at least four groups of Asians (East, Southeast, South, and other Asians) and four groups of Pacific Islanders (Melanesians, Micronesians, Polynesians, and other Pacific Islanders). These regional categorizations can be broken down even further. East Asians, for example, include people of Chinese, Japanese, Korean, Mongolian, Okinawan (not featured), and Taiwanese descent. East Asians also happen to be the largest population group within the category of Asian Americans as measured by the American Community Survey (about 1.96 percent of the U.S. population), driven by a large share of people of Chinese ethnicity (approximately 1.23 percent of the U.S. population). Polynesians (which include Native Hawaiians, Samoans, Tongans, and other smaller groups that aren’t captured in the American Community Survey data) are the largest group of Pacific Islanders but only make up about 0.09 percent of the U.S. population.
Disaggregating the race and ethnicity of Asian Americans and Pacific Islanders cuts an already small minority group into even smaller factions. Yet it simultaneously reveals the extent of cultural heterogeneity within the group. This diversity has significant implications for the lived experiences of different members of these many communities, which is why aggregate statistics on their socioeconomic health—and other indicators, for that matter—often mask more than they reveal.
2.
Asian Americans and Pacific Islanders boast highly variable income levels that are invisible in aggregated data
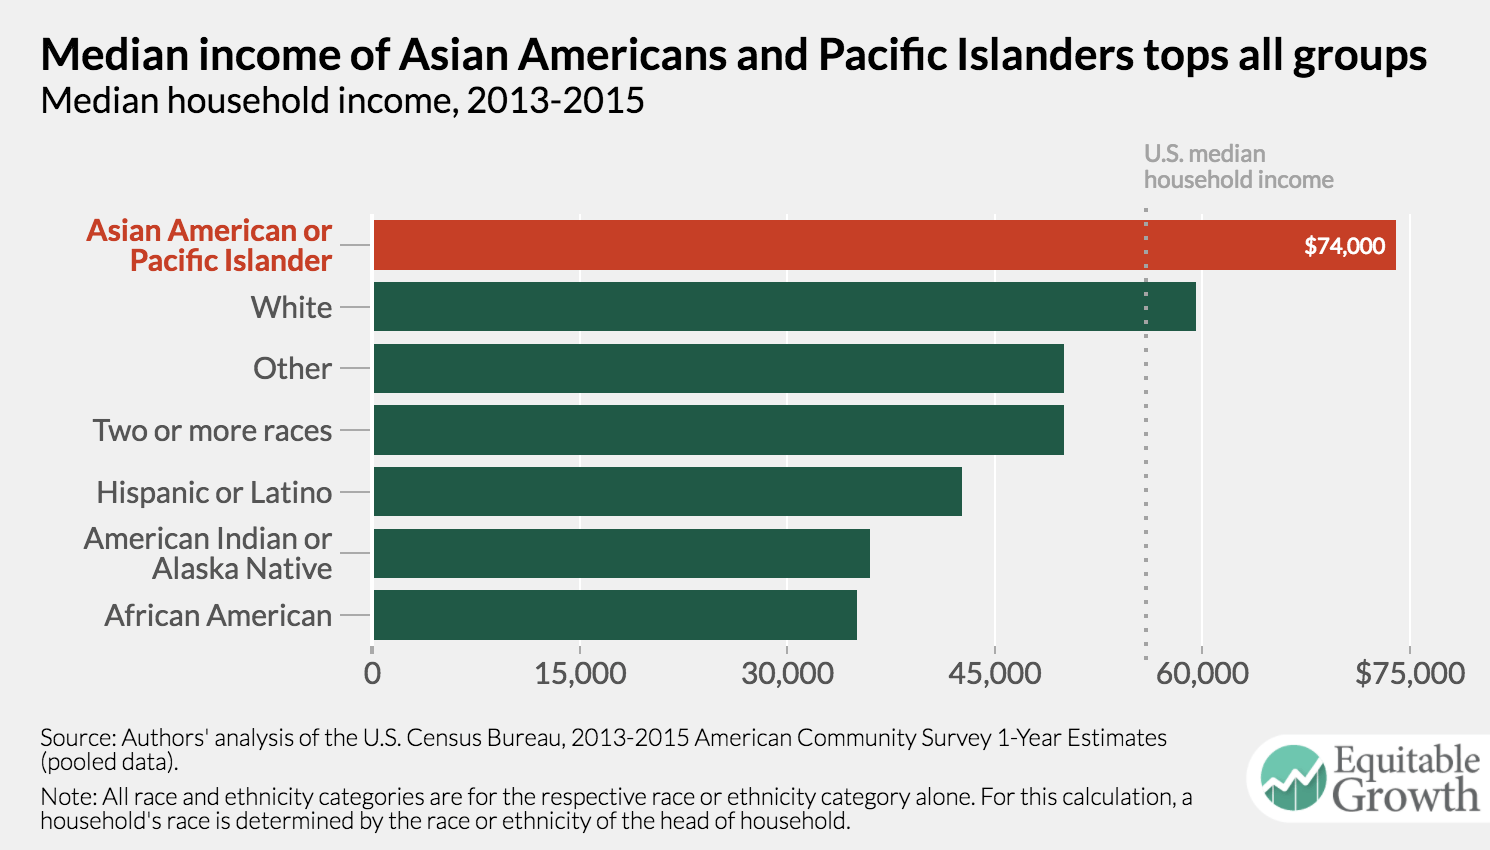
Household income is perhaps the most frequently used barometer of socioeconomic health. In 2015, the national median household income was $55,775. By comparison, Asian American and Pacific Islander households had median household incomes of $74,000.
When aggregated, these households earned $14,000 more than even the typical white family and appear to have more than double the median income of the two lowest-earning groups, American Indians and Alaska Natives and African Americans. It’s also important to note that Asian Americans and Pacific Islanders are the most likely group to have three or more working individuals per household, meaning that the aggregate data may be skewed to suggest these households are wealthier than they are.
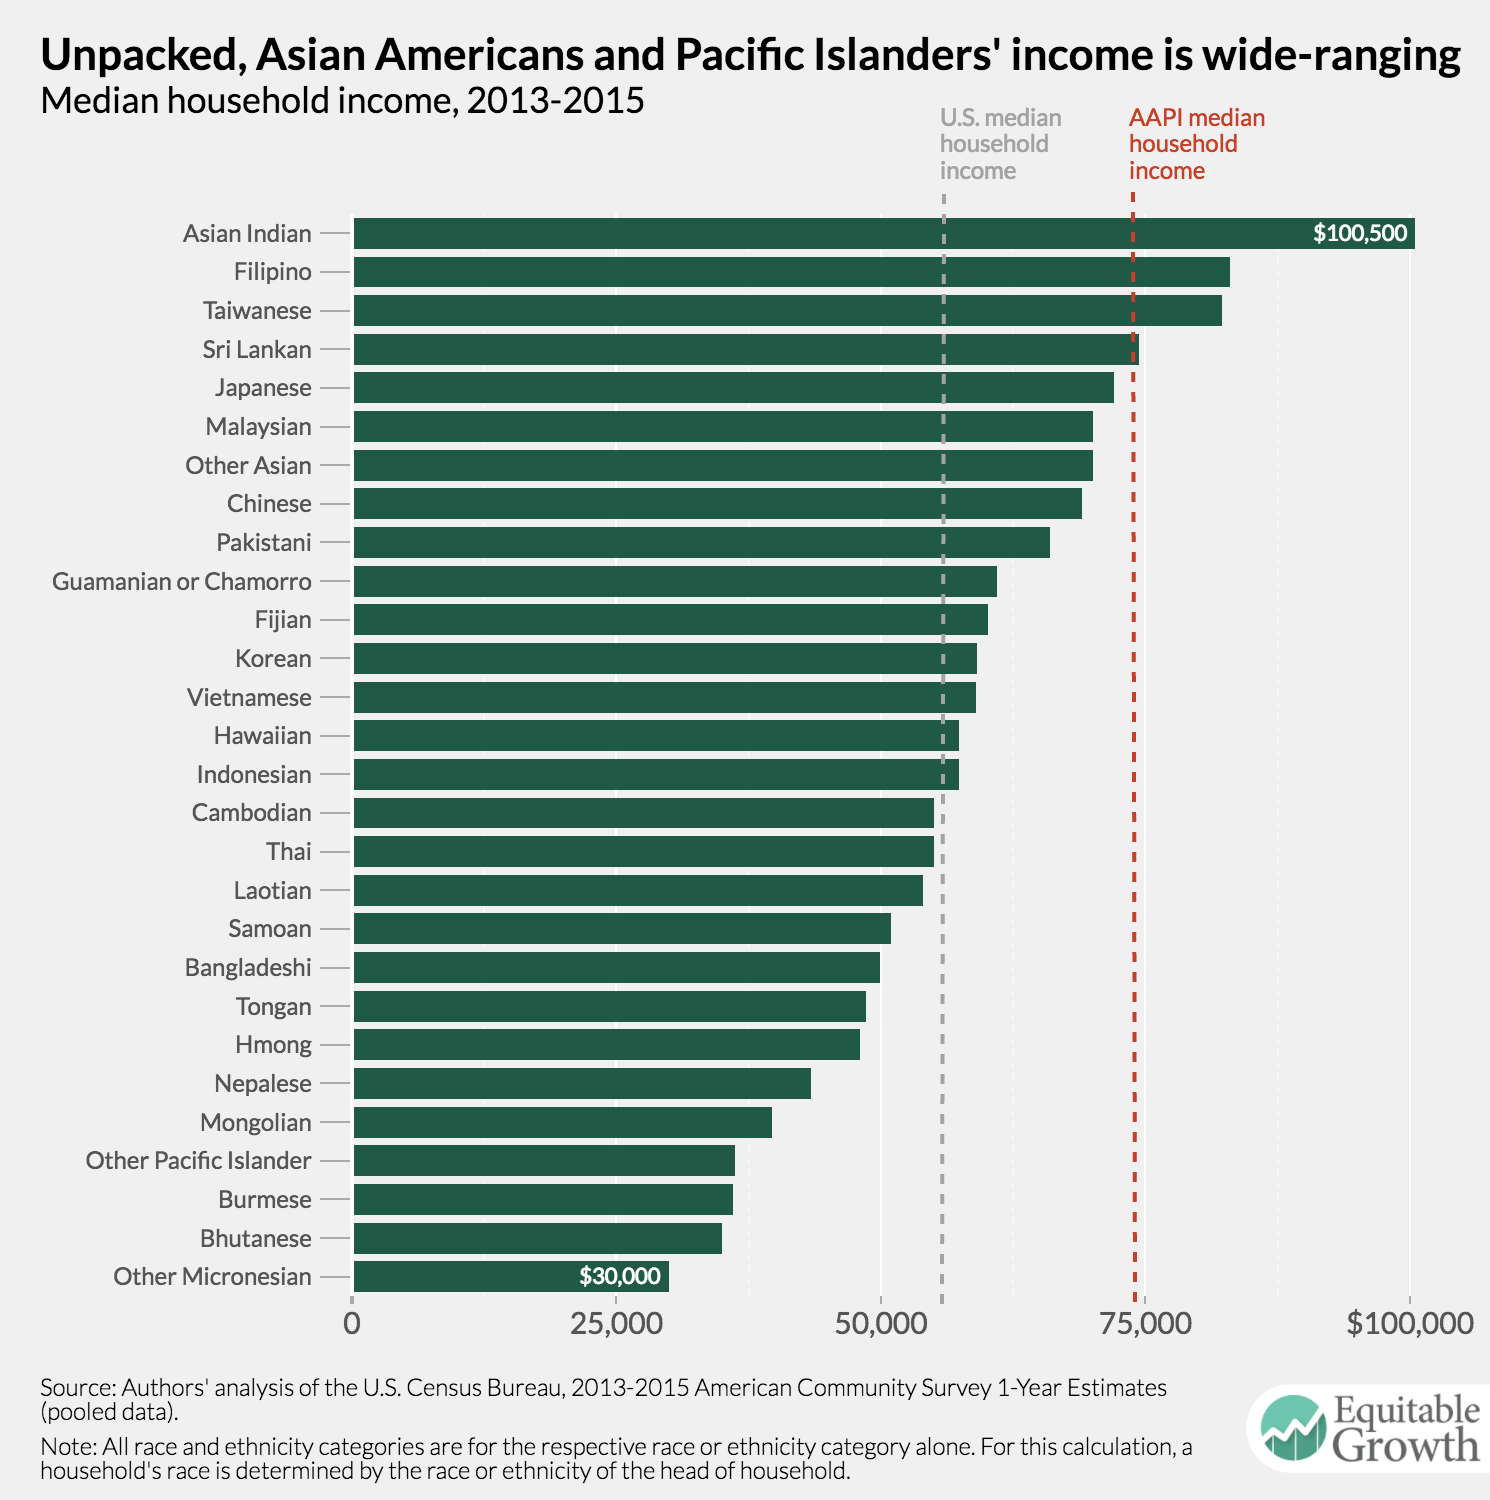
Data for different ethnic groups within this broad category, however, show that income differences are as big as they are between Asian Americans and Pacific Islanders and other broad racial and ethnic groups. In fact, the median household income for Asian Americans and Pacific Islanders spans a range of $70,000, with the typical Asian Indian household bringing in $100,500 at the top and the typical unspecified Micronesian household earning $30,000. A little under half of the detailed Asian Americans and Pacific Islander groups have a smaller median household income than the U.S. median, and only four groups (Sri Lankans, Taiwanese, Filipinos, and Asian Indians) have a median income above that of all Asian Americans and Pacific Islanders.
The sizable variance in income across different households within the broader community of Asian Americans and Pacific Islanders makes it challenging to discern any meaningful patterns in the data, but it is important to note that a majority of the East Asian and South Asian ethnic groups in the United States have relatively high median household incomes. Among those with the lowest median household incomes are groups with large refugee populations that have been recently resettled in the United States.
3.
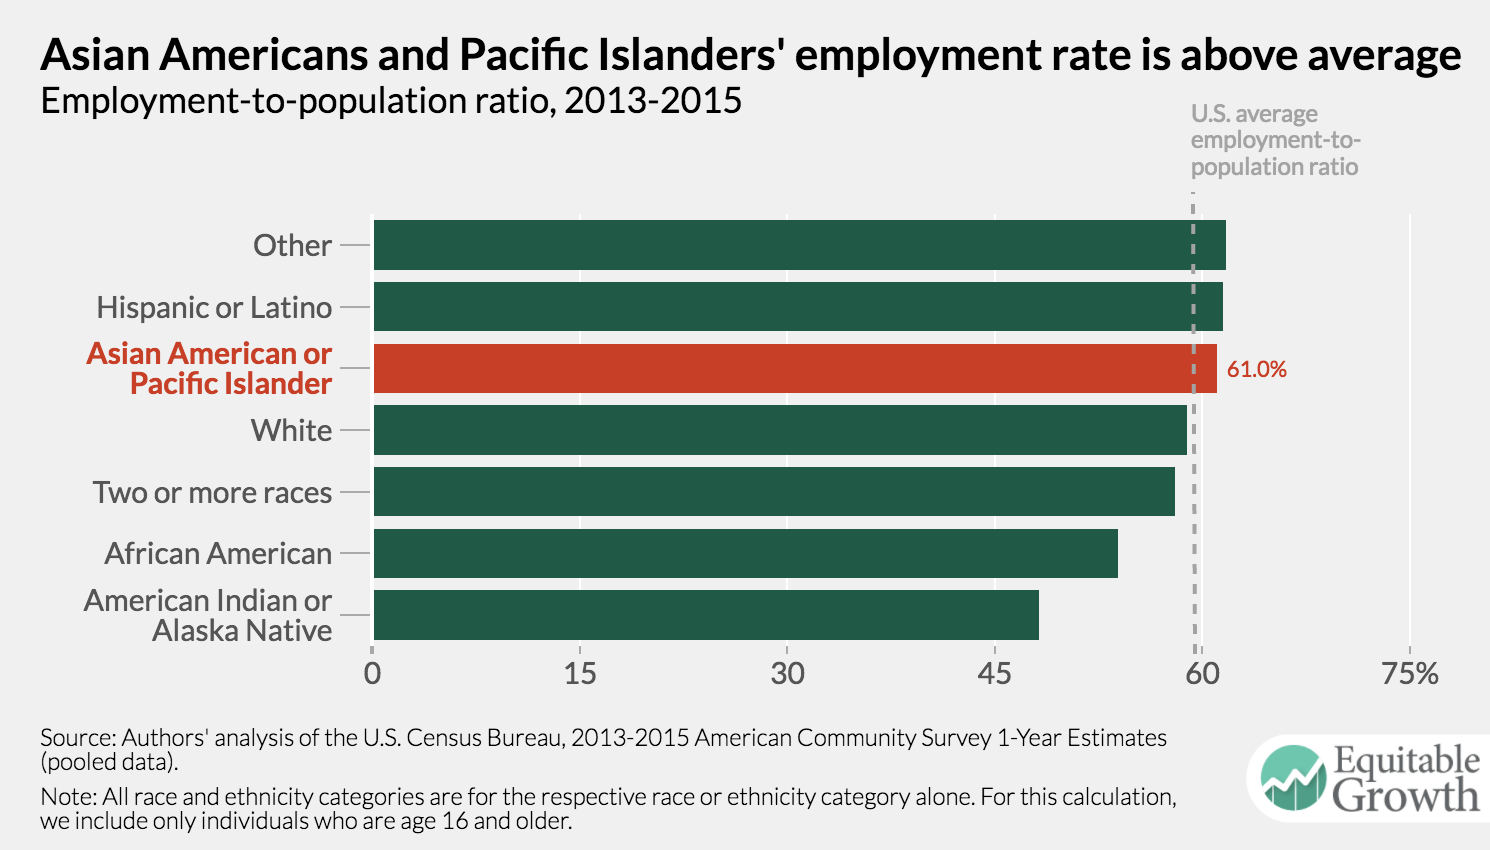
Employment rates for Asian Americans and Pacific Islanders range from 51.2 percent to 67.5 percent
Another way to measure socioeconomic wellbeing is whether a person has a job. In the United States, on average, about 59.0 percent of the population age 16 and above is employed. For Asian Americans and Pacific Islanders, the employment-to-population ratio is slightly better, averaging to 61.0 percent between 2013 and 2015.
While the “other” race category (comprised of a variety of respondents to this survey who choose the “other” category for an equally varied array of reasons) and Latinos have the highest employment rates—61.7 and 61.5 percent, respectively—Asian Americans and Pacific Islanders still have a higher employment-to-population ratio than whites (58.9 percent), multiracial people (58.0 percent), African Americans (53.9 percent), and American Indians and Alaska Natives (48.1 percent).
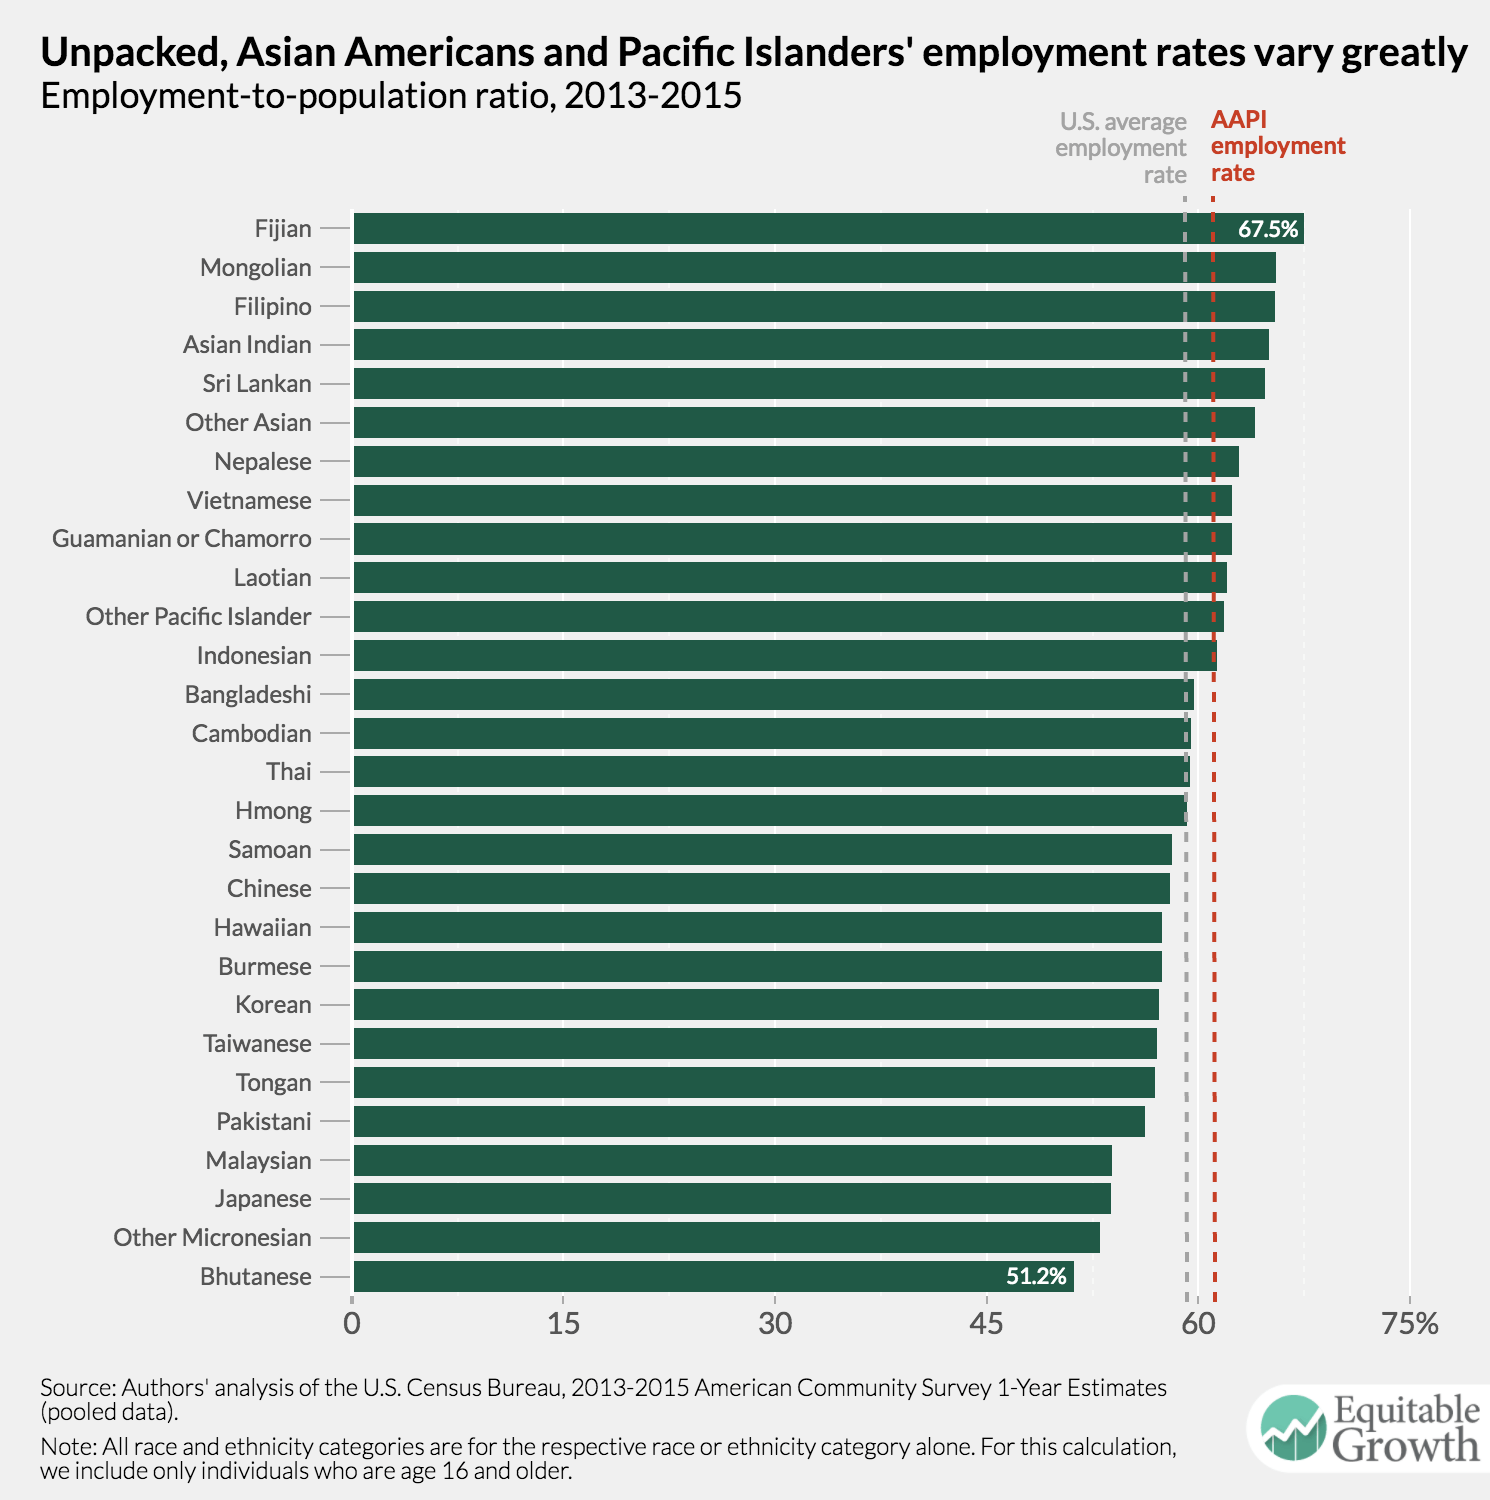
Yet a more detailed look at the employment rate of Asian Americans and Pacific Islanders demonstrates that the employment-to-population ratio greatly varies within this broader community. Fijians (67.5 percent), Mongolians (65.5), Filipinos (65.4), Asian Indians (65.0), and Sri Lankans (64.7) have the largest employment rates. Pakistanis (56.2), Malaysians (53.9), Japanese (53.8), unspecified Micronesians (53.0), and Bhutanese (51.2) have the lowest employment rates.
It is difficult to pinpoint what mechanisms drive these differences in employment-to-population ratios among these Asian American and Pacific Islander communities. Some factors that may influence the variation include high rates of linguistic isolation among certain sub-groups, differences in immigration history, the average age of immigration, and gender norms. Yet with about half of all Asian American and Pacific Islander groups registering an employment-to-population ratio below the national average suggests that the aggregated data makes invisible the socioeconomic realities of many these families.
4.
Aggregated Asian American and Pacific Islander provides a skewed story about educational attainment
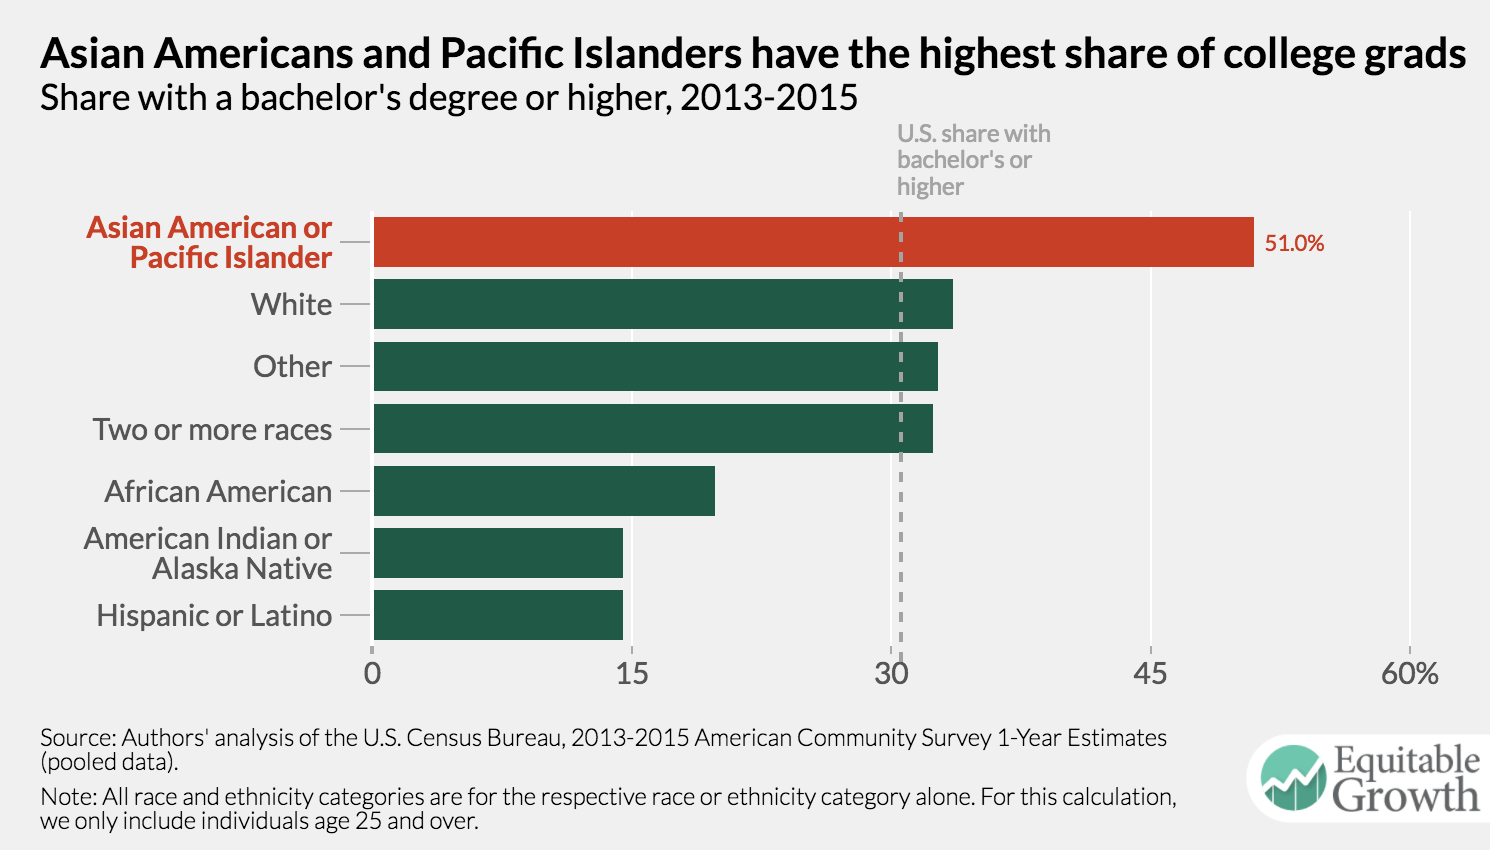
Varying levels of educational attainment can in part explain varied household incomes and employment rates among Asian Americans and Pacific Islanders. Nationally, about 30.6 percent of the U.S. population has a bachelor’s degree or more. In contrast, 51.0 percent of Asian Americans and Pacific Islanders hold a bachelor’s degree or higher.
On the whole, Asian Americans and Pacific Islanders have outstanding educational attainment, surpassing every other racial or ethnic group by wide margins. On average, they have 3.5 times the educational attainment of Latinos and American Indians and Alaska Natives, 2.5 times the educational attainment of African Americans, and about 1.5 times the educational attainment of whites. But this high level of educational attainment is attributed to only a select group of Asian Americans and Pacific Islanders. A detailed look at educational attainment by race and ethnicity subcategories shows that rates of college completion range over 69.4 percentage points within the broader Asian American and Pacific Islander group.
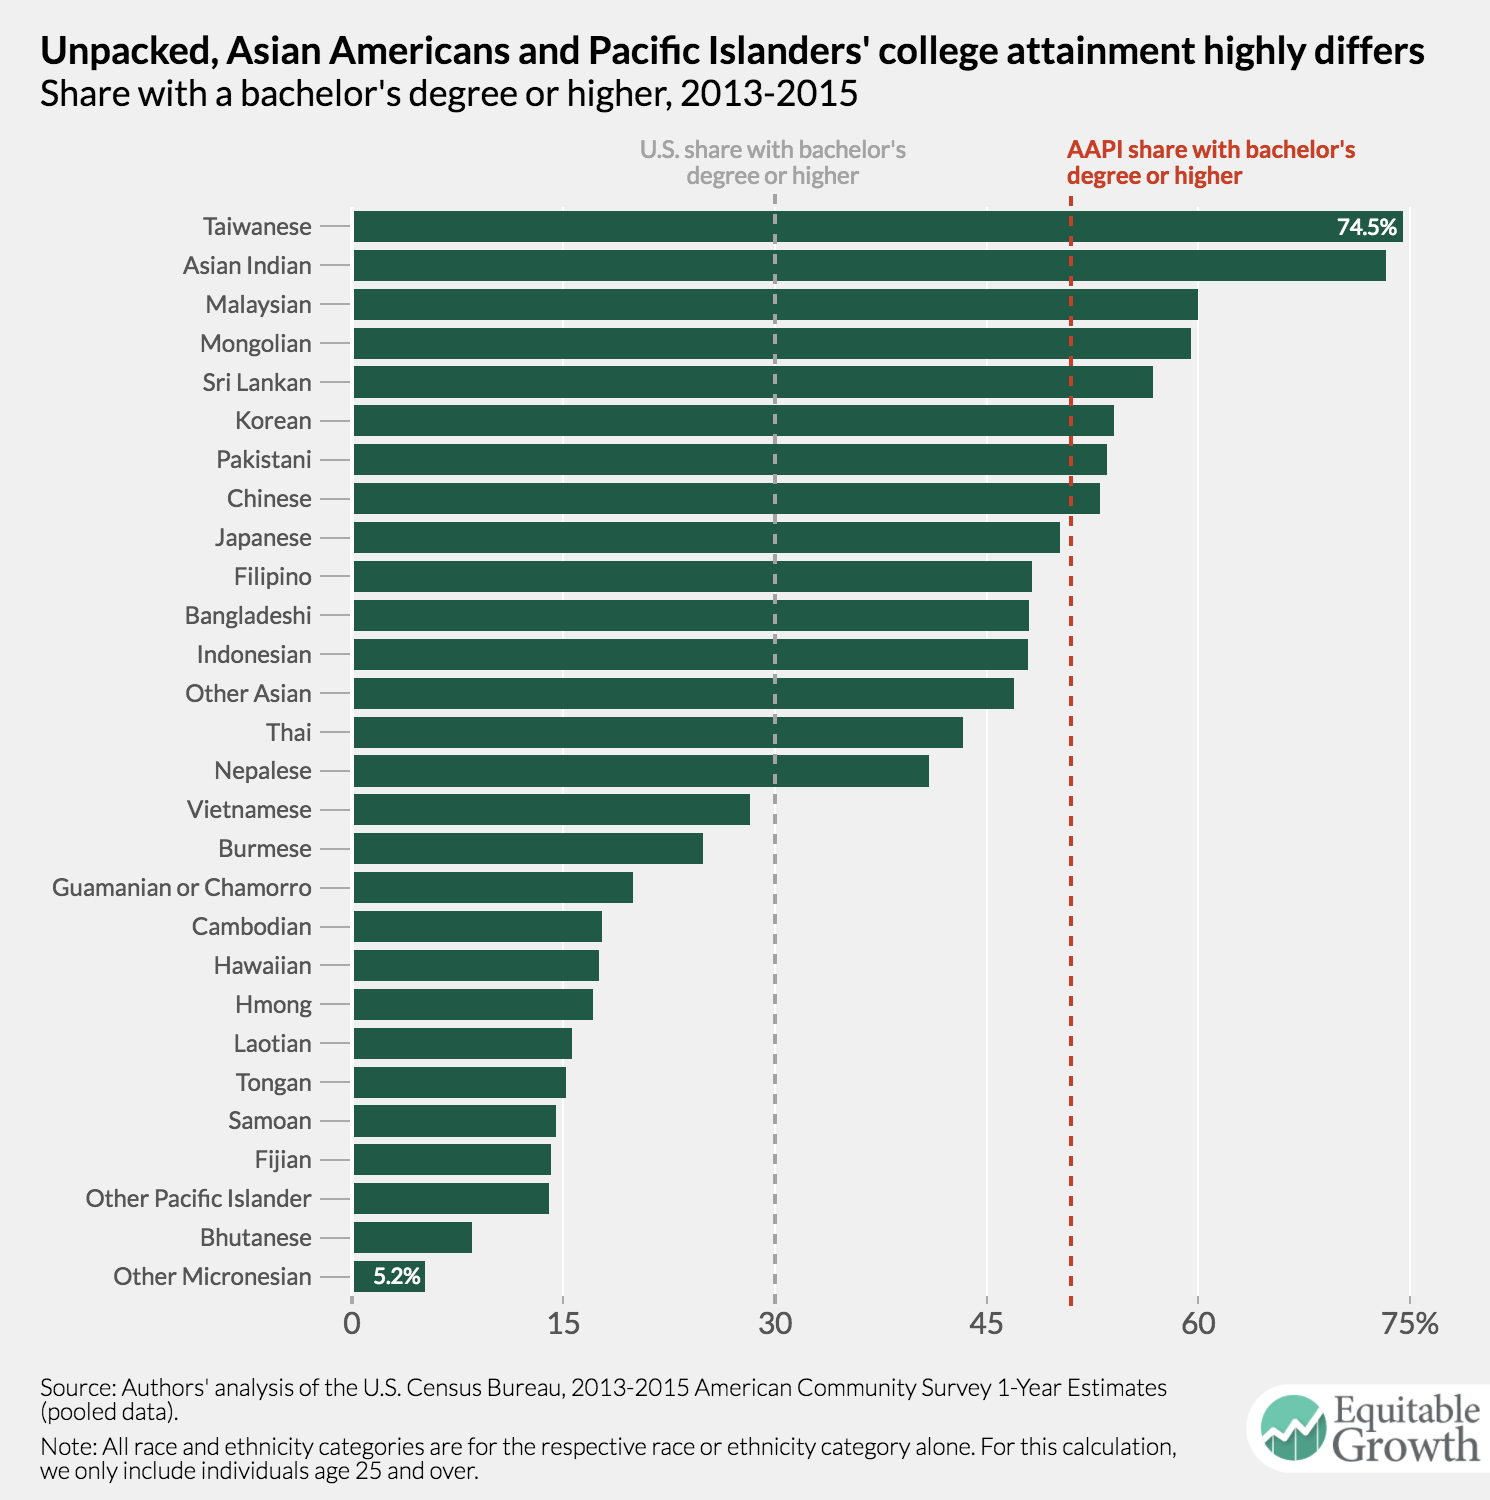
Taiwanese have the greatest share of people with a bachelor’s degree or more (74.5 percent). Asian Indians are a close second, with 73.3 percent of the 25 and over population holding a bachelor’s degree or more. Aside from these two groups, Americans of Malaysian, Mongolian, Sri Lankan, Korean, Pakistani, and Chinese descent all have higher college completion rates than the average among Asian Americans and Pacific Islanders.
At the same time, about 13 of these U.S. ethnic and racial sub-groups have lower educational attainment rates than the U.S. average. Unspecified Micronesians have the lowest share of people with a college degree or greater (5.2 percent). This population, along with Bhutanese, other Pacific Islanders, and Fijians, has lower educational attainment levels than Latinos, who, among the major race and ethnic groups, have on average the lowest share of people with a college degree or more. Vietnamese, Burmese, Guamanians (also known as Chamorros), Cambodians, Hawaiians, Hmong, Laotians, Tongans, and Samoans are also on the lower-end of college educational attainment.
The patterns in disaggregated educational attainment among Asian Americans and Pacific Islanders display a clearer story than those found in household income and the employment rate. Generally, immigrants who come to the United States for employment—such as East and South Asians—have better educational attainment outcomes than their counterparts from Southeast Asia. And Pacific Islanders have levels of education much more comparable to African Americans, American Indians and Alaska Natives, and Latinos. Aggregated educational attainment data significantly distorts this picture.
Data disaggregation matters for Asian Americans and Pacific Islanders
Household income, employment rates, and educational attainment make up only a small part of broader socioeconomic state of Asian Americans and Pacific Islanders, yet these three measures help identify an important theme: Regardless of what socioeconomic variables we dissect, across the board, Asian Americans and Pacific Islanders from different groups have notably different experiences. Research increasingly shows that this theme is evident across other dimensions, too, such as social, physical, and mental health as well as civic participation.
In order to further this research, however, disaggregated categories need to be made available in U.S. administrative data. In fact, a proposed revision of the Standards for Maintaining, Collecting, and Presenting Federal Data on Race and Ethnicity by the federal Office of Management and Budget could certainly improve the quality and granularity of all data collected on Asian Americans and Pacific Islanders. Although there are valid concerns about what a disaggregation revision means for privacy in data and sample sizes for analysis, refined ethnicity categories can ensure that the data don’t obscure what they are meant to enlighten. It may even be possible to address some of these concerns about disaggregation by using national origin regions for Asian Americans and Pacific Islanders if more detailed categories compromise the data’s integrity. It’s valuable to note, though, that data collected at highly disaggregated levels can always, if necessary, be aggregated after refined collection to protect privacy.
Ultimately, having disaggregated data about Asian Americans and Pacific Islanders is the most effective way to form evidence-based policy around the distinct needs of these diverse communities and identify unique barriers to access of services and resources at the local, state, and federal level. Using disaggregated data can also help policymakers develop substantial quantitative stories about the challenges these communities face as they continue to become a larger part of the broad U.S. social fabric. More detailed data that highlights this diversity can better guide the creation of inclusive and equitable policies for all Americans.
American Community Survey data used in this post is from IPUMS-USA, University of Minnesota, www.ipums.org.
Should-Read: I would note that Simon Wren-Lewis endorses 95% of what Ann Pettifor says–as long as the target is not “mainstream macroeconomics” but rather what Simon calls “media macro”…
Simon Wren-Lewis: Ann Pettifor on Mainstream Economics: “Unfortunately her piece is spoilt by a final section that is a tirade against mainstream economists which goes way over the top…
…Let me just go through the factual errors.
Economists dictated the terms for austerity that has so harmed the British economy and society over the past ten years.
The only support she gives for this statement is the 20 economists who signed a letter to the Times on 14th February 2010. She neglects to mention that 58 equally notable economists signed a response in the Financial Times on 18th February arguing the 20 were wrong. Austerity has always been a minority view among academic economists, a minority that has got smaller over time.
Of course those that signed the first letter, and in particular Ken Rogoff, turned out to be a more prominent voice in the subsequent debate, but that is because he supported what policymakers were doing. He was mostly useful rather than influential.
As the policies have failed, the vast majority of economists have refused to concede wrongdoing, nor have societies been offered alternatives.
In the case of the 20 economists who signed that letter, nearly half did revise their views just two years later. More importantly, for the last few years pretty well every macroeconomist of note, including Ken Rogoff, has advocated a substantial increase in public investment. So this sentence, in so far as it relates to austerity, is almost as wrong as it could be
[On Brexit] All the heavyweights of the economics profession… were wheeled out to warn the British people of economic facts known, and understood apparently, only to ‘experts’… But the ‘experts’ and the economic stories they tell have been well and truly walloped by the result of this referendum. And rightly so, because while there is truth in the story that international and in particular European cooperation and coordination are vital to economic activity and stability, there is no sound basis to the widely espoused economic ‘religion’ that markets—in money, trade, and labour—must be unfettered, detached from democratic regulatory oversight, and must be left to ‘govern’ whole countries, regions, and continents.
Where did these heavyweights talk about “economic facts known, and understood apparently, only to experts”? When they were given the chance, they explained the common sense idea that trade would suffer if we left the EU because it is easier to trade with your neighbours, and the easy to understand empirical findings that more trade increases productivity and therefore economic growth. There is no religion involved at all, but rather statistical evidence. If you are looking for religion, you need to focus on the handful of economists supporting Brexit, who really did believe that it could usher in a neoliberal nirvana….
When Ann talks about the failings of economists related to the financial crisis she has a point, but it is one that she grossly exaggerates. Economists hardly “led the way to the re-regulation and ‘liberalization’ of the finance sector over the past 40 years”. The way was led by the financial sector itself. If more economists had backed up rather than dismissed Rajan’s warnings in 2005, I doubt if anything would have changed…. I think the same point applies to globalisation. Most economists have certainly encouraged the idea that globalisation would increase overall prosperity, and they have been proved right….
There is a regrettable (but understandable) tendency by heterodox economists on the left to try and pretend that economics and neoliberalism are somehow inextricably entwined. The reality is that neoliberal advocates do use some economic ideas as justification, but they ignore others which go in the opposite direction. As I often point out, many more academic economists spend their time analysing market imperfections than trying to show markets always work on their own. They get Nobel prizes for this work. I find attempts to suggest that economics somehow helped create austerity particularly annoying, as I (and many others) have spent many blog posts showing that economic theory and evidence demonstrates that austerity was a huge mistake.