The Federal Reserve’s new Distributional Financial Accounts provide telling data on growing U.S. wealth and income inequality

Wealth disparities between the rich and the poor in the United States have broadened over the past 30 years, according to a new dataset released earlier this month by researchers at the Federal Reserve Board. Their Distributional Financial Accounts is the new dataset that provides quarterly estimates of wealth distribution in the country from 1989 to 2019. 1 The new dataset was created by integrating the Federal Reserve Board’s Financial Accounts with the Survey of Consumer Finances. Together, they contain reliable measures of the distribution of household-sector assets and liabilities from 1989, which gives policymakers and economists alike new insight into how the distribution of wealth has changed since the 1990s.
The new Federal Reserve Board dataset confirms that wealth concentration has been growing, consistent with other data series such as the World Inequality Database assembled by academics worldwide. Indeed, the Fed’s new Distributional Financial Accounts open up new opportunities to study close to real-time changes in the U.S. wealth distribution. It provides the necessary data to study fluctuations in the wealth distribution over short time periods, while accounting for changes that occur between times of survey measurement for less frequently collected datasets.
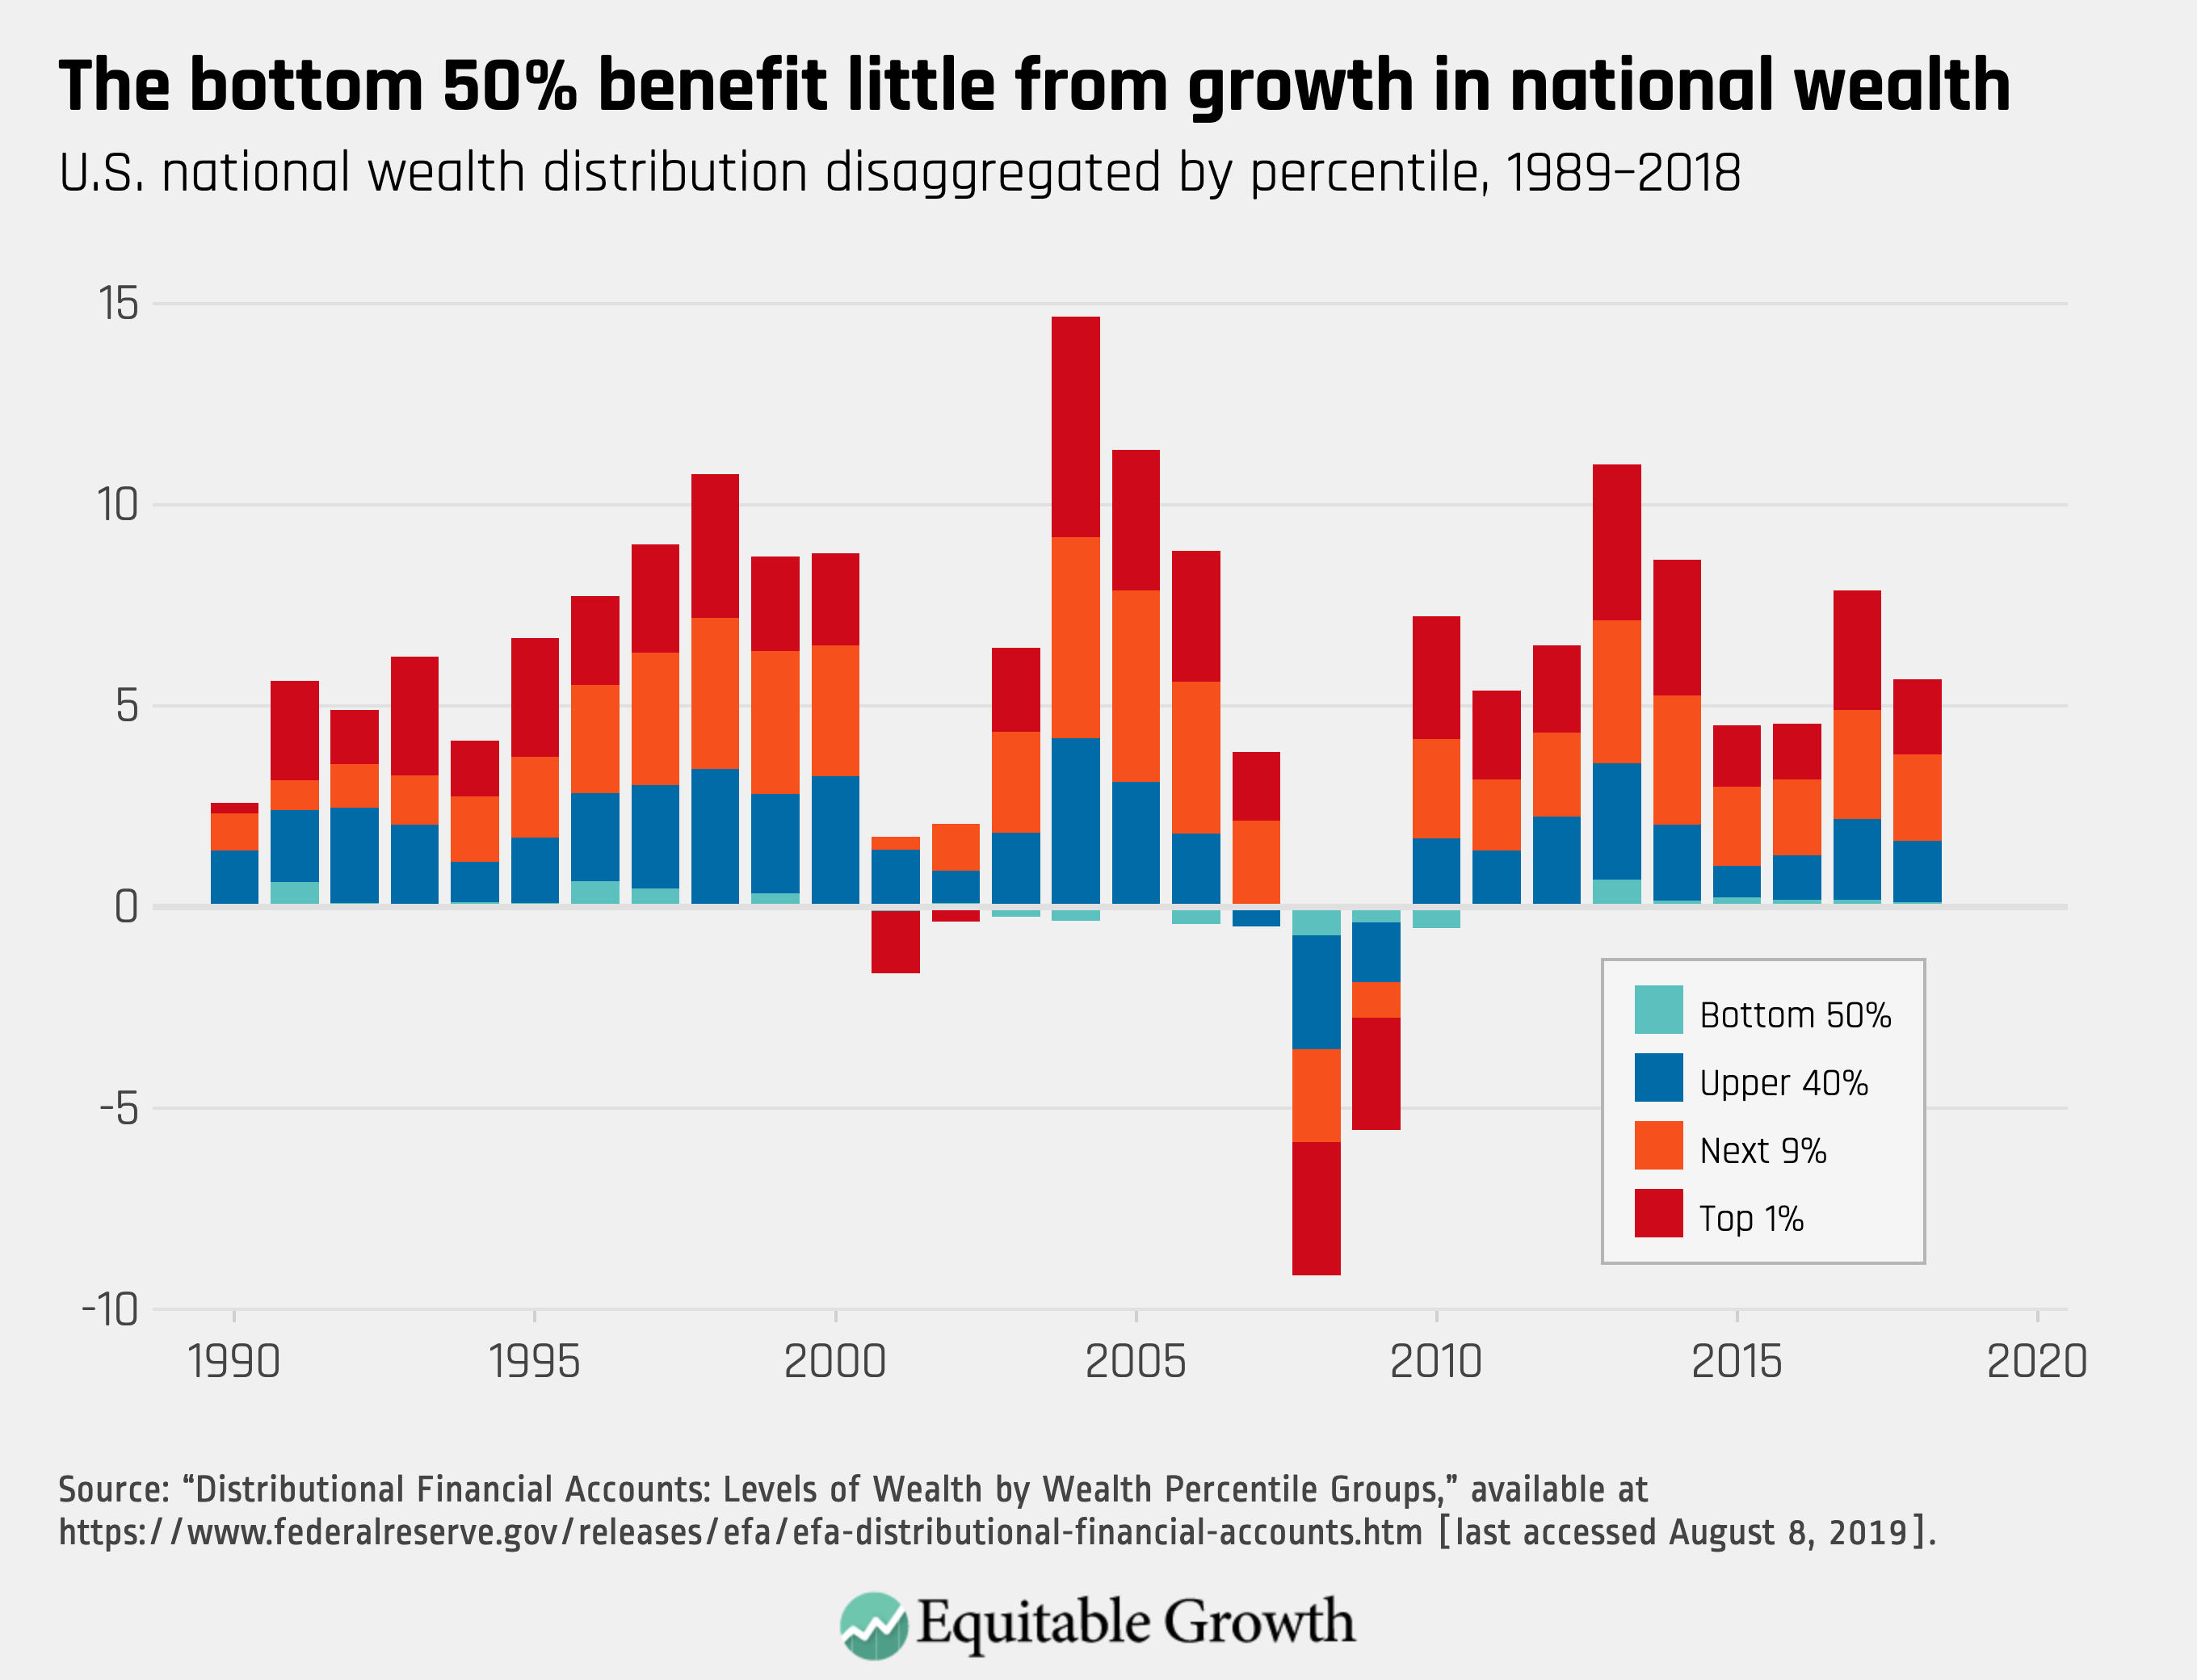
The Distributional Financial Accounts show that the share of wealth among the top 1 percent of wealth owners in the United States was strongly pro-cyclical before, during, and after the dot-com era in the late-20th century and the Great Recession of 2007—2009. The new dataset shows that shares of wealth across the wealth distribution grew and fell in tandem with fluctuations in overall economic growth. The authors credit this rise in wealth concentration to an increased concentration of assets held, rather than decreased concentration in liabilities. (See Figure 1.)
Figure 1
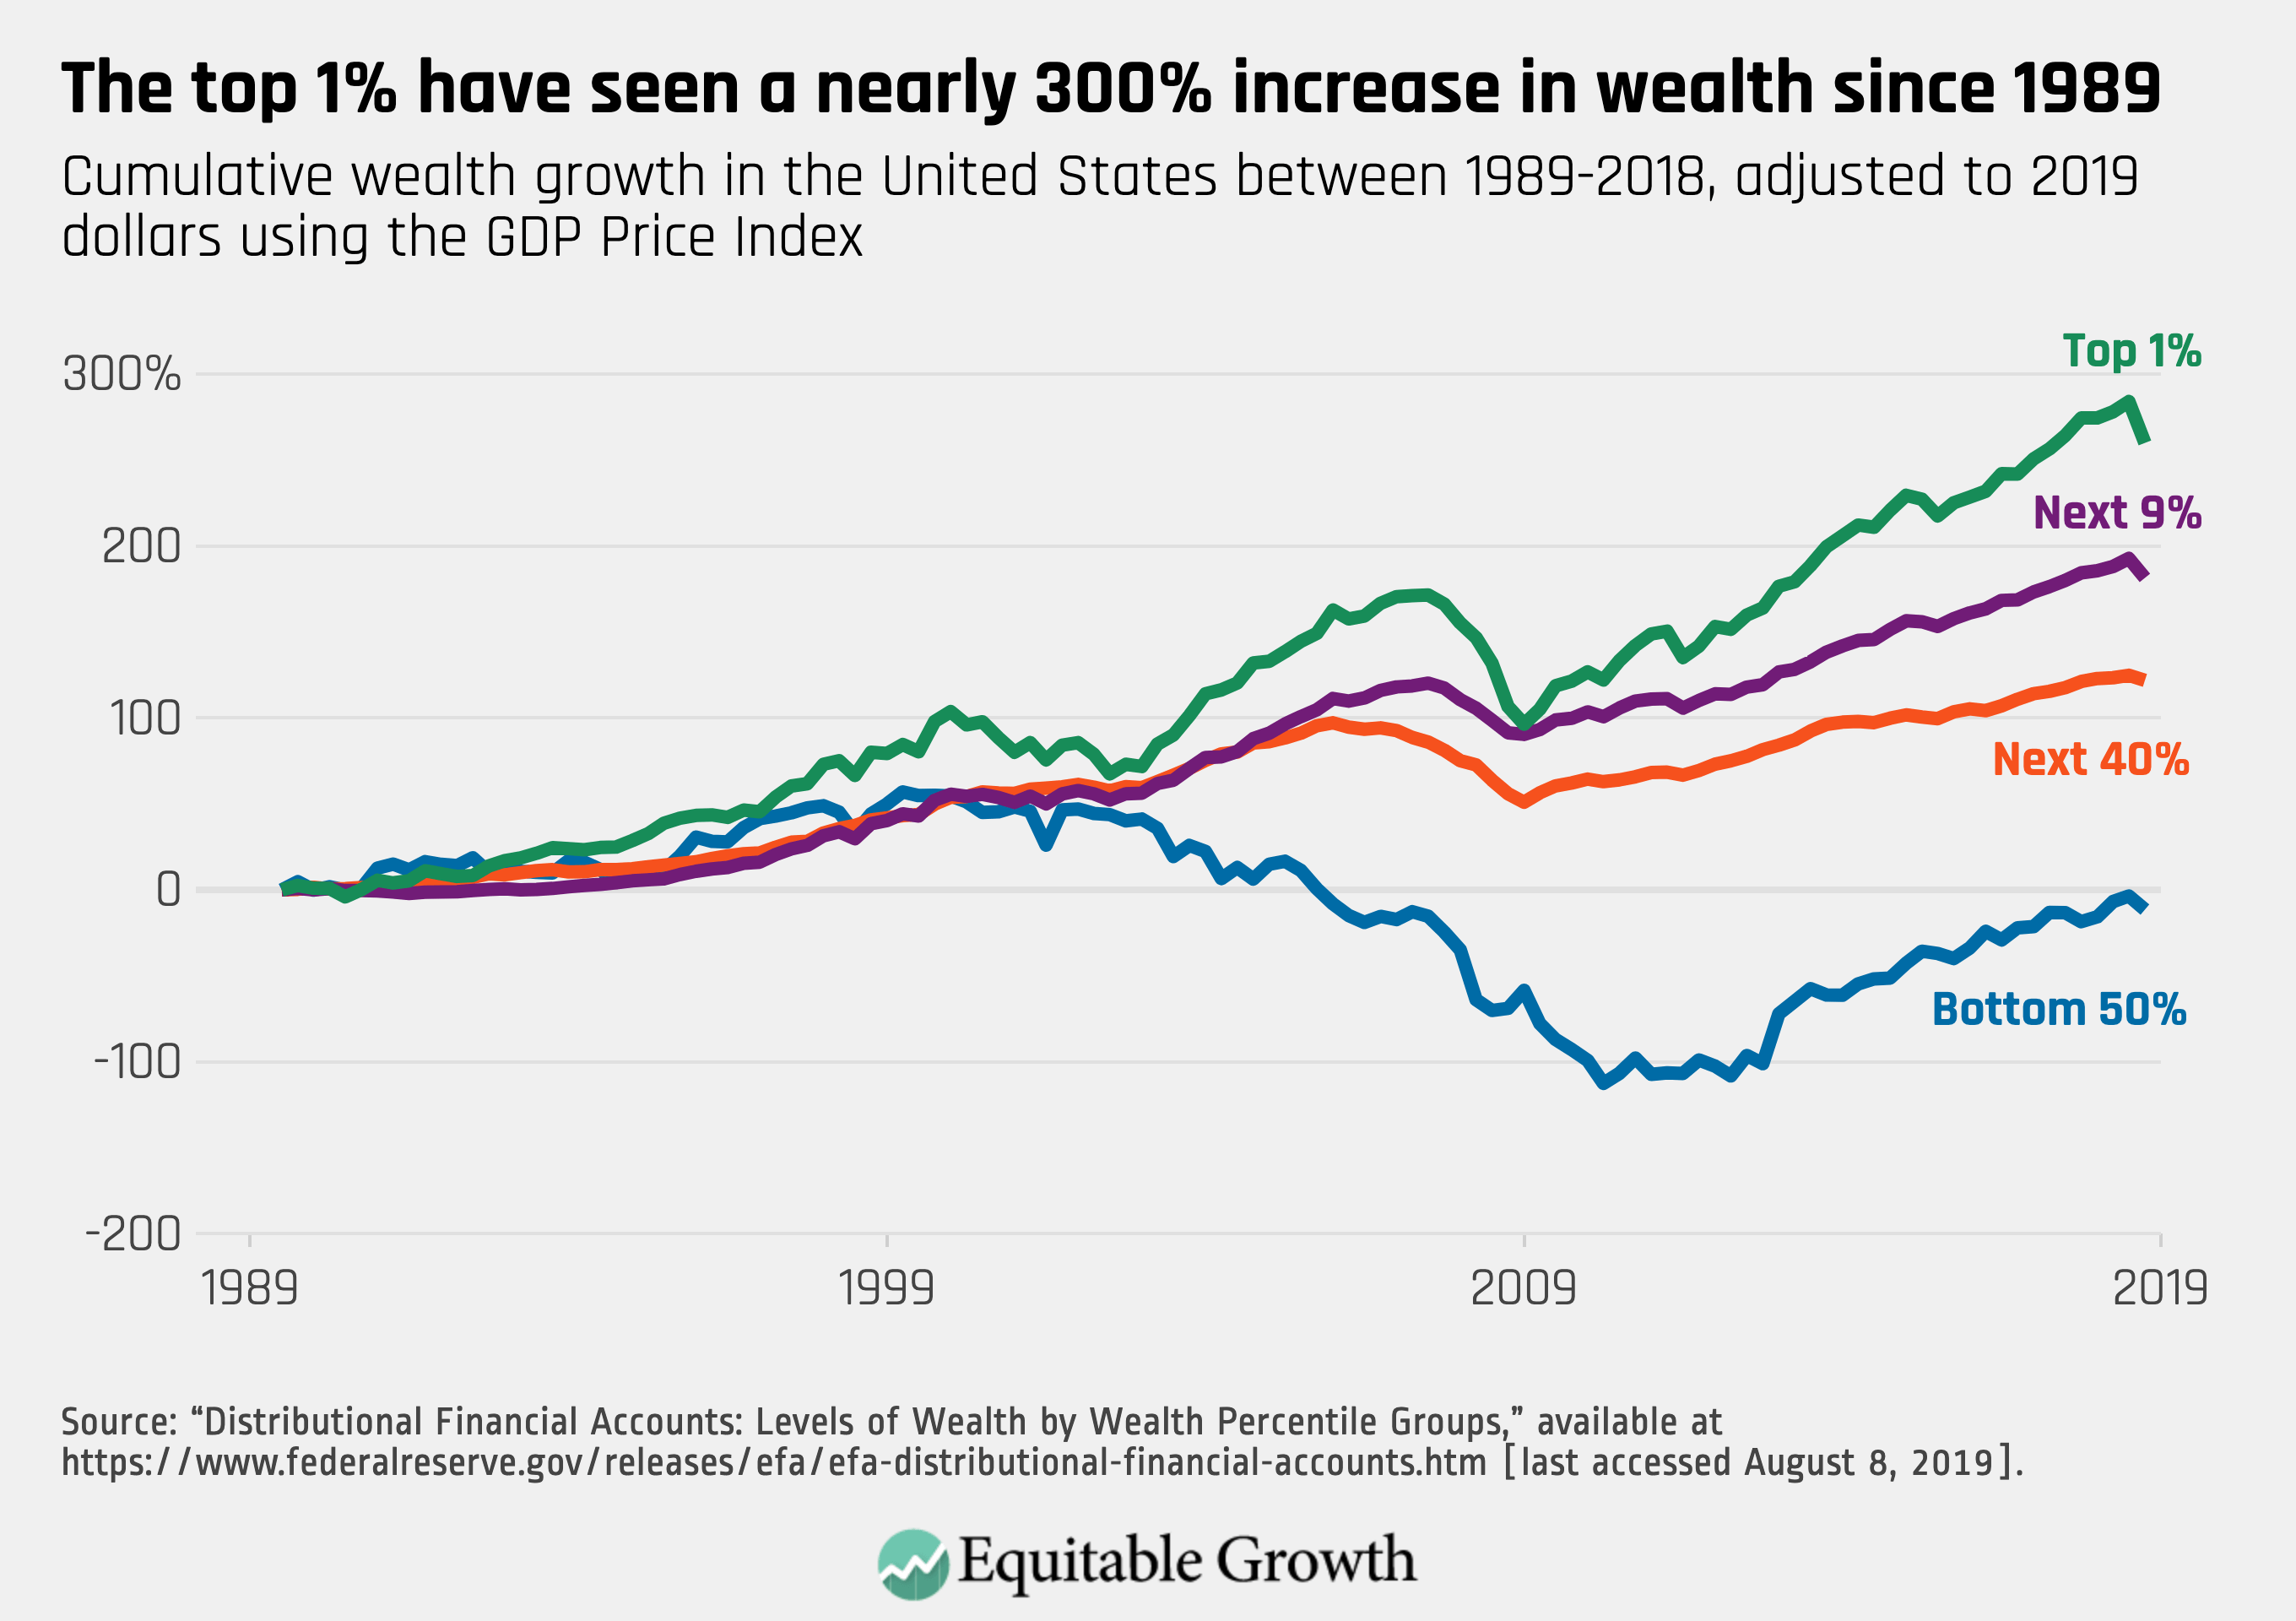
Looking at the cumulative growth of wealth disaggregated by group, we see that the bottom 50 percent of wealth owners experienced no net wealth growth since 1989. At the other end of the spectrum, the top 1 percent have seen their wealth grow by almost 300 percent since 1989. 2 Although cumulative wealth growth was relatively similar among all wealth groups through the 1990s, the top 1 percent and bottom 50 percent diverged around 2000. (See Figure 2).
Figure 2
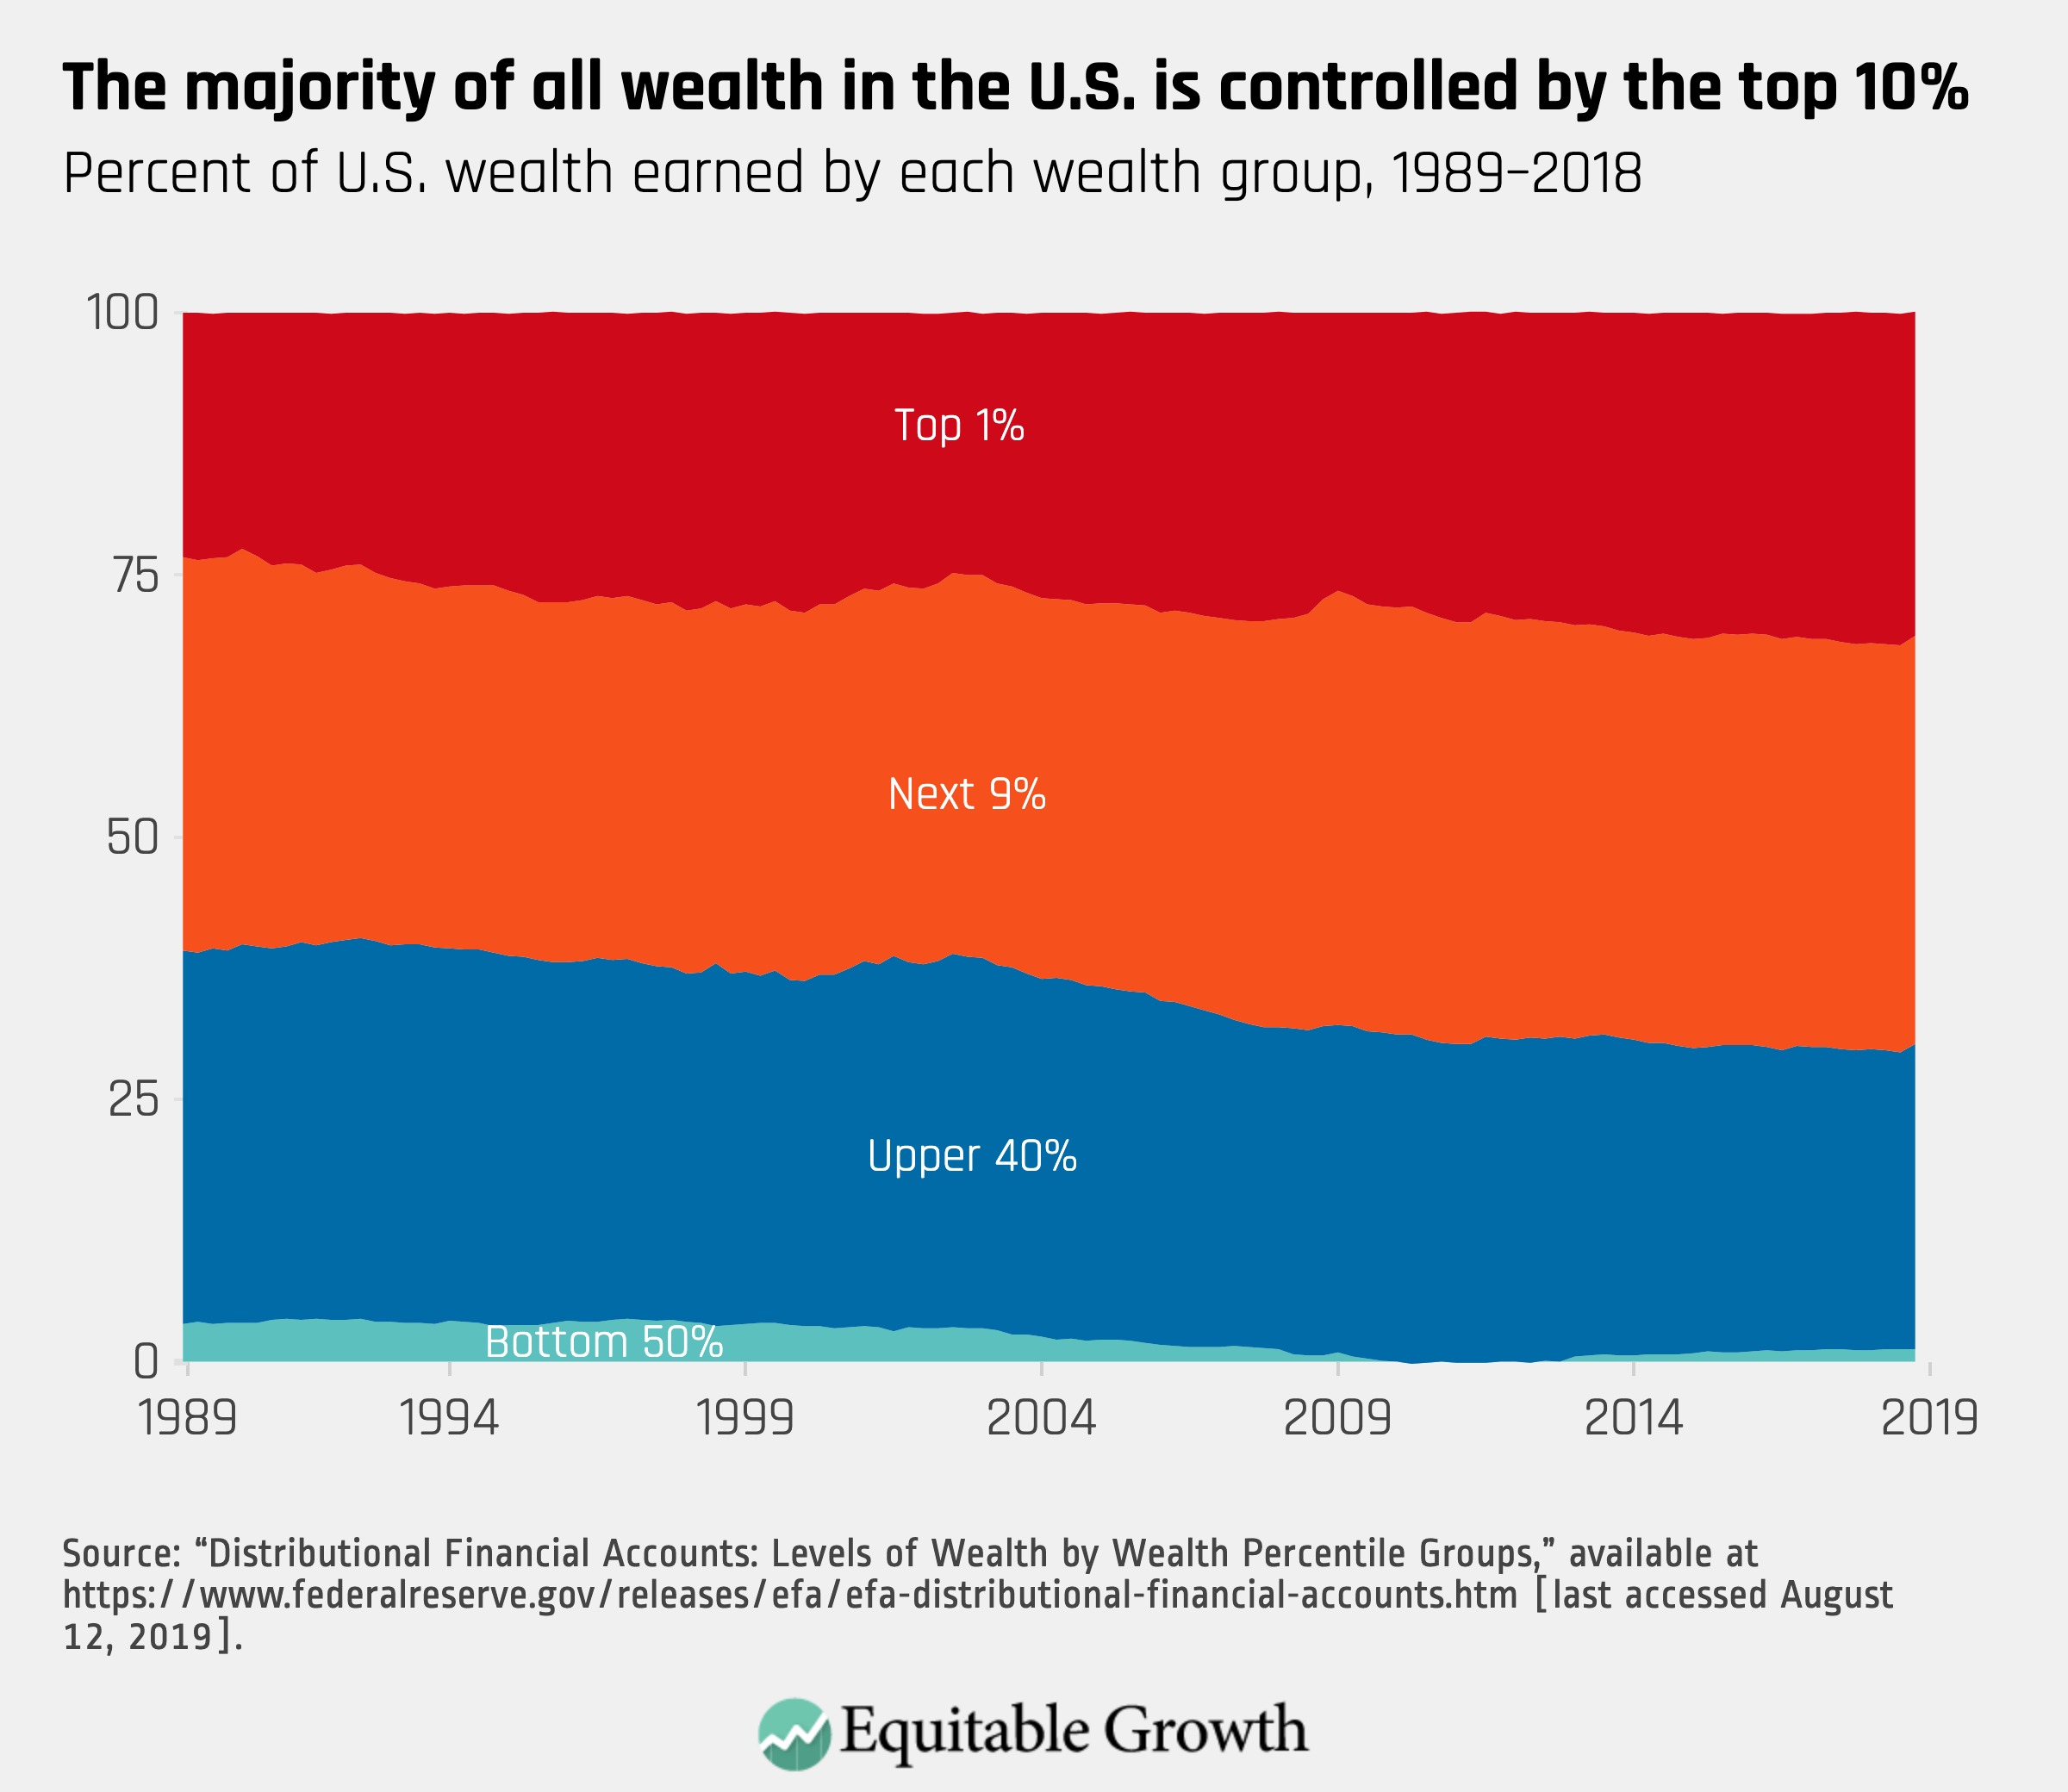
The Fed’s new Distributional Financial Accounts of U.S. wealth is highly informative when matched with the Distributional National Accounts dataset produced by Gabriel Zucman and Emmanuel Saez at the University of California, Berkeley. Both datasets distribute an aggregate metric from the Fed’s National Income and Product accounts to see where economic growth is concentrated in wealth and in income, respectively. Saez and Zucman find that when they disaggregate National Income, the richest 10 percent of income earners held 23 percent of all income earned in 2016. The Distributional Financial Accounts show that wealth is even more strongly concentrated, with 10 percent of the population holding 70 percent of all wealth in the United States in 2018. (See Figure 3.)
Figure 3
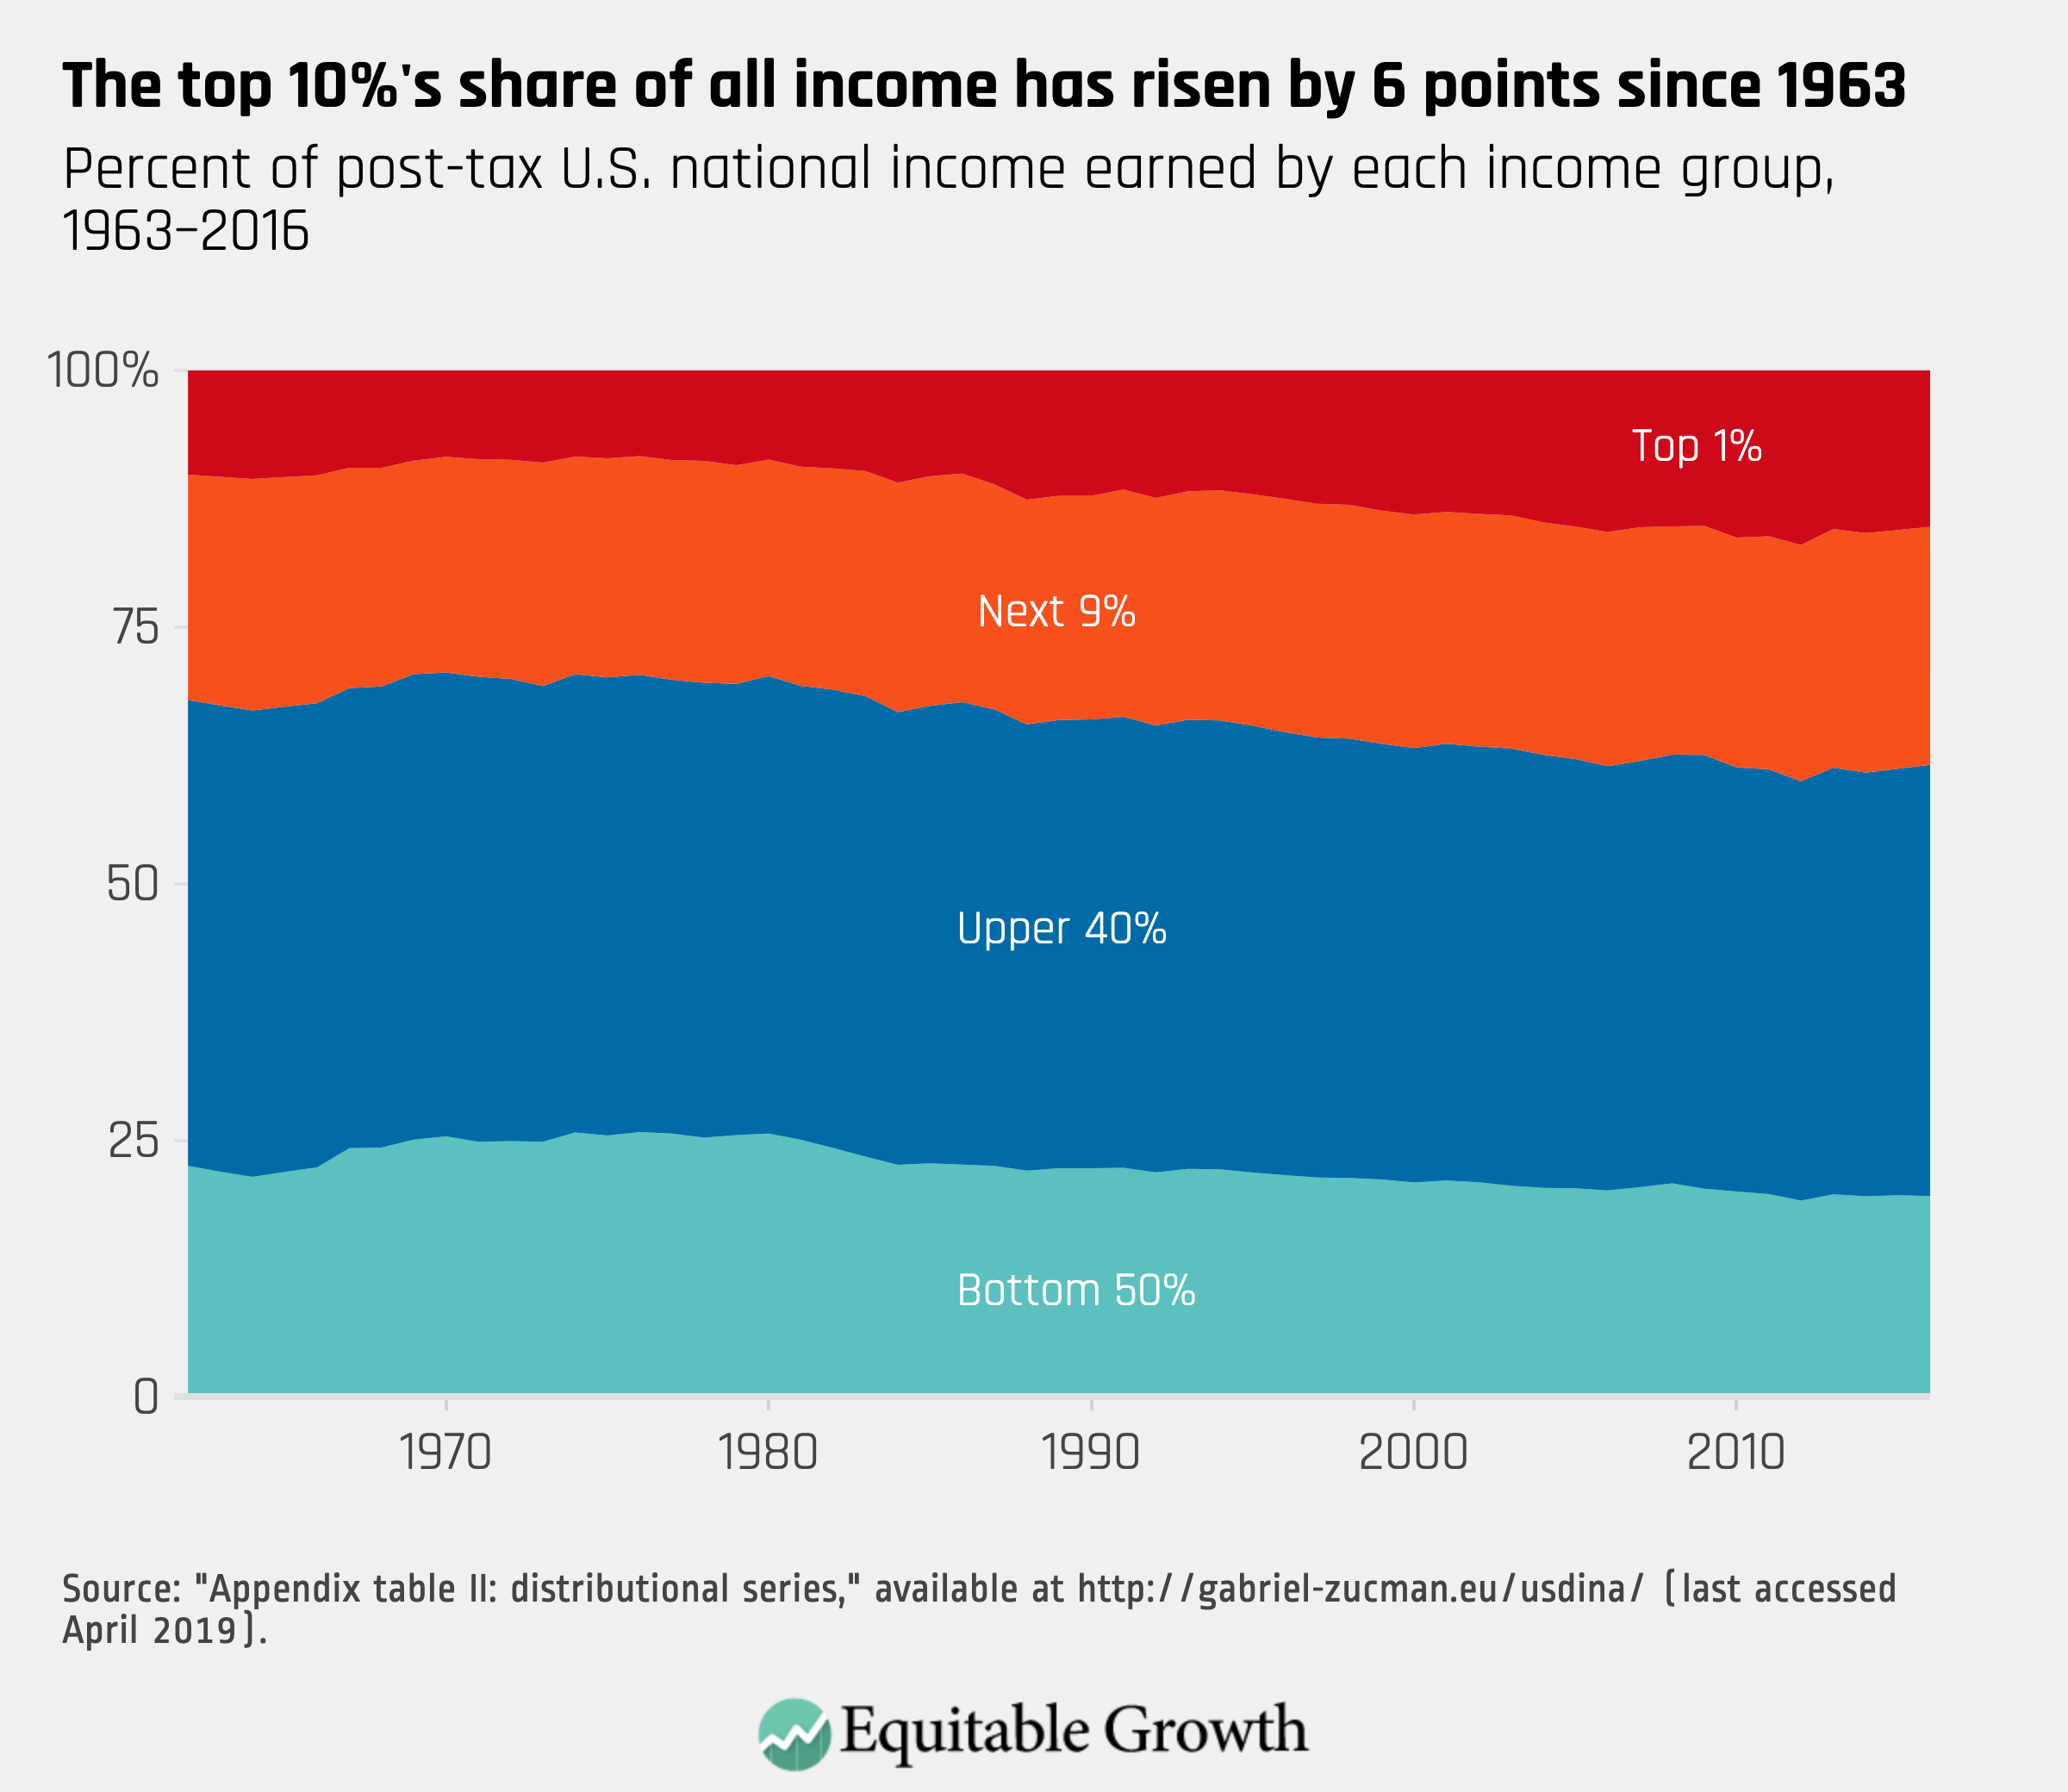
Comparing income inequality calculated by Zucman and Saez and wealth inequality according to the Fed’s new Distributional Financial Accounts indicates that wealth inequality is growing faster than income inequality in the United States: Income inequality is historically high, but wealth inequality is outpacing it. Alarmingly, the new Fed dataset also shows that a large portion of U.S. households have little to no wealth at all. One way this poses a threat is that at times of emergencies, households at the bottom are at risk of having no savings or disposable wealth to use. As wealth inequality grows, we see a heightened risk that more U.S. households could be left without emergency savings.
These new metrics help policymakers understand who benefits from U.S. economic growth. When most of U.S. Gross Domestic Product growth accrues overwhelming to wealthy income earners, as has been the case since the early 1980s, then low- and middle-income households suffer immensely in the event of a recession, as happened in 2008 amid the depths of the Great Recession. This kind of analysis can help policymakers figure out how to curb growing inequality by giving them accurate and timely information on the health of the U.S. economy up and down the income and wealth ladders. Understanding where wealth sits, who holds wealth, and how wealth relates to income helps economists and politicians see how the economy is functioning and provide meaningful policy solutions to growing inequality. (See Figure 4.)
Figure 4
