Americans informed about the distributional effects of Republicans’ tax and budget bill overwhelmingly oppose it

Overview
Republicans in the U.S. Senate recently passed a version of the One Big Beautiful Bill Act, championed by President Donald Trump. The House of Representatives passed an earlier version of this bill in May and are expected to vote on the Senate’s modified version over the next several days.
As we have argued in a companion report, this enormous bill would, if enacted, be the most regressive U.S. tax and budget law in at least the past four decades—and possibly ever.
The core of the Republican bill is more than $4 trillion in tax cuts that overwhelmingly benefit the affluent. These tax cuts are financed in part by draconian spending cuts focused on middle- and lower-income Americans, including several hundred billion dollars in cuts to the Supplemental Nutrition Assistance Program, or SNAP, income-driven repayment loans and Pell grants for lower-income college students, and approximately $1 trillion in cuts to publicly funded health insurance—Medicaid, affordable coverage in the Affordable Care Act marketplaces, and Medicare for dually eligible beneficiaries who receive assistance through Medicaid.
Polls indicate that the One Big Beautiful Bill Act is highly unpopular. Indeed, the only law passed since 1990 that was as unpopular as the current bill before it passed is the 2017 tax cuts that Republicans are now seeking to extend and expand. At the same time, most Americans admit they know relatively little about the bill, with two-thirds responding to a Washington Post poll on June 9 that they had heard “a little” (40 percent) or “nothing at all” (26 percent) about it.
How are Americans’ views of the bill affected by information about its regressive effects? Current polling cannot reliably tell us for two reasons. First, no poll has presented Americans with precise estimates of the bill’s distributional effects. Second, existing polls are not designed to assess the causal effect of information. To make causal claims about how the bill’s regressivity affects public support, respondents must be randomized into groups that receive varying amounts of information about the bill’s effects.
This is the approach we took as part of a larger survey experiment we conducted with 4,500 Americans, asking about their attitudes toward the One Big Beautiful Bill Act roughly 2 weeks after it passed the House. We asked our control group about the bill without any distributional details, whereas two treatment groups received specific estimates of the distributional effects of the House-passed version of the bill, based on microsimulation modeling by the Yale Budget Lab.1 Both treatment groups learned about the regressivity of the bill, but the first was shown the regressive effects of the tax cuts alone, while the second saw the more regressive effects of the bill’s combined tax and spending cuts.
In line with other recent surveys, we found that baseline opposition among those who were asked directly for their opinion of the bill was high, with a ratio of 2-to-1 opposing its passage. Opposition was much higher, however, in the first treatment group (which only heard about the regressive tax cuts) and higher still in the second (which heard about the combined tax and spending cuts). When shown the combined effects, the ratio of opposition-to-support increased to more than 7-to-1, with only 11 percent of respondents in this latter group supporting the bill. Among Republicans, the difference across groups was even larger: Support and opposition flipped between the control group and the second treatment group, from nearly 3-to-1 support to nearly 3-to-1 opposition.
Our results confirm that the One Big Beautiful Bill Act is broadly unpopular. They also show, however, that Americans have not yet learned about the bill’s regressive distributional effects—and those who are informed about these effects overwhelmingly oppose the bill.
The distributional effects of the One Big Beautiful Bill Act
What makes the current bill distinctive is that it would both cut taxes in ways that mostly benefit the affluent and impose large spending cuts that disproportionally hurt less affluent Americans. Because of these combined tax and spending cuts, the One Big Beautiful Bill Act dwarfs the overall regressivity of the 2017 Trump tax cuts and is more regressive than even the famously upwardly skewed Bush tax cuts of 2001, as we show in our report.
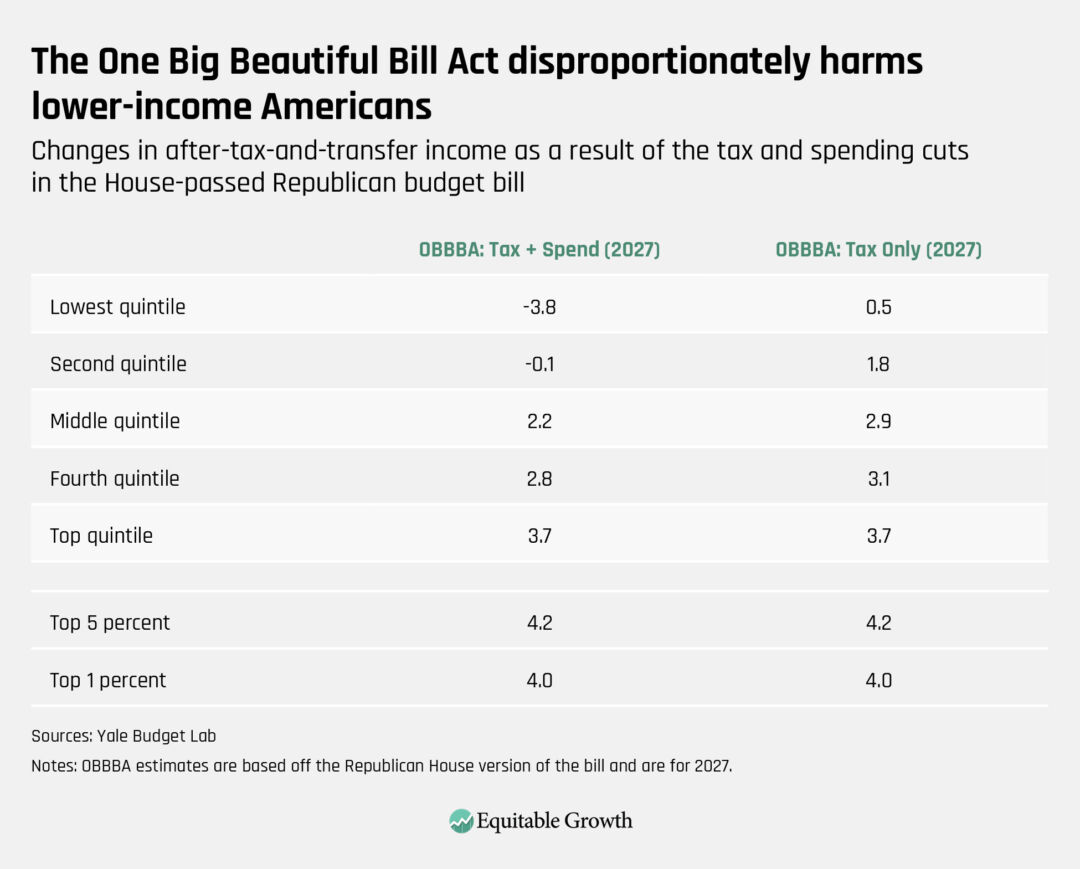
According to the Yale Budget Lab, the tax cuts in the House-passed Republican bill would increase disposable incomes among households in the top 1 percent of the income distribution by nearly 4 percent, on average. By contrast, the tax cuts would boost disposable incomes by just 0.5 percent, on average, among households in the lowest income quintile (hereafter the bottom 20 percent). When the spending cuts are factored in, however, the bottom 20 percent would experience an average income loss of nearly 4 percent, on average, while the top 1 percent would be unaffected. (See Table 1.)
Table 1
How we designed our experimental survey
Our survey was structured as follows. We started with a few questions regarding respondent demographics, including education, political affiliation, and household income. Then, we noted that the House had recently passed a budget bill that would make changes to taxes and government spending over the course of the upcoming decade. Given all the recent developments regarding tariffs and trade deals, we clarified that in the questions that followed, we were not referring to those types of policies.
Before we asked respondents about their opinions of the bill, we randomly assigned a subset of our respondents to one of three groups, which received varying degrees of information regarding the bill. First, our control group was given only minimal context—that the budget bill had recently passed in the House. They then were asked to answer several questions regarding their attitudes toward the bill.
The other two groups received information about the bill’s distributional components. The first treatment group was shown the average percentage change in disposable income that the bill’s tax cuts would produce among households in the bottom 20 percent, compared with the effects on households in the top 1 percent. The second treatment group was shown how the combined effect of the tax and spending cuts would affect the bottom 20 percent and top 1 percent.
In both cases, we presented our results visually, in ways that previous research has suggested respondents can better understand.2 (The large treatment effects—as well as open-ended responses that we collected—suggest that those who took the survey grasped the basic implications of the figures we displayed.) We showed the percentage change in income, rather than dollar changes in income, because we feared dollar amounts would give a misleading impression. Moreover, assessing percentage changes in disposable income at different points in the income distribution is widely considered the gold standard for distributional analysis.
Following these informational interventions, we asked respondents to indicate their support or opposition toward the bill. We also asked them to indicate how their U.S. senator voting “yes” on the bill would affect the likelihood of their voting to reelect them. As a second measure of political commitment, we asked respondents if they would be interested in receiving additional information on a petition either in favor of passing the bill or urging senators to oppose it.
Finally, we asked respondents whether they had previously heard about certain provisions included in the bill. We turn first to these knowledge questions, then discuss the effects of the information we provided.
Americans have received limited information about the most regressive tax provisions of the bill
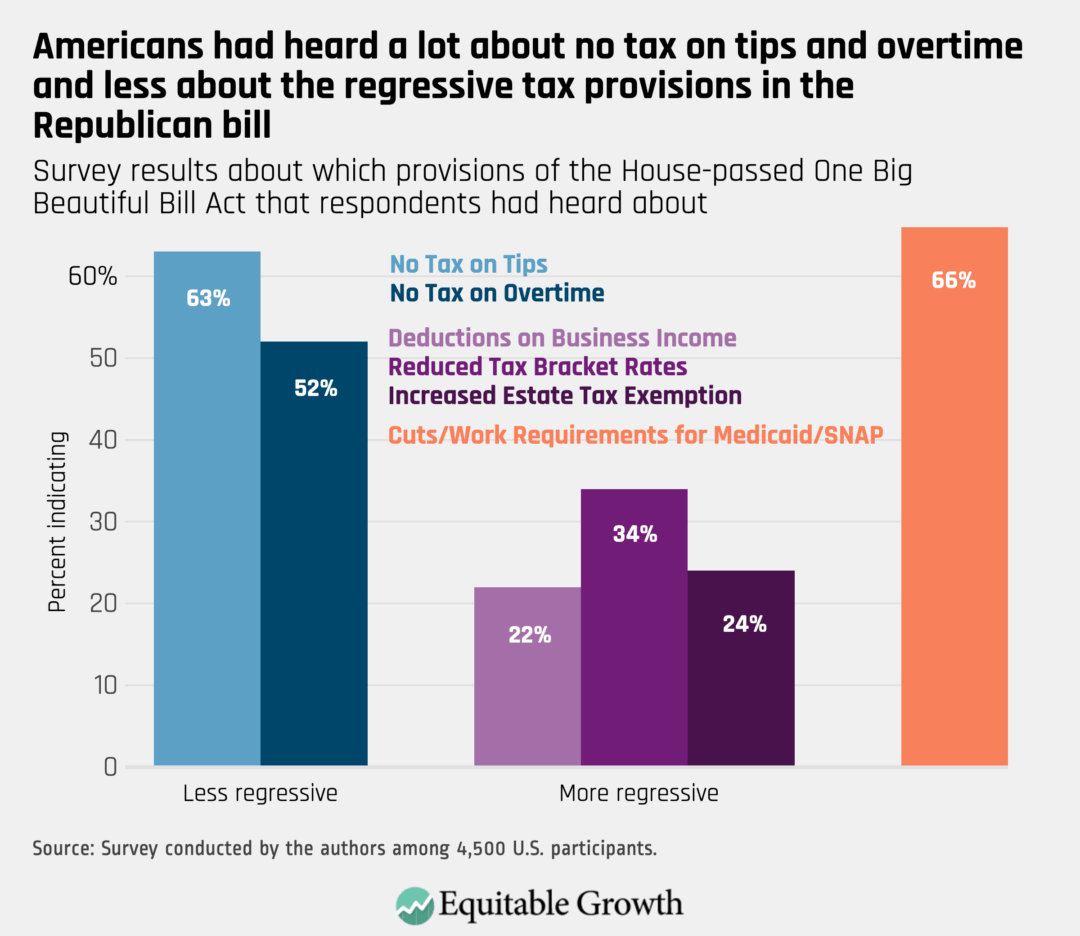
Those who responded to our survey had heard very little about the big-ticket regressive tax cuts in the bill, which account for most of its cost. For example, just 22 percent had heard anything about the expanded and permanent deduction for pass-through business income in the bill. By contrast, Americans were much more likely to have heard about Trump-supported tax provisions, such as no tax on tips or on overtime—provisions that Vice President JD Vance recently pointed to as proof of the party’s populist priorities. (See Figure 1.)
Figure 1
Yet these putatively populist tax provisions are a rounding error compared to the big-ticket tax cuts benefitting the rich, and they do little or nothing to reduce the bill’s regressive effects.
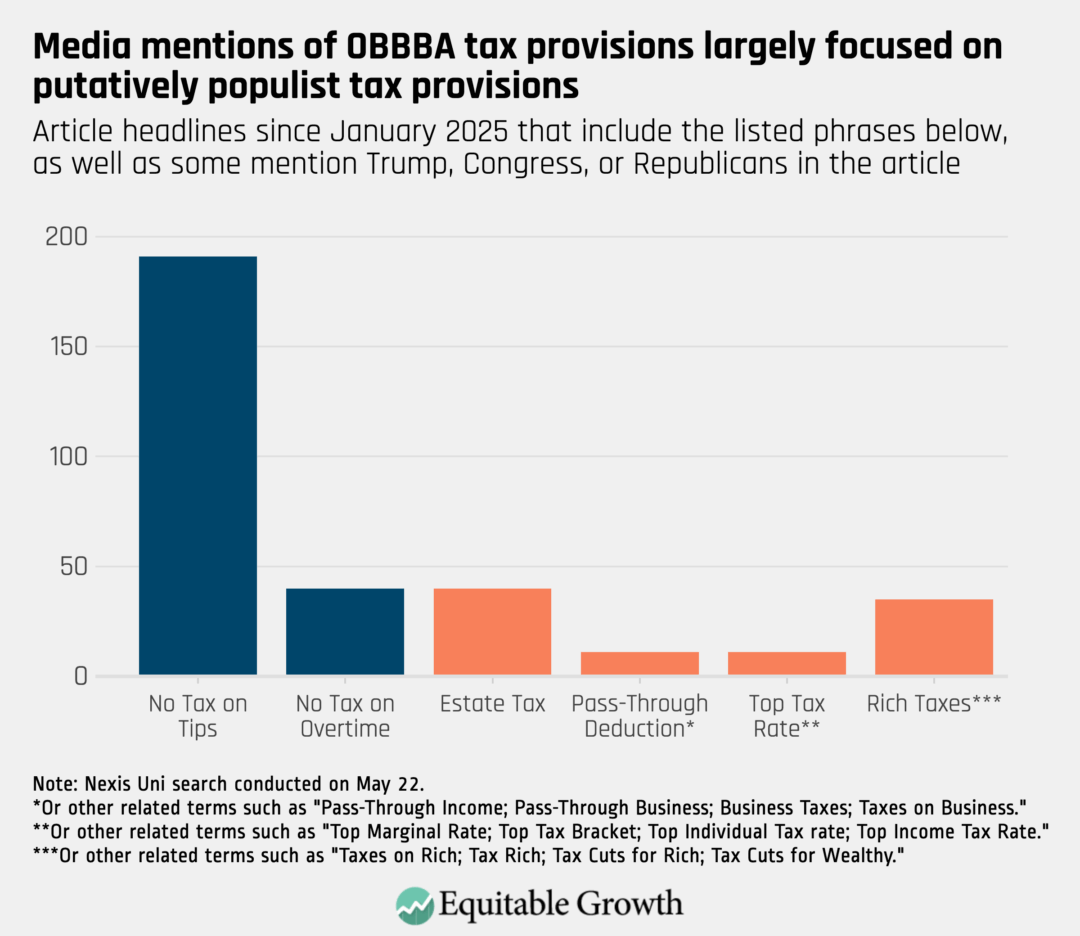
Media coverage of the bill provides further suggestive evidence of successful framing by Republicans. We looked at news headlines from the beginning of 2025 until the day the One Big Beautiful Bill Act was passed by the House of Representatives, counting the number of articles featuring the phrases listed in Figure 2, as well as some mention of “Trump,” “Congress,” or “Republicans” in the body of the article. As Figure 2 shows, the “no tax on tips” provision garnered a great deal of media attention, and even “no tax on overtime” headlines exceeded references to some of the more regressive provisions.
Figure 2
While the regressive tax cuts in the bill have not been well-covered by the media or well-understood by the public, our survey suggests that Americans were more aware of the spending cuts in the bill. Around two-thirds of our respondents had heard about proposed cuts to nutrition assistance and Medicaid, as seen in Figure 1.
Nonetheless, as we show in the next section, they still overwhelmingly opposed the bill upon learning more about the adverse distributional effects of these cuts.
Information about the distributional effects of the bill greatly increased opposition to it
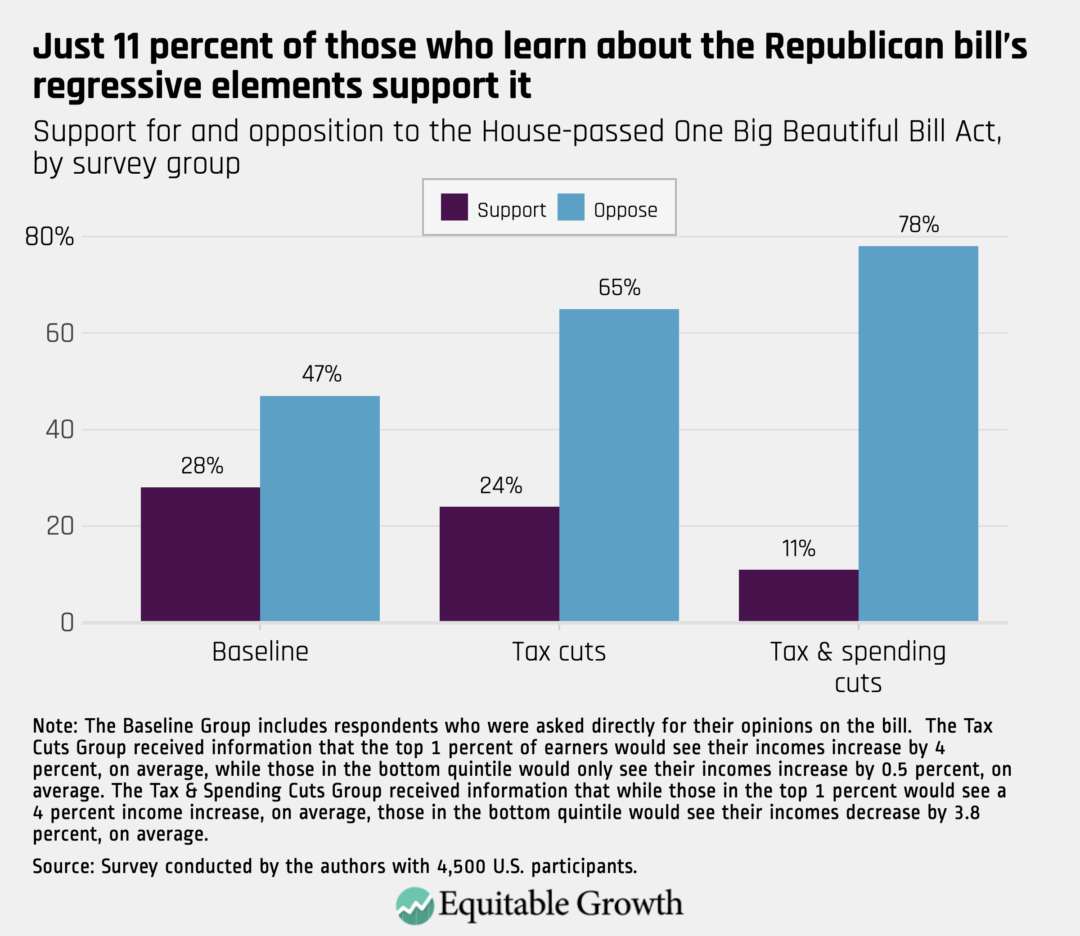
Despite many respondents having little familiarity with the more regressive tax provisions in the bill, baseline opposition already outpaced support in our control group by nearly 20 percentage points.3 Nearly 50 percent of respondents opposed the bill, while only 28 percent supported it. For the group getting information on the effects of the regressive tax provisions—that is, seeing that the bill would cause incomes for the top 1 percent to increase by nearly 4 percent, on average, while only increasing by 0.5 percent for the poor—opposition increased by 18 percentage points relative to our control group, from 47 percent to 65 percent.
We saw even larger effects among those in our second treatment group, who received information on the combined effects of the tax cuts and spending cuts. In this group, opposition increased by more than 30 percentage points relative to our control group, from 47 percent to 78 percent. Additionally, relative to the control group, support in this group dropped by more than half, from 28 percent to just 11 percent. As a result, the proportion of respondents opposing the bill was seven times higher than those supporting it. (See Figure 3.)
Figure 3
Information about the bill increased opposition most among self-identified Republicans
Given the tendency for partisans to resist negative information about their own political party, we were particularly interested in how the effect of providing distributional information varied by political affiliation—that is, among Democrats, Independents, and Republicans.
Baseline support for the One Big Beautiful Bill Act among Democrats and Independents was already low. For Democrats in the control group, just higher than 10 percent supported the bill, with nearly three-fourths opposed. Among self-identified Independents, opposition exceeded support by nearly 30 percentage points.
In both cases, however, opposition was higher in the two treatment groups. Among Democrats, opposition was 17 percentage points higher among those who received information about the combined effects of the tax and spending cuts, while support dropped by half, compared with the control group. Among Independents, opposition was 32 percentage points higher among those who received information about the combined effects, while support dropped by more than half.
Most striking, however, are the results for Republican support. In the control group, 54 percent of Republicans supported the bill and only 20 percent opposed it—a ratio of 2.7-to-1. Yet among Republicans in the first treatment group shown the skewed tax provisions, support and opposition became nearly identical. And among those in the second treatment group shown the more regressive combined effects, opposition tripled relative to the control group, increasing by 41 percentage points, while support dropped by more than half. As a result, the ratio of opposition-to-support increased to 2.65-to-1—nearly the exact opposite of the baseline ratio. (See Figure 4.)
Figure 4
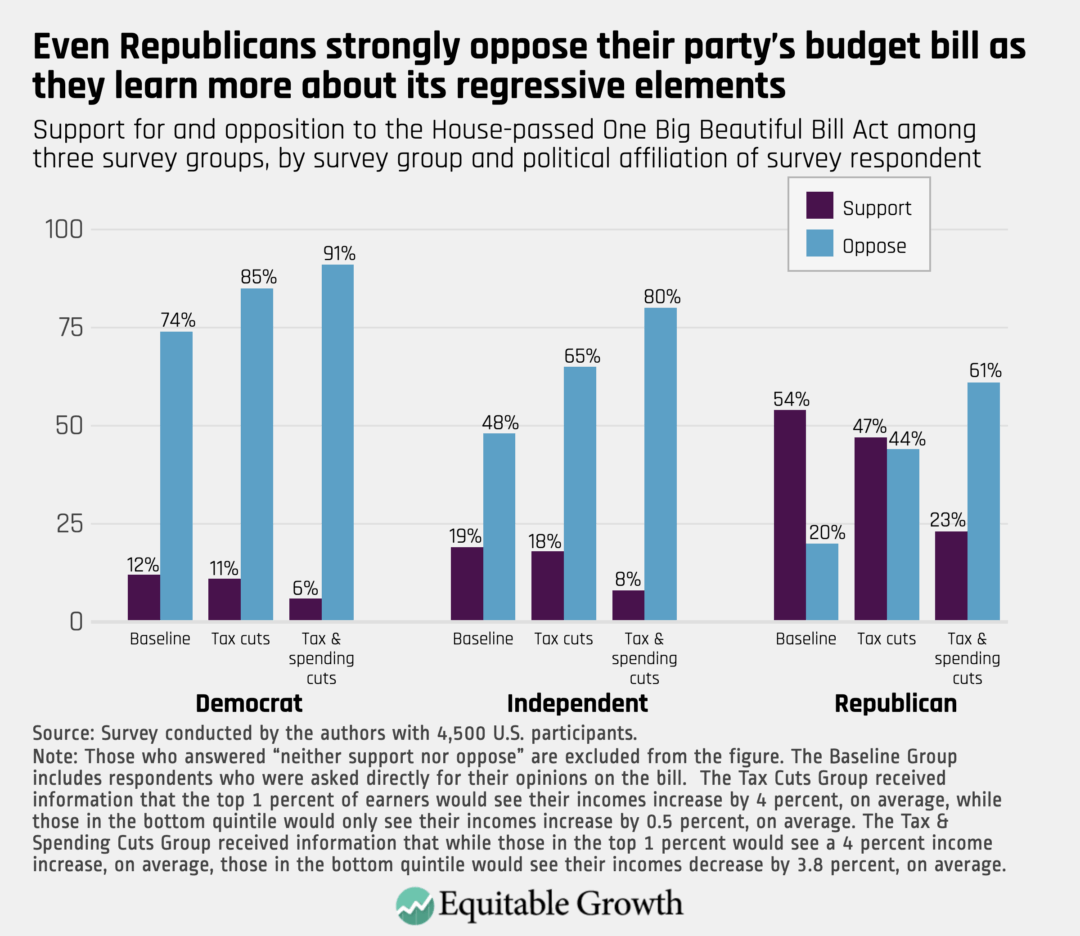
In short, simply showing Republicans how the bill would affect the incomes of the bottom and top income quintiles caused support and opposition to flip. These are striking effects for a bill backed by President Trump and supported by nearly all Republican members of Congress in the House and, more recently, the Senate.
Congressional representative support for the bill might affect future political behavior
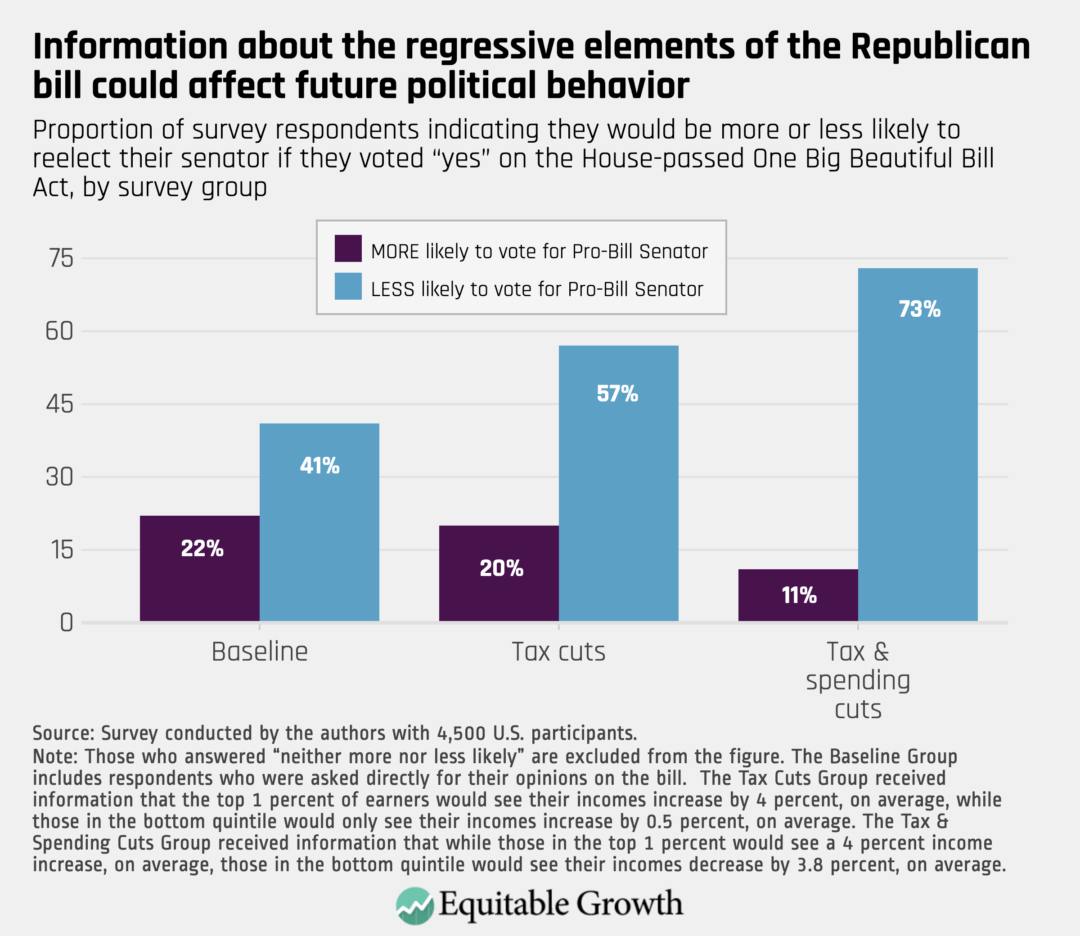
We also examined how distributional information about the House-passed One Big Beautiful Bill Act affected two additional outcomes: whether respondents would be more or less likely to reelect their senator in the future if he or she came out in support of the bill, and whether respondents would be interested learning more about a petition by a group urging senators to oppose or pass the bill.
Compared to the control group, respondents in both groups who received information on the regressivity of the bill indicated they would be less likely to vote for their senator if they were to vote “yes” on the bill. (See Figure 5.)
Figure 5
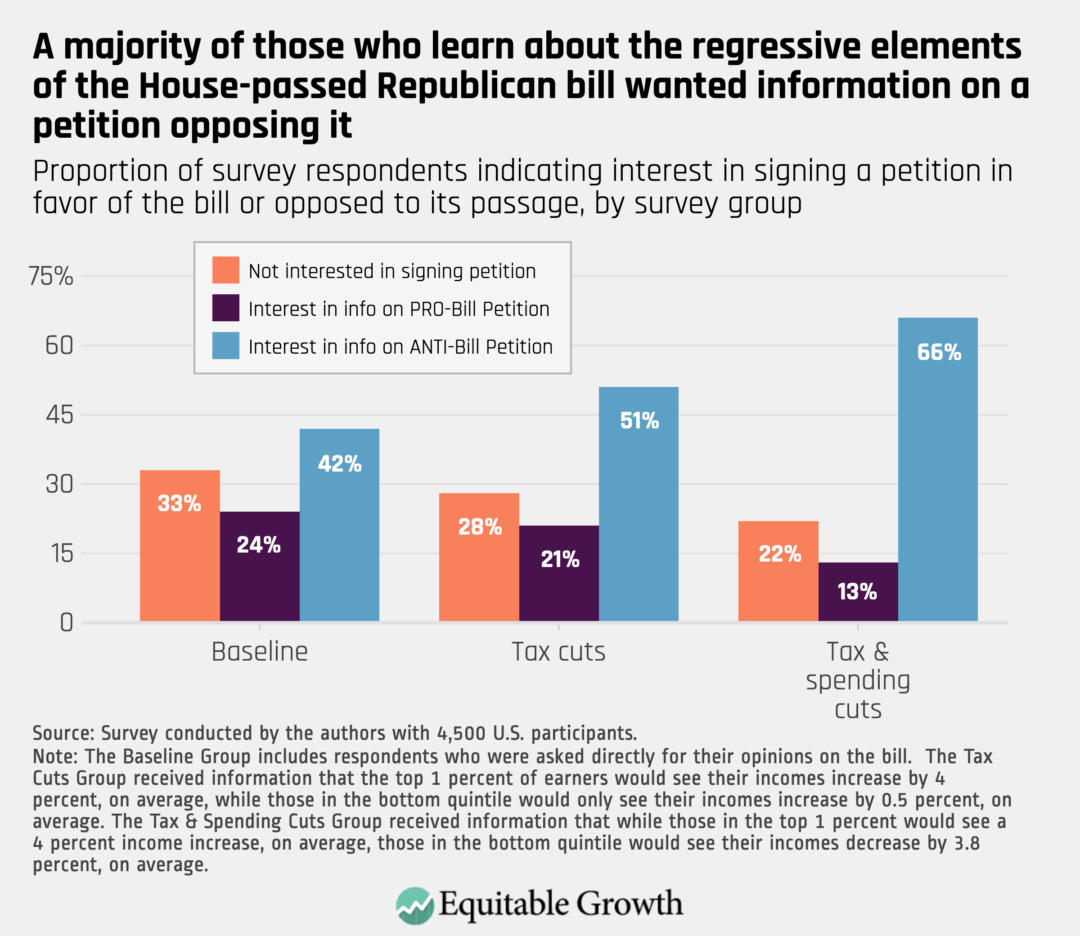
Respondents who heard about the bill’s regressive elements were also far more interested in obtaining additional information about a petition urging their senators not to pass the bill. (See Figure 6.)
Figure 6
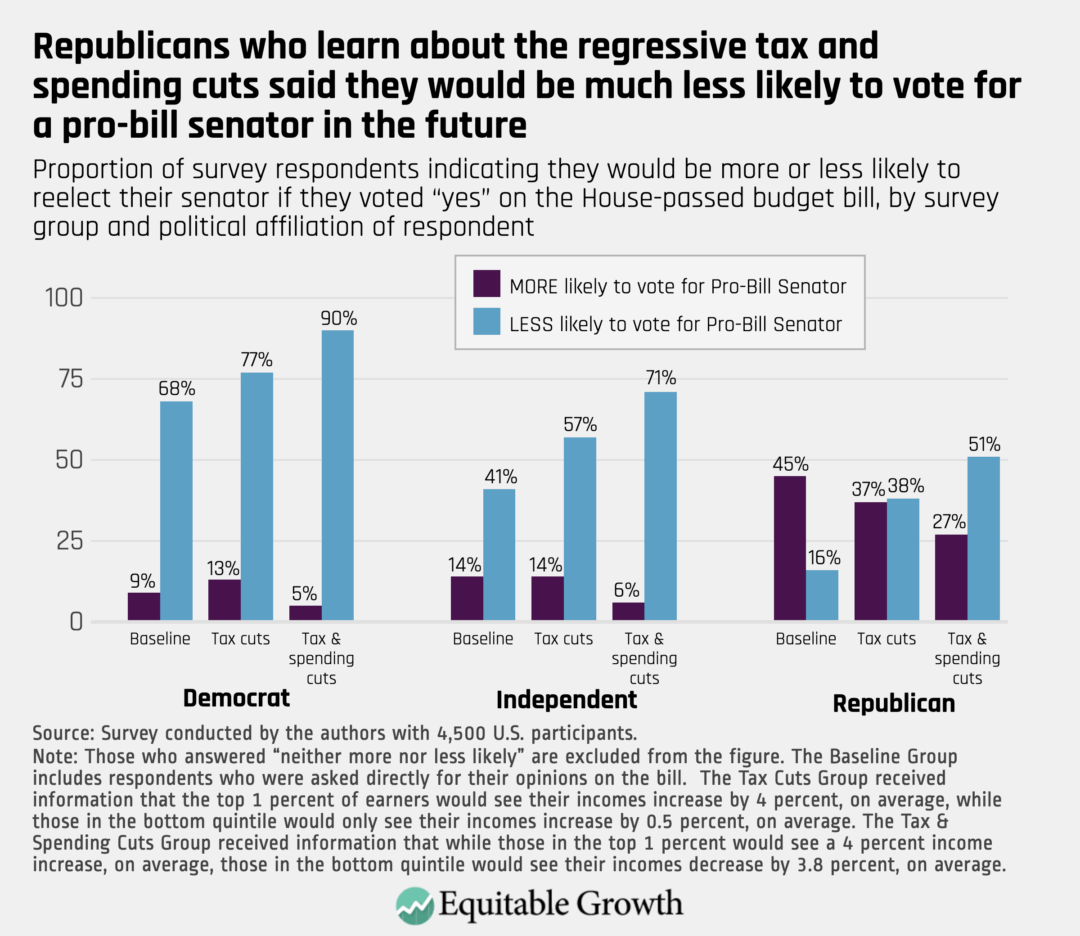
These effects were directionally consistent across Democrats, Independents, and Republicans. As with support for the bill, however, the biggest effects were seen among Republicans. For example, 45 percent of Republicans in the control group said they would be more likely to vote for their senator if he or she supported the bill, but among Republicans shown the combined distributional effects of the bill’s tax and spending cuts, just 27 percent said they would support their senator in future elections, while 51 percent said they would be less likely to reelect their senator if he or she supported the bill. (See Figure 7.)
Figure 7
Americans do not support the ‘Big Beautiful Bill’
The One Big Beautiful Bill Act is the most regressive policy package in living memory. With its distinctive mix of tax cuts that help the rich and spending cuts that hurt middle- and low-income Americans, it shifts more resources up the income ladder than any bill passed since fiscal scorekeepers started keeping track 40 years ago.
The public is already against the One Big Beautiful Bill Act. Yet our survey results show that when its historic regressivity becomes clearer and more concrete, Americans across the political spectrum become overwhelmingly opposed.
This should not be surprising. Only two major bills since 1990 rivaled the unpopularity of the Republicans’ current bill when they were debated. The first, as noted, was the tax cuts of 2017, which the current bill seeks to extend and expand. The second was the failed effort to repeal and replace the Affordable Care Act in 2017, which, similar to the current Republican bill, threatened the largest increase in the share of Americans without health insurance in U.S. history.
Republicans are, in effect, seeking to combine two remarkably unpopular bills into one historically regressive one, combining top-heavy tax cuts such as those pursued in the 2017 Trump tax law with draconian spending cuts similar to those pursued in the repeal and replace bill. Little wonder that Americans oppose the One Big Beautiful Bill Act—or that the more they learn about its regressive distributional effects, the more they reject it.
Acknowledgements
We would like to thank Emilie Openchowski, Elena Waskey, and David Mitchell at Equitable Growth for providing feedback, encouragement, and assistance in assembling this report; Kris-Stella Trump, David Hope, Julian Limberg, and Charlotte Cavaillé for valuable feedback on our survey design; and Eric Scheuch for valuable logistical assistance in getting the survey up and running.
Did you find this content informative and engaging?
Get updates and stay in tune with U.S. economic inequality and growth!
End Notes
1. The numbers we used come from distributional estimates of the House version of the One Big Beautiful Bill Act by the Yale Budget Lab. We chose to use these well-respected estimates because they were the only ones available that estimated effects by quintile and separately considered the tax cuts and spending cuts.
2. For instance, some researchers have argued that those who have lower levels of education and lower levels of literacy may be better able to make sense of political information when text is paired with visuals. See Markus Prior, “Visual political knowledge: A different road to competence?” The Journal of Politics 76 (1) (2014): 41–57.
3. The ratio of those opposing-to-supporting the bill is roughly the same as recent polling. For instance, a recent Kaiser Family Foundation poll from June 17, which asked respondents directly about whether they viewed the One Big Beautiful Bill Act favorably or unfavorably, found that negative views outnumbered positive ones by a ratio of 1.8-to-1 (64 percent unfavorable to 35 percent favorable). Within our control group, opposition outnumbers support by a ratio of about 1.7-to-1. The results of the Kaiser Family Foundation poll can be found at https://www.kff.org/medicaid/poll-finding/kff-health-tracking-poll-views-of-the-one-big-beautiful-bill/.


Stay updated on our latest research