To fight falling U.S. intergenerational mobility, tackle economic inequality

Economic inequality—on the rise since the 1980s—is occurring at the same time that intergenerational mobility is on the decline. Intergenerational mobility measures the relationship between children and their parents’ incomes. Raj Chetty of Harvard University and his co-authors investigated the relationship between intergenerational mobility and economic inequality in the United States in their 2016 article in Science, “The Fading American Dream: Trends in Absolute Income Mobility since 1940.” The authors tracked the economic progress of cohorts of children born between 1940 to 1980 and found that absolute mobility decreased for each successive cohort. In the 1940 cohort, 92 percent of children earned more than their parents. However, by the time the 1980 cohort turned 30 years old, only 50 percent of them were able to do the same.
We visualize this declining mobility in the infographic below using the economic paths of two children, one born in 1950 and the other born in 1980. If the child born in 1950 grew up in a household with a median income of $29,000 annually, as an adult, that child would be able to out-earn their parents even if they were earning below-median incomes. But the child born in 1980 who grew up in a household earning a median income of $53,000 annually would have to have a better job than their parents in order to out-earn them. That 1980 child could be at the 60th percentile of the income distribution—a full 10 percentage points above their parents’ place in the distribution—and still barely out-earn them with an income of $55,000. The cost of downward mobility has also grown even steeper over time, with children in the 1980 cohort unlucky enough to slip into the bottom fifth of the income distribution, earning less than $16,000 per year versus $28,000 in the earlier cohort. (See Figure 1.)
Figure 1
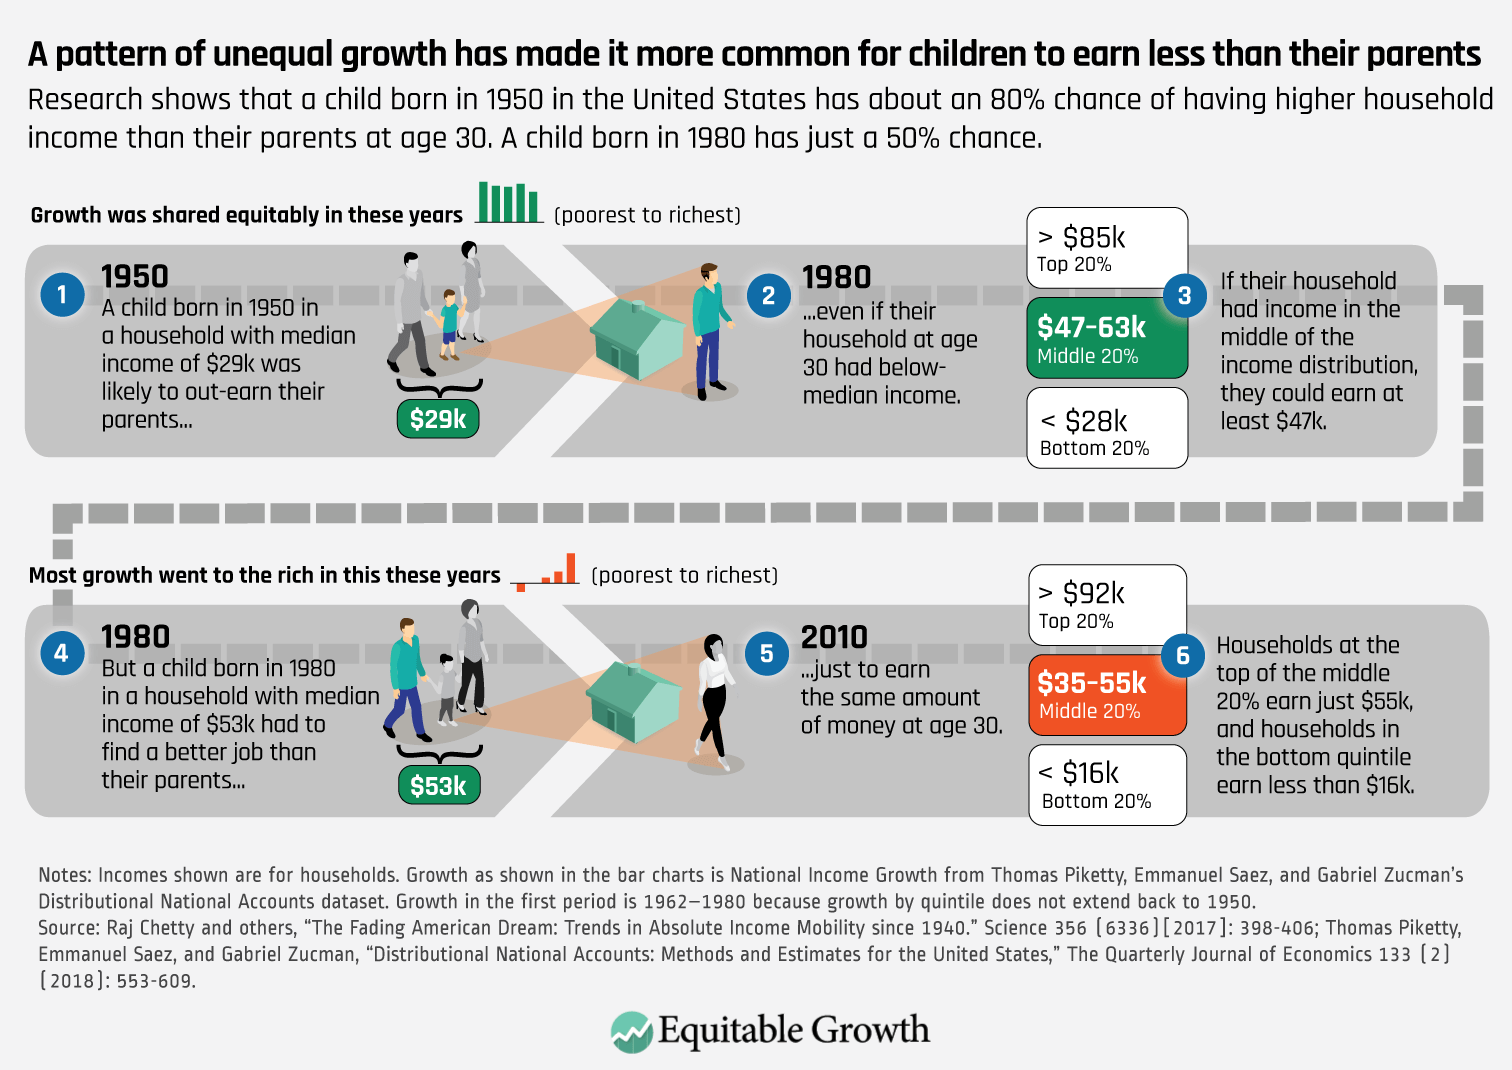
The bar graphs above each child’s path in Figure 1 above show patterns of growth during the child’s lifetime. The green bars show us that total growth was distributed more or less equally across all five income quintiles for the earlier time period. This era of equitable growth corresponded to the era of upward mobility. Then, the pattern changed over the next three decades. The orange bars, which represent how total growth in the later time period was distributed across those same income quintiles, show how growth was concentrated among the top income earners and was even negative for those at the very bottom. This period of unequally distributed growth is also when we see the lower rates of mobility for the 1980 cohort.
How much did rising inequality versus lower economic growth over the latter time period affect mobility outcomes? Figure 2 below shows the mobility trajectory of kids born in 1940 and 1980. Chetty and his co-authors conducted two counterfactual simulations:
- A cohort experiencing the 1940 growth rate and 1980 levels of income inequality, represented by the green line
- A cohort experiencing 1940 levels of income inequality and 1980 growth, represented by the purple line
When counterfactual one is applied, the gap between the 1940 cohort and the 1980 cohort closes by only 29 percent, while counterfactual two closes about 70 percent of the gap. (See Figure 2.)
Figure 2
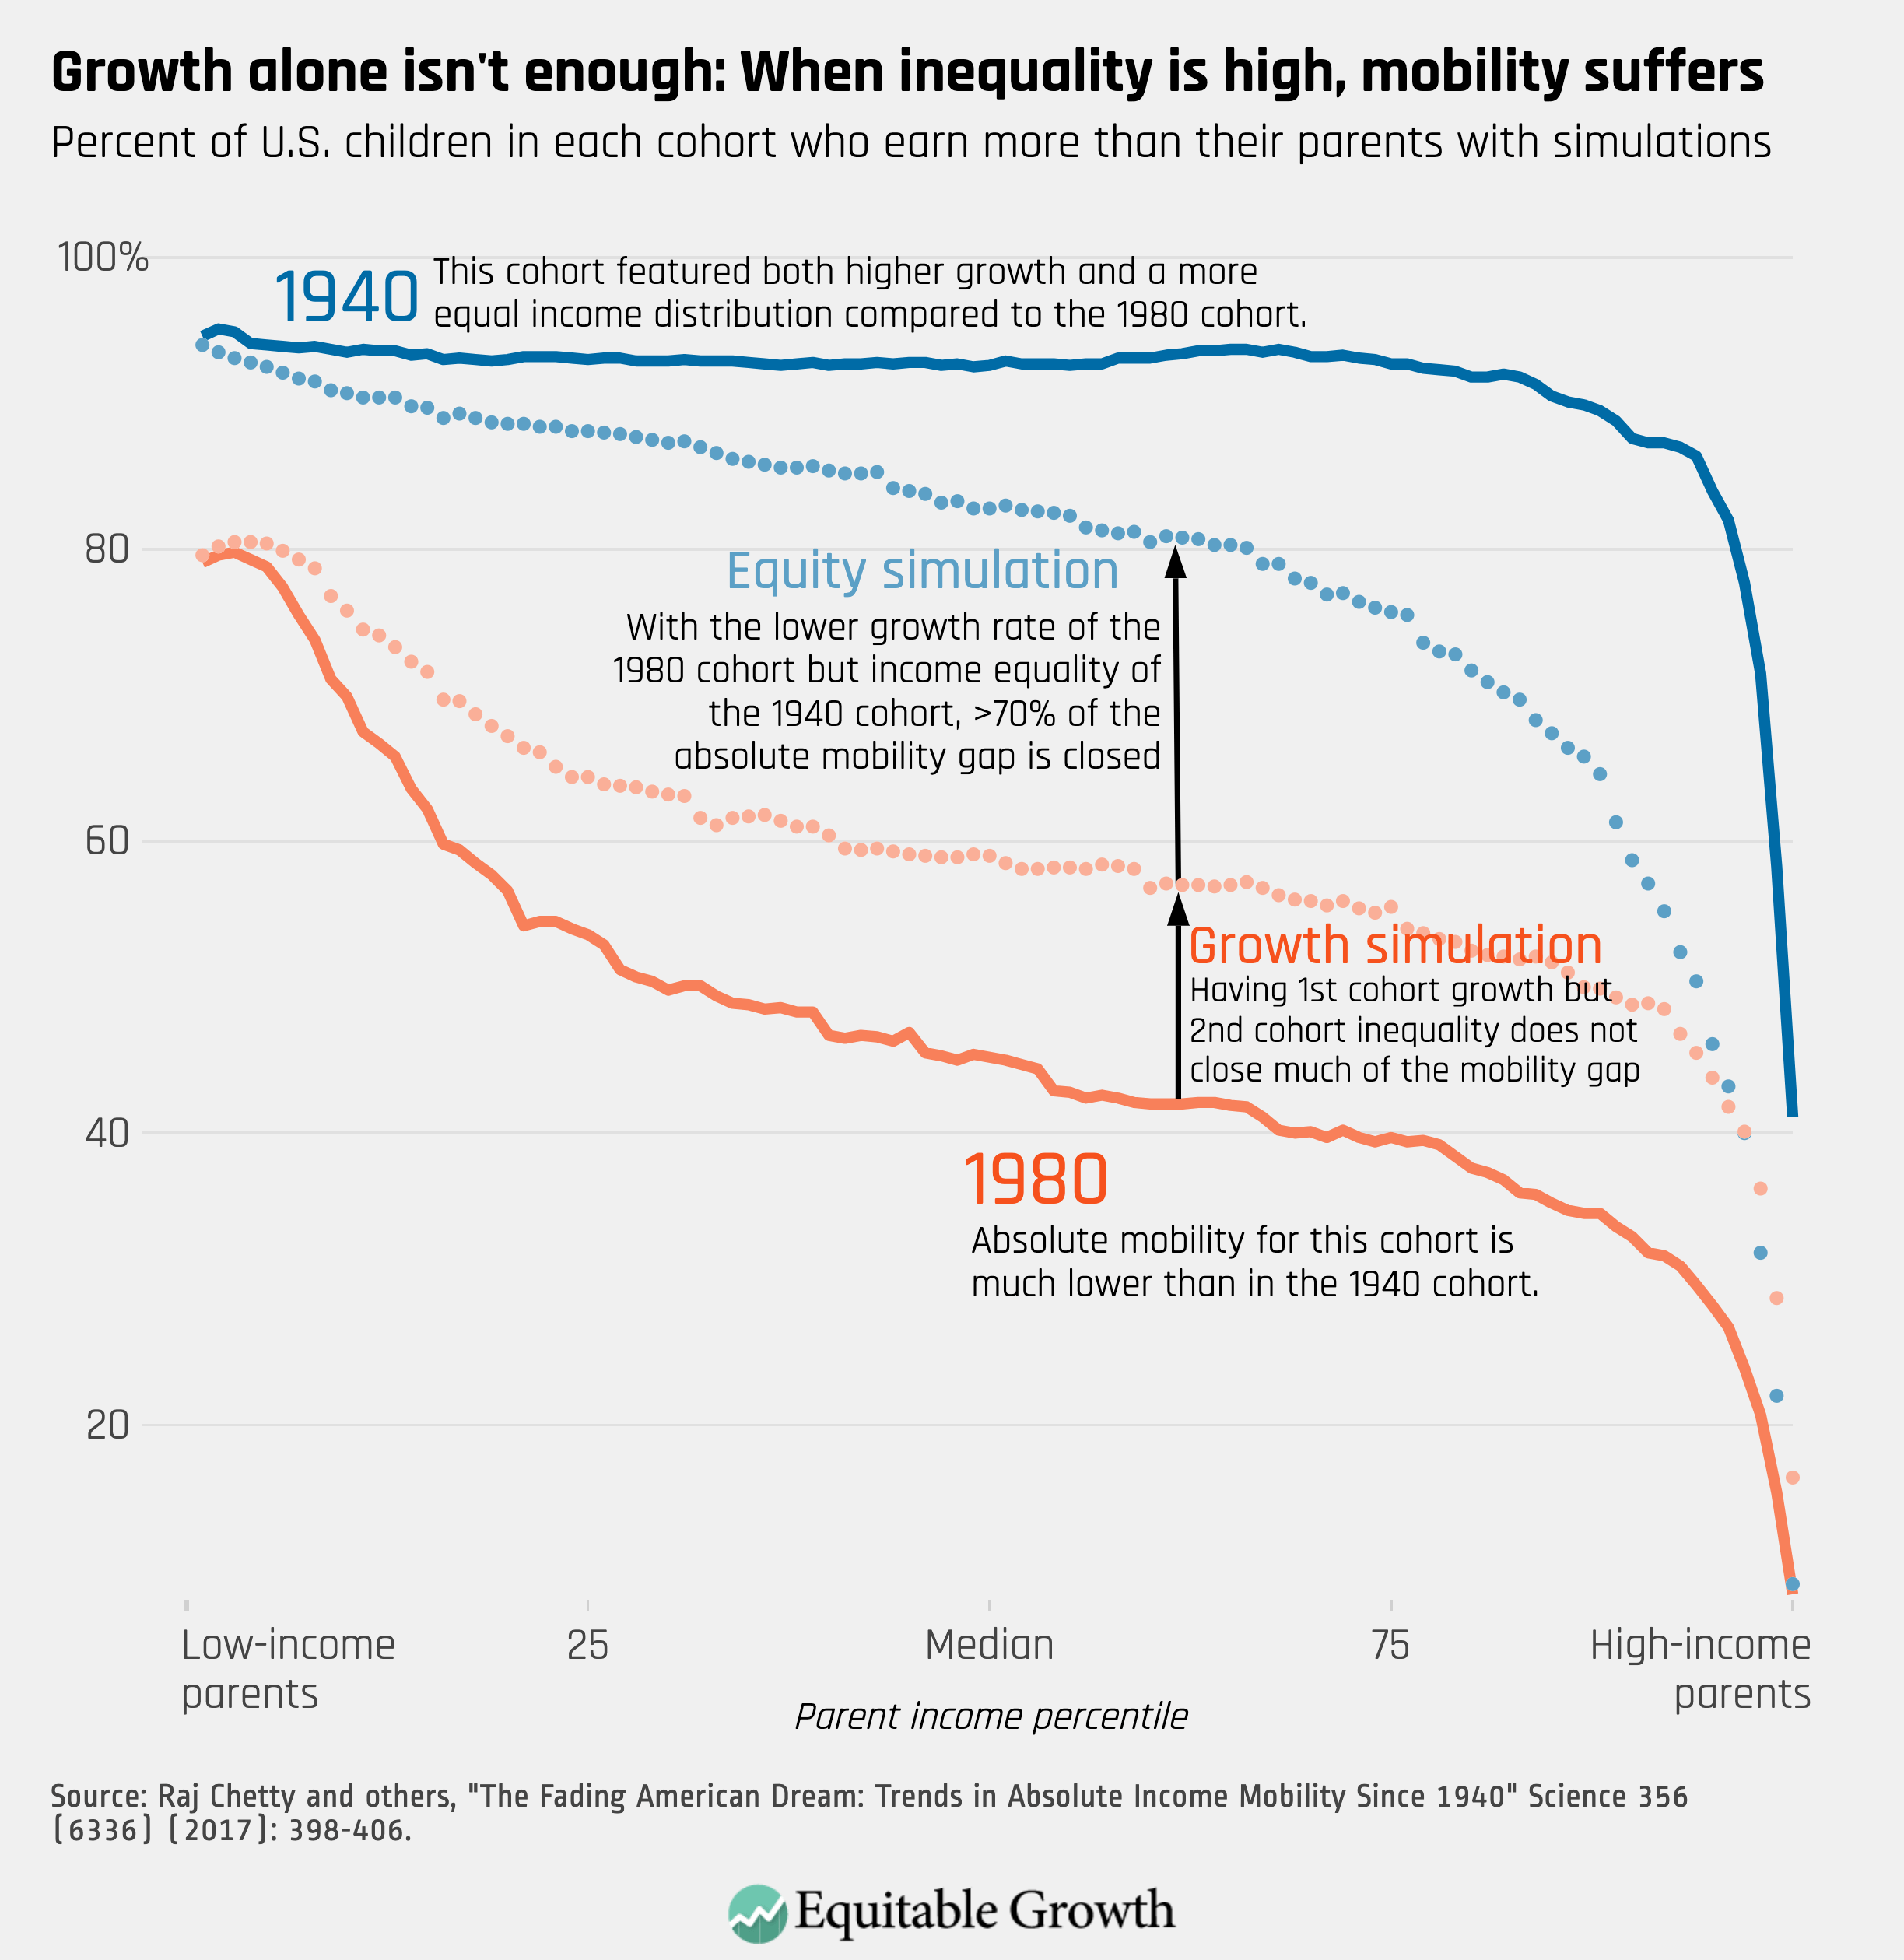
This disparity indicates that addressing economic inequality would have a greater positive effect on intergenerational mobility than would boosting economic growth. As our GDP 2.0 project illustrates, the unequal distribution of growth has made GDP a misleading metric that does not paint a representative picture of how Americans experience and benefit from growth, especially among the bottom half of income earners.
By measuring how growth is distributed, we will be better able to assess how economic growth is impacting households across income levels and who is benefiting from current economic trends. GDP 2.0 statistics would help facilitate the diagnosis of concerning phenomena in the economy, such as indicating falling intergenerational mobility, increases in inequality that could presage weakness in future consumer spending, and that the U.S. economy is not working for every American. These results suggest that policymakers need to prioritize GDP growth that promotes low- and middle-class households, rather than just growth concentrated at the top. Increasing the GDP growth rate alone will not be sufficient enough to restore mobility to the levels witnessed in the 1940s, especially with the current distribution of income.