The surprisingly constant “housing wealth effect” in the United States

What was new about the housing bubble experienced across most of the United States from 2002 to 2006? The common story of the housing bubble and the resulting crash is that homeowners used their houses like ATMs, borrowing against the increased value of their homes to increase their consumption in a way they hadn’t before. In other words, homeowners were more able to turn a dollar increase in housing wealth into even more consumption. Economists would call this new relationship a higher “housing wealth effect.” But new research casts doubt on this narrative.
A new working paper, released yesterday as part of Equitable Growth’s Working Paper Series, takes a long view of the housing wealth effect. This new research comes from Adam M. Guren and Alisdair McKay of Boston University and Emi Nakamura and Jon Steinsson of Columbia University. Fundamentally, their paper tries to discern how much of an increase in housing wealth will flow into overall household consumption. The four economists use data going back to the mid-1980s, though their main results only cover 1990 through 2015.
It’s important to note that the four economists are looking at the relationship between housing wealth and consumption at the level of the local labor market (really a “core-based statistical area,” which is essentially a city and surrounding counties). The empirical results, then, will tell us how much consumption will increase in a specific area if housing prices increase.
How do we know that changes in housing prices are actually causally affecting retail employment? The economists develop a new “instrument” that exploits the fact that housing prices in cities are more or less sensitive to regional trends in housing prices. Since regional housing price trends shouldn’t be correlated with city-specific trends in retail employment (the authors’ measure of consumption), this should be a good instrument.
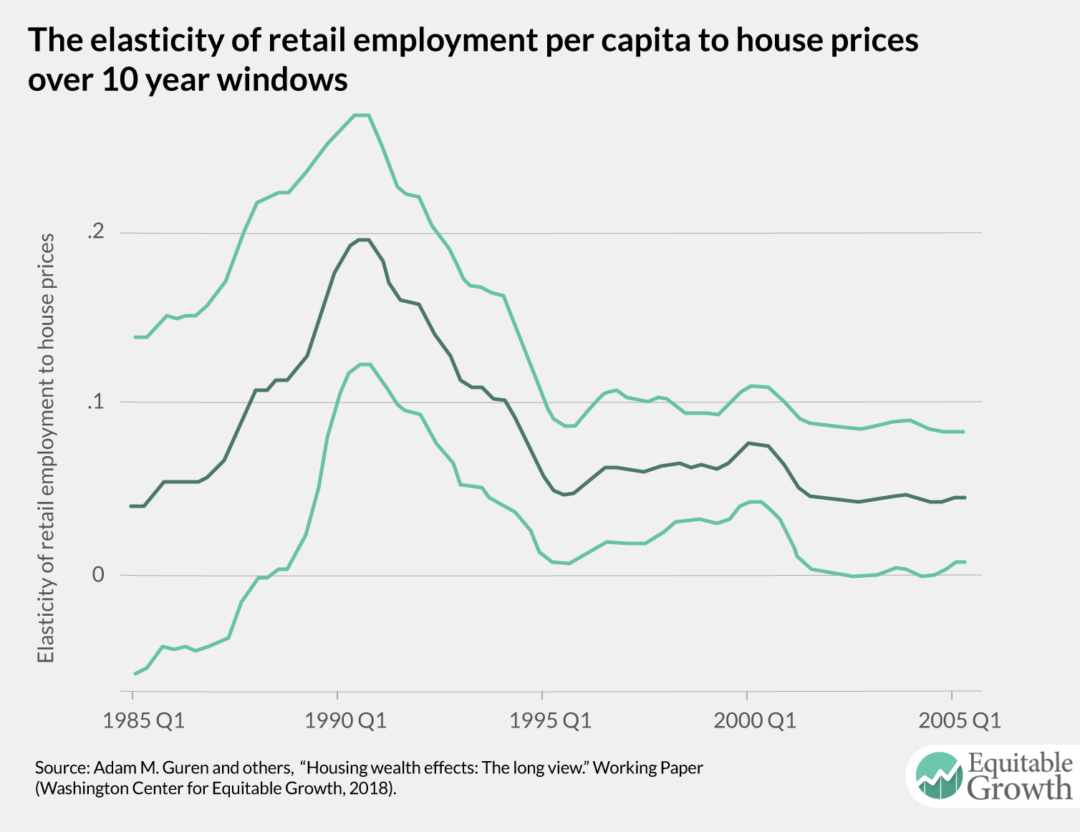
The results are quite interesting. The housing wealth effect was not particularly large during the 2002 to 2006 period. In fact, the elasticity seems to have declined from the early 1990s, hitting a peak of close to 0.2—representing a 2 percent fall in retail employment—in the 1990-to-2000 period and drawing closer to 0.5 during 2005 to 2015. (See Figure 1.)
Figure 1

Their research finds that over the whole time period, consumers would have increased their consumption by an extra 2.76 cents in response to an additional dollar of housing wealth. So, a $10,000 increase in housing wealth would lead to about $276 of additional consumption.
If the reaction to a given amount of housing wealth wasn’t particularly strong, then why did consumption increase so much during the boom and drop during the bust? Well, the swings in housing prices were historically huge. A big increase in housing wealth with such steady elasticity is still going to increase consumption quite a bit.
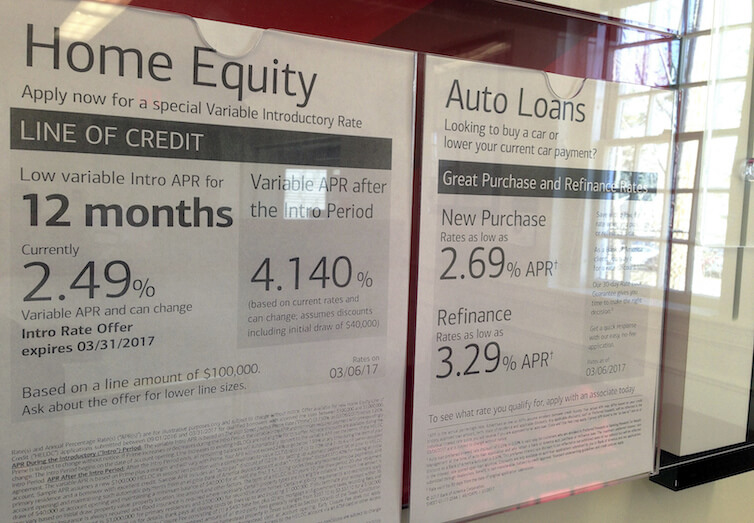
If households were using their homes like ATMs, they weren’t doing so more than past homeowners. Home equity line of credit loans that allow homeowners to borrow against the value of their home have been around for decades. The four economists quote a report written by former Federal Reserve Chair Alan Greenspan about increases in housing prices and consumer behavior. Greenspan writes, “The combination of very rapidly rising prices for existing homes and a sharp increase in sales … of these homes has created a huge increase in capital gains and purchasing power during the past two years … by far the greater part has been drawn out of home equities and spent on other goods and services or put into savings.”
The thing is, Greenspan didn’t write that during the 2000s housing bubble. It was published in 1982.


