Must-Reads: October 18, 2016


Should Reads:

Inequality: Brown University Janus Forum

Brown University Janus Forum Lecture: Inequality: Is America Becoming a Two-Tiered Society?

N. Gregory Mankiw and J. Bradford DeLong

Faculty Club at Brown University :: 5:30 PM – 8:00 PM :: October 17, 2016


My Presentation:

NewImage NewImage NewImage NewImage NewImage NewImage NewImage NewImage NewImage NewImage NewImage NewImage NewImage NewImage NewImage NewImage NewImage NewImage NewImage NewImage NewImage

This presentation file: https://www.icloud.com/keynote/0gIuwcJ_jAF0MtGozXgE7_95Q#2016-10-17_Brown_Janus

Economic insecurity rises around childbirth, explained in four charts

Between the sleepless nights, routine doctors visits, endless baby supplies, and childcare arrangements, having a child, to put it mildly, is a mammoth investment. Parents put a significant amount of time and money into preparing for and rearing a newborn, which has tremendous pay-offs for a child’s development in the longrun. Despite the well-understood temporal and pecuniary chaos that is pregnancy and early parenthood, there is relatively little quantitative documentation on just how much a new child affects household finances.
 

In a new working paper, Alexandra Stanczyk, a postdoctoral scholar at University of California-Berkeley’s School of Social Welfare, contributes to this literature, exploring how U.S. household economic well-being changes in the year leading up to and following the birth of a child. Harnessing the monthly longitudinal panel data in the Survey of Income and Program Participation, Stanczyk tracks three different measures of economic security, all of which demonstrate that there are substantial decreases in household economic well-being around the birth of a child.

1.

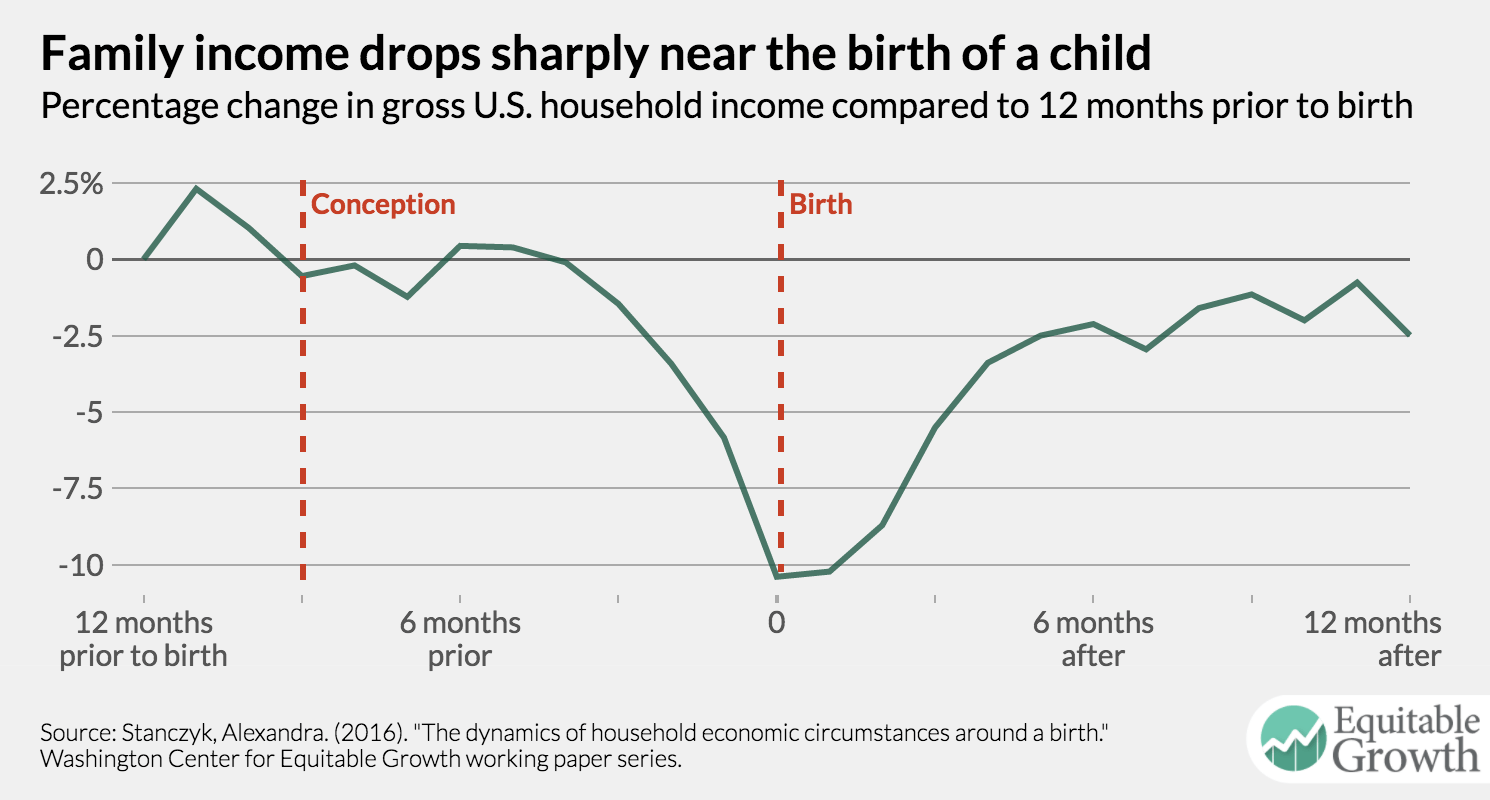
The data show U.S. household income dramatically falls around childbirth

About four months before birth, gross household income—one of Stanczyk’s economic well-being indicators that includes a household’s total income, public program cash transfers, refundable tax credits, and income from other unrelated household adults—declines sharply. In fact, by the time of birth, gross household income is, on average, 10.4 percent below its value just 12 months prior.

2. & 3.

The results hold for different demographic groups

Stanczyk charts that these income shocks around a birth of a child are visible across different demographic groups, too. Take educational attainment: Regardless of a mother’s education level, gross income drops around a birth, but households that have either very high or very low levels of education are hit the hardest.
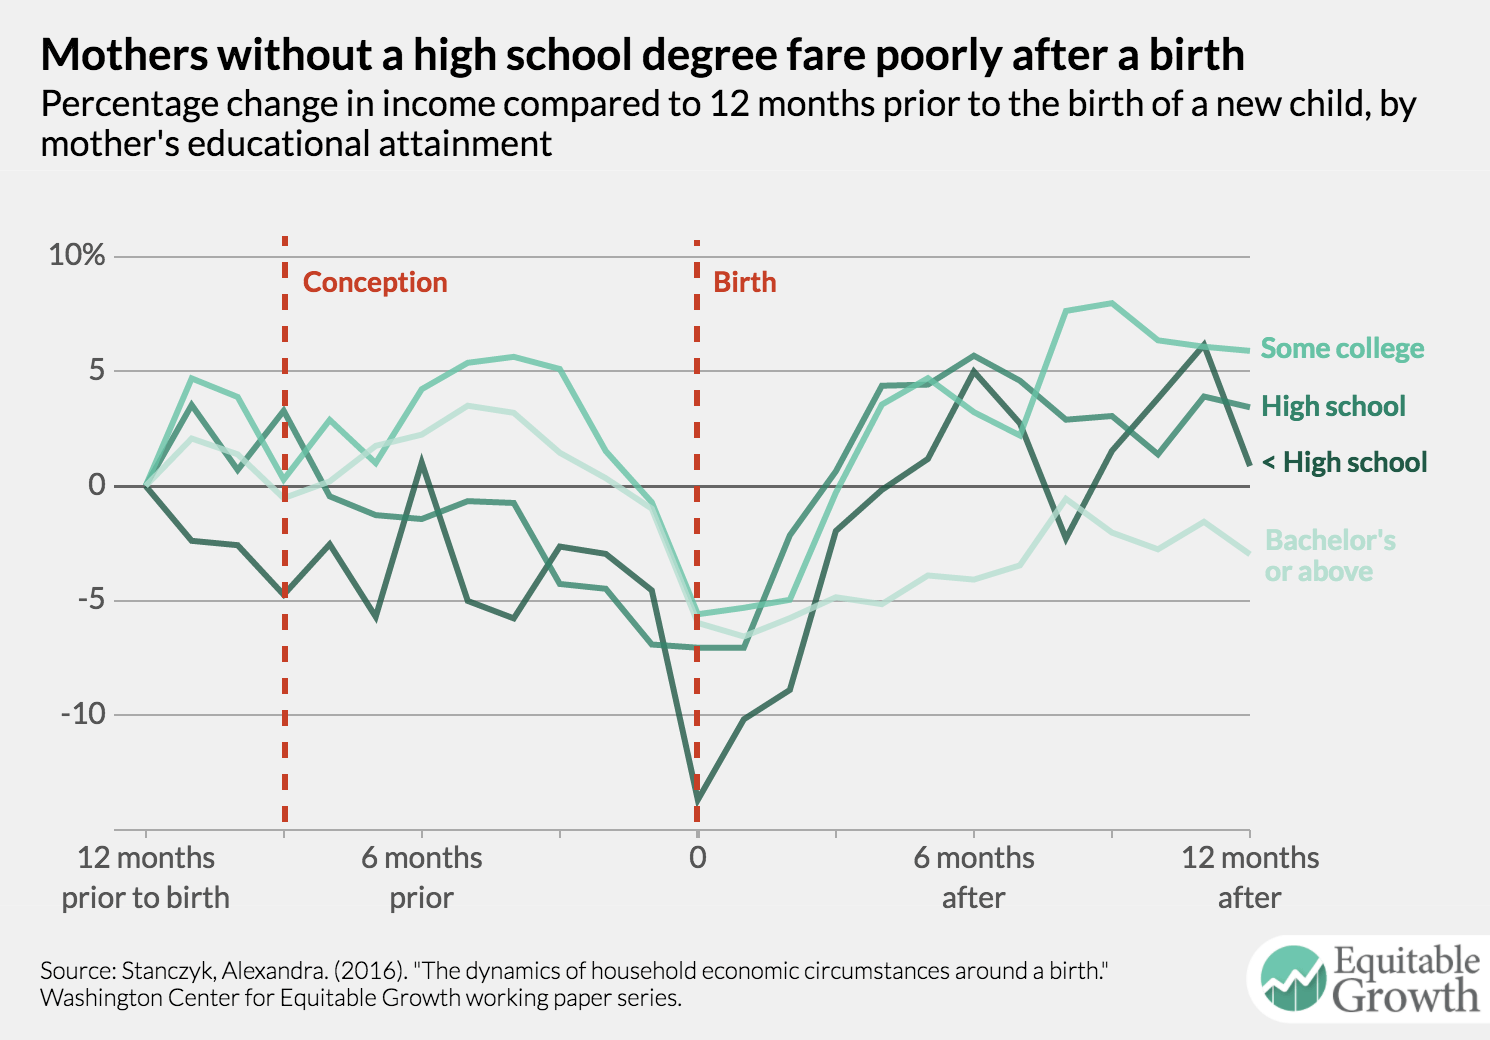
 

In households where mothers have a bachelor’s degree or more, income does not fall substantially, but it takes a significant amount of time for it to return to its original levels. The slow recovery may be because better-educated women are more likely to have access to policies that support leave around childbirth or have enough of a financial buffer to remain out of work for extended periods of time. For households where the mother hasn’t completed high school, gross incomes reach as low as 13.7 percent below its initially observed value at the birth month, but quickly return to pre-birth levels. This is in line with other research that shows less-educated women often return to work soon after giving birth because of financial strains and a lack of paid leave policies.

When looking at household structure, Stanczyk finds that households with only a single mother experience the greatest income volatility around a birth.
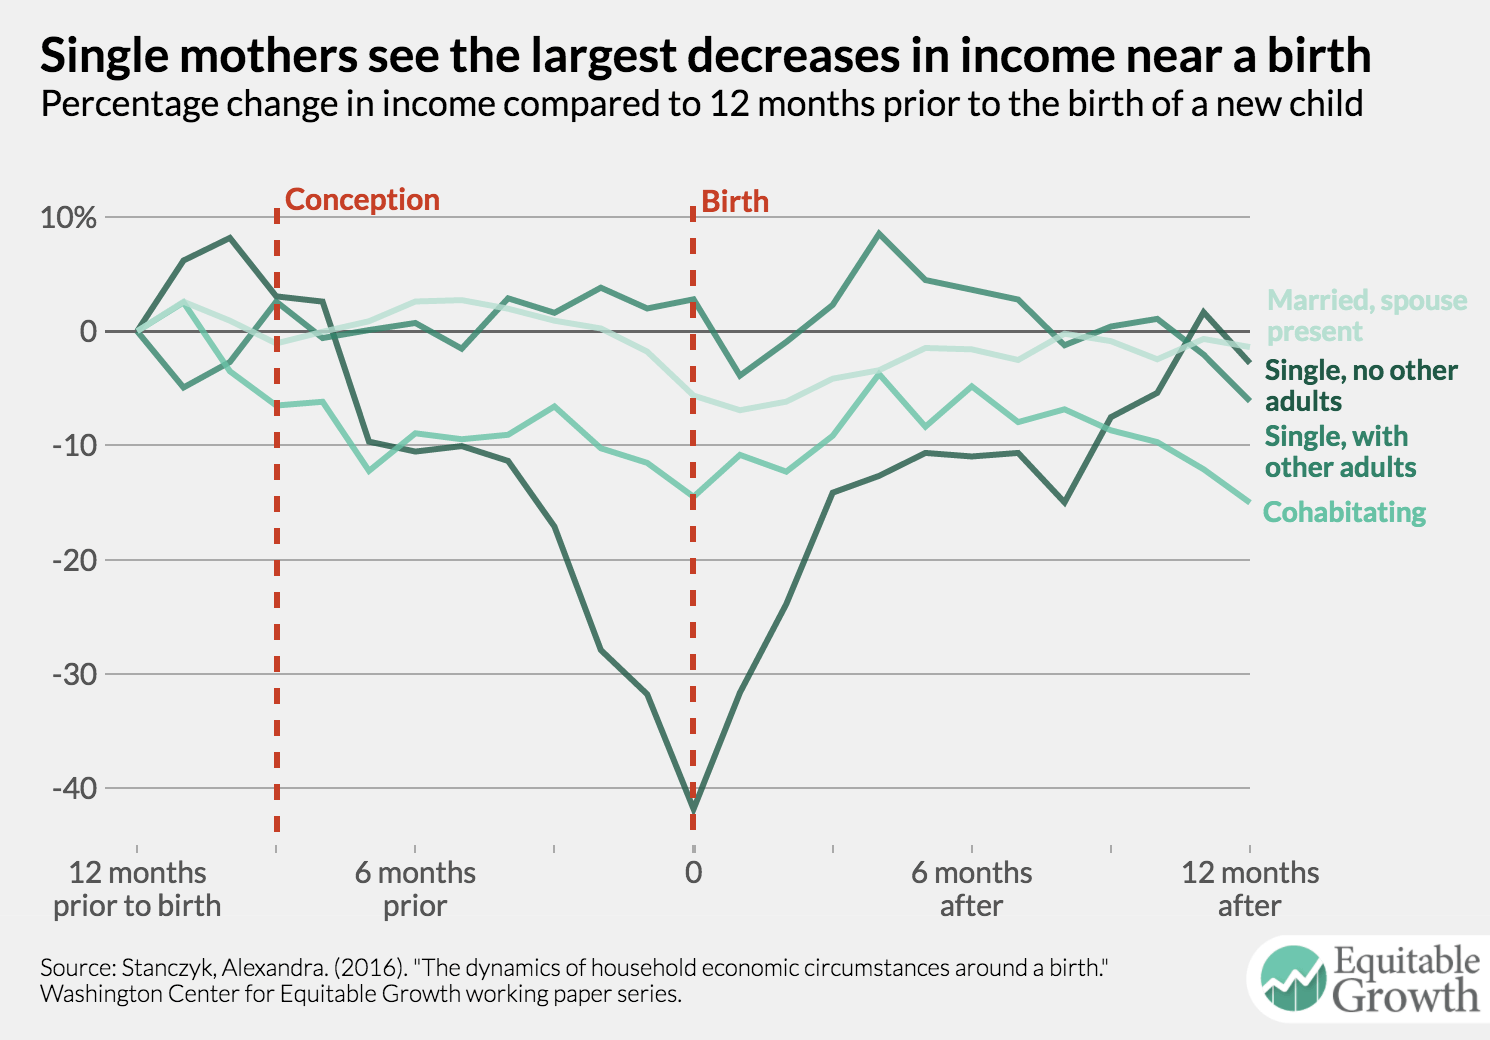
Shortly after conception, single-mother households see a steep deterioration in their gross income; on average, these households experience a 41.8 percent decrease in their starting income. Similar to households with less-educated mothers, income rapidly increases for these single-mother homes in the months after a birth.

4.

The composition of household income changes around birth, exacerbating the gender wage gap

To better explain this financial volatility that families face around childbirth, Stanczyk decomposes gross income into six parts: father’s earnings, mother’s earnings, other household adult’s earnings, income from public programs, income from child support, and other sources of income. It turns out that in the year leading up to birth, the mother’s share of household income sees the largest decreases, while the father’s share of household income increases. In other words, pregnancy and childbirth widens the gender wage gap.
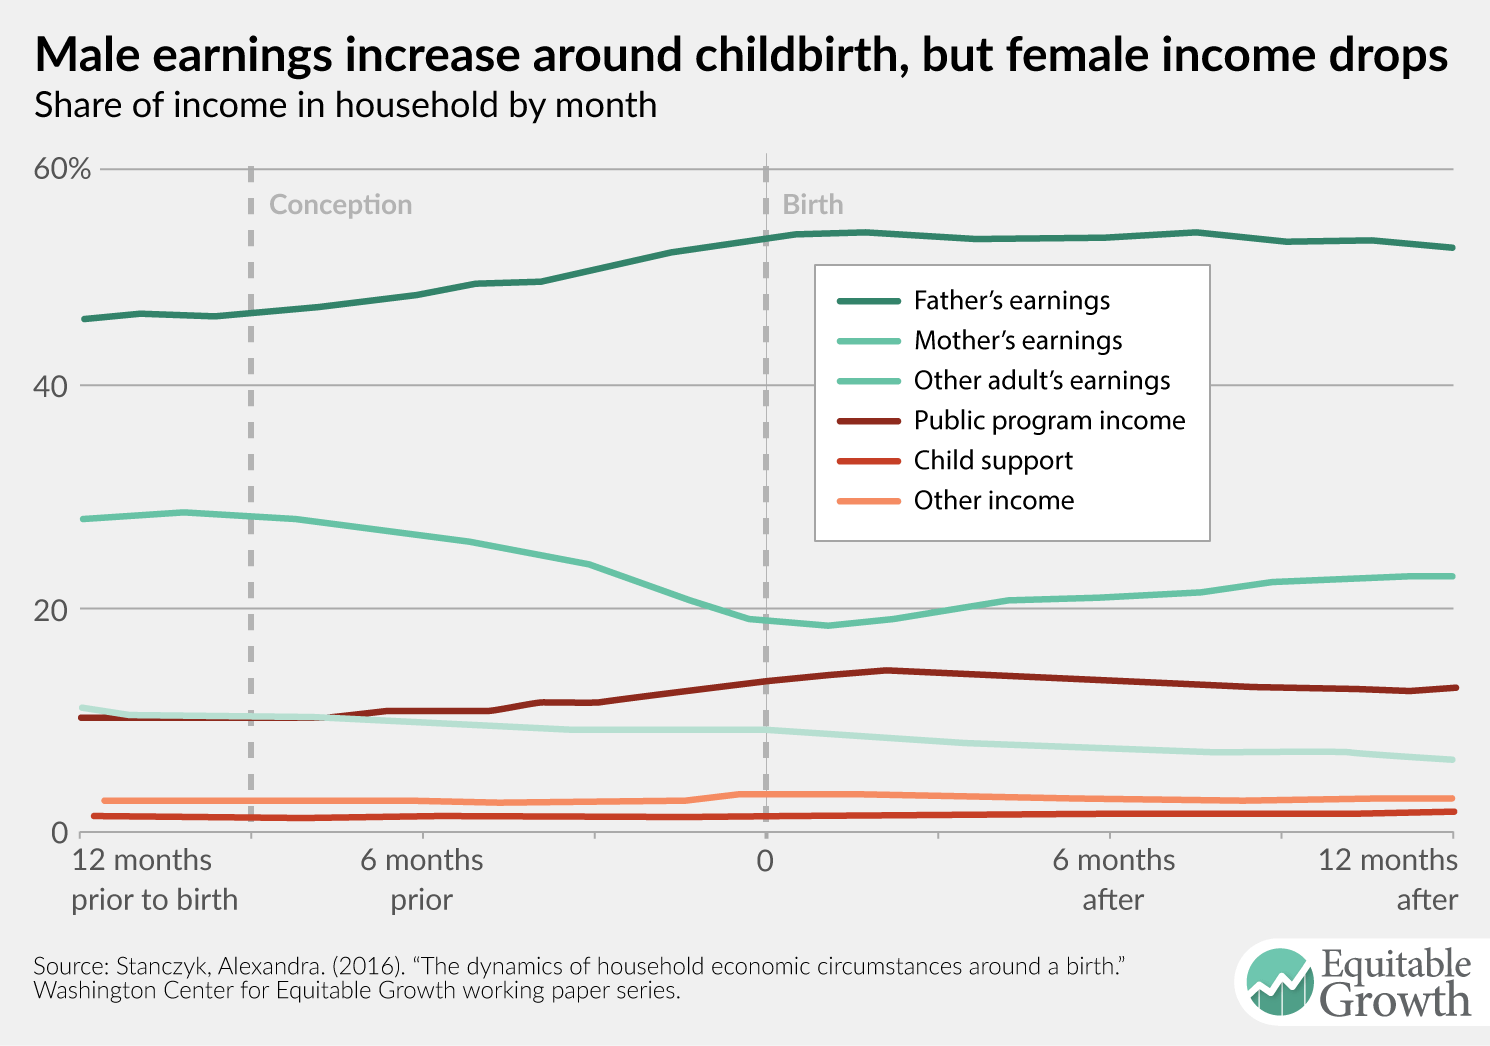
These results may be somewhat unsurprising given that most women in the United States take time off of work around childbirth, and to mitigate these losses to household income, fathers may increase their earnings if they are present. But Stanczyk also shows that families also become more reliant on income from public programs, such as the Supplemental Nutrition Assistance Program for Women, Infants, and Children, the Earned Income Tax Credit, or the Child Tax Credit.

Public programs help economic security for new families, but not nearly enough

As vital as these programs already are for household economic well-being around a birth, Stanczyk argues that social safety net programs need to be strengthened.

On one hand, improving the generosity of the programs can reduce sharp changes in household income during the period surrounding childbirth. On the other hand, the effectiveness of these programs may be hampered by when benefits are received. Stanczyk recommends adopting a child benefit policy—a social security cash transfer given to families with children—and implementing paid family leave and childcare subsidies. Altogether, these policies, if enacted equitably, can improve the economic security of households during a critical, and exciting, time.

(Early) Monday DeLong Smackdown: Labor Force Participation Trends

Prime age male for brad pdf

Has the Longer Depression accelerated the trend of “losing” prime-age males, crowding what would have been a generation of the trend into a decade, as I suggested at the FRBB Conference and here in contradiction to what Alan Krueger and Gabriel Chodorow-Reich were saying? No. Or, rather, you could say it looked like that as of 2013 if you thought recovery was then substantially complete. You really cannot say that anymore.

The extremely sharp Gabriel Chodorow-Reich in Email:

Gabriel Chodorow-Reich: Prime age male by 5 year age bin: “Here is a figure and a table related to our back-and-forth…

…The figure shows the LFPR over time for 25-54 year-old men split into 5 year age bins. (The data are the published BLS data with no adjustments for population controls,  I have smoothed and deseasonalized by taking a trailing 12 month moving average.) The dashed lines are the OLS trends estimated using data from 1976-2007.

What I take from the figure is that except for the 25-29 and 30-34 groups, the 1976-2007 trend fits the 2016 value pretty well.  As I said in my discussion, I’m not a huge fan of blindly taking trends and extrapolating.  But for the question of whether 2007-16 is unusual this seems a reasonable approach.  

There is a large deviation from the prior trend for the 25-29 and 30-34 male age groups.  The table, which was in my discussion slides, focuses on this group.  The plurality of the decline in participation is due to increased schooling. This seems benign.  The increase in those reporting disability is less so.  Using 2000 as a benchmark, the transition rates back into employment for this group also seem more elastic to a tighter labor market, which is consistent with other evidence.

Prime age male for brad pdf

Cf.: My earlier post:

Note to Self from Boston Harborside: Alan Krueger and Gabriel Chodorow-Reich both assure me that, to them, it does not look like the decline in prime-age male employment was materially accelerated by what I now call the Longer Depression. I don’t see it here. Are the changes in the age distribution within the category of 25-54 year olds over the past 40 years large enough to make this chart misleading? I cannot see it. I know that one disputes labor numbers with Alan Krueger (or Gabriel Chodorow-Reich) at one’s peril. But it looks to me like we were losing 1.25%/decade as far as prime-age male employment was concerned. And that in the past decade we have lost 3.25%–25 years’ worth of the trend in 10…

Employment Rate Aged 25 54 Males for the United States© FRED St Louis Fed

Did the Pace at Which We Lose Males 25-54 Accelerate?

Note to Self from Boston Harborside: Alan Krueger and Gabriel Chodorow-Reich both assure me that, to them, it does not look like the decline in prime-age male employment was materially accelerated by what I now call the Longer Depression. I don’t see it here:

Employment Rate Aged 25 54 Males for the United States© FRED St Louis Fed

Are the changes in the age distribution within the category of 25-54 year olds over the past 40 years large enough to make this chart misleading? I cannot see it. I know that one disputes labor numbers with Alan Krueger (or Gabriel Chodorow-Reich) at one’s peril. But it looks to me like we were losing 1.25%/decade as far as prime-age male employment was concerned. And that in the past decade we have lost 3.25%–25 years’ worth of the trend in 10…

The Prime-Age Men Missing from the Labor Force…

Two comments:

First, on non-participation of prime-age males:

  • We lost 22% of 55-64 male labor force participation 1958-1995…
  • Since 1995 we have gained 4% in 55-64 male labor force participation…
  • We were losing 1.2%-points of 25-54 prime-age male employment and labor force participation every decade….
  • Then we lost 7%-points of prime-age male employment in two years…
  • Now, seven years into the recovery, nearly a decade later we have gotten back to normal as far as the unemployment rate is concerned, but we are still 1.8%-points low of trend as far as prime-age male employment and participation is concerned…
  • We have crowded a generation’s worth of this shedding prime-age male participation process into a decade…
  • Is not the natural reading that the labor market shock of 2008-9 made a lot of people permanently sick, disabled, depressed, disconnected?
  • If not the psychological and sociological consequences of the Great Recession and Elusive Recovery, what else could have caused the speed-up of this process?
  • If anyone has an alternative candidate for the speedup, I would like to hear it…

Second, on video games:

  • There was a time when I had to decide whether I would win regularly at God level on the computer game Civilization or be an affective Deputy Assistant Secretary of the Treasury…
  • Back then I microwaved my CD-ROM…
  • But I am up to about one aleve every three days, so the lesson I take away from Alan is: I need to watch out…

Justin Fox: Not Working Makes People Sick: “Overall, men are less likely to be taking pain medication than women…

…But men who have dropped out of the labor force are much more likely to be taking pain meds than either other men or the women who’ve dropped out…. Most women who aren’t in the labor force are still working, just not for pay. Most men… simply aren’t working…. Half of the men not in the labor force… reporting that they were ill…. The ill-or-disabled percentage of the overall prime-age population wasn’t all that much higher for men (5.6 percent) than for women (5.4 percent).

Back in the 1950s and 1960s, about 97 percent of prime-age men either had jobs or were actively looking for them. Work has gotten less hazardous and physically demanding since then, not more. So how can it be that 5.6 percent of prime-age men report being out of the labor force now because of illness or disability, while only 3 percent were out of the labor force for any reason in the early 1960s?… A lot of it… is because long-term unemployment and inactivity make people sick…. Men who aren’t in the labor force spent an average of five and a half hours a day watching television and movies in 2014, compared with about two hours a day for working men and three and a half for unemployed men. That’s not exactly healthy.

It seems like vicious cycle. Men who drop out of the labor force–maybe initially for health reasons, maybe not–fall into lifestyles that render them ever less capable of rejoining it. (This may be true of a lot of women, too, but their characteristics are harder to nail down because of the split between those who are truly out of work and those with home responsibilities.) Getting them back into the labor force seems like it ought to be a national priority. But it’s not going to be easy.

Alan Krueger: Where Have All the Workers Gone?: “The Great Recession was accompanied by a noticeable decline in labor force participation, even among the prime working-age population…

…How much of this decline can be expected to reverse? Is a further tightening of the labor market a precondition for a much stronger rebound in participation? Is the lack of participation the consequence of a rise in the reservation wage or a fall in the market wage? Does it reflect a mismatch of skills? Would retraining programs be an effective tool to bring more people back into the labor force?

Alan B Krueger pdf Alan B Krueger pdf

Must-Read: Andrew Gelman: That controversial claim that high genetic diversity, or low genetic diversity, is bad for the economy

Must-Read: Andrew Gelman (2013): That controversial claim that high genetic diversity, or low genetic diversity, is bad for the economy:

Quamrul Ashraf and Oded Galor, wrote a paper… [that] is pretty silly and I’m surprised it was accepted in such a top journal…

Economists can be credulous but I’d expect better from them when considering economic development, which is one of their central topics. Ashraf and Galor have, however, been somewhat lucky in their enemies, in that they’ve been attacked by a bunch of anthropologists who have criticized them on political as well as scientific grounds. This gives the pair of economists the scientific and even moral high ground, in that they can feel that, unlike their antagonists, they are the true scholars, the ones pursuing truth wherever it leads them, letting the chips fall where they may…. [But] the chips aren’t quite falling the way Ashraf and Galor think they are….

What went wrong, and how could Ashraf and Galor have done better? I think the way to go is to start with the big pattern they noticed: the most genetically diverse countries (according to their measure) are in east Africa, and they’re poor. The least genetically diverse countries are remote undeveloped places like Bolivia and are pretty poor. Industrialized countries are not so remote (thus they have some diversity) but they’re not filled with east Africans (thus they’re not extremely genetically diverse). From there, you can look at various subsets of the data and perform various side analysis….

Exploration won’t get you published in the American Economic Review. Instead of the explore-and-study paradigm, Ashraf and Galor are going with assert-and-defend. They make a very strong claim and keep banging on it…. I don’t think this lets you off the hook of having to think carefully about causal claims…. High-profile social science research aims for proof, not for understanding—and that’s a problem…. Incentives… favor silly causal claims…

Must-Read: Vitor Gaspar, Maurice Obstfeld, Ratna Sahay, et al.: Macroeconomic Management When Policy Space Is Constrained: A Comprehensive, Consistent, and Coordinated Approach to Economic Policy

Vitor Gaspar, Maurice Obstfeld, Ratna Sahay, et al.: Macroeconomic Management When Policy Space Is Constrained: A Comprehensive, Consistent, and Coordinated Approach to Economic Policy: “Global output remains below potential, unemployment above its natural rate, and inflation below target…

…Concern is widespread that countercyclical policies have run out of space or lack the power to raise growth or deal with the next negative shock. The common perceptions are that the effective lower bound on policy interest rates limits the room to loosen monetary conditions further and that high debt constrains fiscal policy, including automatic stabilizers….

This Staff Discussion Note argues that room exists for effective policies and that it should be used if appropriate… a comprehensive, consistent, and coordinated approach to policymaking….

Comprehensive policy… entails the mutually supportive use of the three policy prongs—monetary, fiscal, and structural—tailored to specific country circumstances…. Demand-management policies can support implementation of structural reforms that increase potential growth…. When monetary policy is constrained, fiscal policy provides support. Similarly, monetary policy accommodation prevents a crowding out of the expansionary fiscal response to a negative shock. Some countries have room for fiscal stimulus, especially in an environment of extremely low long-term interest rates. For others where room for fiscal maneuver is especially limited… better tailoring the pace of necessary fiscal adjustment and implementing growth-friendly fiscal rebalancing. Financial sector policies that strengthen banking systems and markets help improve the transmission of monetary policy and dampen shocks.

Consistent policy frameworks anchor long-term expectations while allowing decisive short- to medium-term accommodation whenever necessary. They do so by systematically linking instruments to policy objectives over time…. Monetary policy… allows effective stimulus, even when the policy interest rate is at its floor, in the form of a planned temporary overshoot of the inflation target. Fiscal policy must commit to managing public balance sheet risks…. Credible commitment and enduring practice of prudent management allow fiscal policy the flexibility to support economic activity when appropriate.

Finally, coordinated policies across major economies amplify the helpful effects of individual policy actions through positive cross-border spillovers…. Coordination of active monetary and fiscal policy adds particular value if the current policy approach falls short of reviving growth, or in the event of a further downward shock.

Weekend reading: “You’ve contracted out your reading links” edition

This is a weekly post we publish on Fridays with links to articles that touch on economic inequality and growth. The first section is a round-up of what Equitable Growth published this week and the second is the work we’re highlighting from elsewhere. We won’t be the first to share these articles, but we hope by taking a look back at the whole week, we can put them in context.

Equitable Growth round-up

In response to the Great Recession and the resulting weak job market, U.S. policymakers expanded the duration of unemployment insurance benefits many times. How much of an effect on employment did it have? Not much, according to a new paper.

This year’s Nobel Prize in economics was awarded to economists Oliver Hart of Harvard University and Bengt Holmström of the Massachusetts Institute of Technology for their work on the theory of contracts.

How much bigger can the U.S. labor force get? It’s one of the key questions for the U.S. economy these days. In thinking about it, policymakers need to understand that just because part of trend is structural doesn’t mean it’s immutable.

Links from around the web

“But what if it turns out that America isn’t as entrepreneurial as our leaders like to believe? And that the smaller U.S. safety net, which reflects a national belief in self-reliance, is one reason?” Danny Vinik at Politico writes about the role of downside risk in boost entrepreneurship. [the agenda]

Times should be sweet for pastry chefs as demand for their services have increased quite a bit in recent years. But wage growth hasn’t been that strong. Noam Scheiber takes a look at this particular labor market to see if it explains the broader trends in the U.S. labor market. [ny times]

Evidently one member of the Federal Open Markets Committee thinks low interest rates will make pension funds save more and thus reduce future economic growth. Alexandra Scaggs shows that this fear isn’t coming true. [ft alphaville]

“The rising share of income accruing to housing is a key feature of the changing U.S. income distribution,” writes Gianni La Cava of the Reserve Bank of Australia. “The rise occurred due to an increasing share of income accruing to owner-occupiers through imputed rent [and] it is concentrated in states that are constrained in terms of new housing supply.” La Cava writes up his research on this question and the connection to secular stagnation. [vox eu]

The drop in the value of pound sterling in foreign exchange markets has some observers thinking the currency depreciation will help rebalance the U.K. economy. Frances Coppola doesn’t find this argument very convincing, arguing that if not paired with policy reforms the “sterling’s fall will simply herald the dawning of a poorer, meaner future for Britain.” [coppola comment]

Friday figure

Figure from “The employment effects of a much higher U.S. federal minimum wage: Lessons from other rich countries” by David Howell

Must-Read: James Stock and Mark Watson: Why Has GDP Growth Been So Slow to Recover?

Must-Read: Stock and Watson look at growth rates and gaps between predicted and actual contributions to growth. I still think that my four-components graph conveys essentially the message more simply:

FRED Graph FRED St Louis Fed

Stock: Half the GDP recovery slowdown is demographic trend-driven. But any argument that work though weak private investment and weak private consumption does not track. The explanations are, instead. The federal sequester. Weak state and local spending. Weak foreign demand.

I agree with the “demographic/trends” part, and the government purchases part. But rather than weak foreign demand I see the failure of residential construction to bounce back to normal, somewhat offset by strong exports.

No. I haven’t yet figured out why their more complex cut at the data has this different emphasis:

James Stock and Mark Watson: Why Has GDP Growth Been So Slow to Recover?:

James h stock pdf James h stock pdf