Must-Read: Ross Douthat: Is Obamacare a Lifesaver?

Must-Read: The last, italicized, clause in the quote from Ross Douthat below is a lie:

Ross Douthat: Is Obamacare a Lifesaver?: “Now that the Republican Party has beclowned itself on health care… Obamacare repeal… in rubble…

…every G.O.P. policy person who ever championed a replacement plan is out wandering in sackcloth and ashes, wailing, “The liberals were right about my party, the liberals were right about my party,” beneath a harsh uncaring heaven… now, in these hours of right-wing self-abnegation, it’s worth raising once again the most counterintuitive and frequently scoffed-at point that conservatives have made about Obamacare:

It probably isn’t saving many lives.

One of the most powerful arguments in the litany that turned moderate Republican lawmakers to jelly was that they were voting to “make America sick again”…. Tens of thousands of people, Democrats warned, would die if Paul Ryan’s stingy replacement took its place…. This argument was still most likely false….. The link between health insurance and actual health has always been a lot murkier than most champions of universal coverage admit… little evidence that giving people insurance actually makes them healthier. Recent data… is mixed: A study of Mitt Romney’s Massachusetts insurance expansion showed health benefits for the newly insured… but a study of Oregon’s pre-Obamacare Medicaid expansion found that the recipients’ physical health did not improve

Look at this summary table from the Oregon Medicaid Study:

Oregon Medicaid Study Summary Table
  1. The bottom red circle tells us: relative to the control group, an extra 5% of those who won the Medicaid lottery are taking diabetes meds.

  2. The top red circle tells us: relative to the control group, 1% fewer of the “got Medicaid” group have elevated blood glucose levels.

12% rather than 6% being treated for diabetes; 4% rather than 5% with high glucose levels. Both treatment likelihood and health indicators are better for the “got Medicaid” group.

That is a clinically-significant improvement in the health of the population that got on Medicaid: for first-line anti-diabetes drugs to knock about 1/5 of those with the diagnosis back into the normal range is what you would expect.

The problem is the sample size: only 6000. In a population that small, statistical noise means that you could not reject the hypothesis that the effect was four times as large–that the drugs knocked 4% of the “got Medicaid” group into the healthy range. But also if you started out believing that diabetes drugs were counterproductive—that they caused blood glucose levels to increase—you could not reject that hypothesis either.

The proper way to describe this is that while the effects on emotional health and financial stability were as expected clinically and were statistically significant, the effects on blood glucose (and hypertension, and high cholesterol) were as expected clinically but were not statistically significant.

If Douthat had said that the improvements in physical health were not statistically significant, I would accuse him of misleading his audience by not also noting that the improvements in physical health were in line with clinical expectations for treatment success.

But Douthat claims, instead, that: “a study of Oregon’s pre-Obamacare Medicaid expansion found that the recipients’ physical health did not improve”. That is simply a lie. I don’t know whether he is knowingly or unknowingly spreading this lie. But his ultimate source for the claim was looking at this table. And lied.

Is it too much to ask the New York Times to at least pretend to care about quality control here?

Sluggish Future: No Longer Fresh Over at Finance and Development

Secular Stagnation

Over at Finance and Development: Sluggish Future: You are reading this because of the long, steady decline in nominal and real interest rates on all kinds of safe investments, such as US Treasury securities. The decline has created a world in which, as economist Alvin Hansen put it when he saw a similar situation in 1938, we see “sick recoveries… die in their infancy and depressions… feed on themselves and leave a hard and seemingly immovable core of unemployment…” In other words, a world of secular stagnation. Harvard Professor Kenneth Rogoff thinks this is a passing phase—that nobody will talk about secular stagnation in nine years. Perhaps. But the balance of probabilities is the other way. Financial markets do not expect this problem to go away for at least a generation… Read MOAR at Finance and Development


My Draft: You are reading this right now because of the long, steady decline in safe interest rates at all maturities since 1990.(1)

In the United States, we have seen declines in short-term safe interest rates from 4% to -1.2% on the real side and from 8% to 0.5% on the nominal side. And we have seen the decline in long-term safe interest rates from 5% to 1% on the real side, and from 9% to 3% on the nominal side. The elusive Wicksellian “neutral” rate of interest—that rate at which planned investment equals desired full-employment savings—has fallen by more: the economy in 1990 had no pronounced tendency to fall short of full employment; the economy today has.

An economy suffers from “secular stagnation” when the average level of safe nominal interest rates is low and so crashes the economy into the zero lower bound with frequency. Thus, in the words of Alvin Hansen (1939): “sick recoveries… die in their infancy and depressions… feed on themselves and leave a hard and seemingly immovable core of unemployment…”(2)

Financial markets, at least, do not expect this problem to go away for at least as generation. That makes, as I have written, this current policy debate “the most important policy-relevant debate in economics since John Maynard Keynes’s debate with himself in the 1930s…”

I have heard eight different possible causes advanced for this secular fall in safe interest rates:

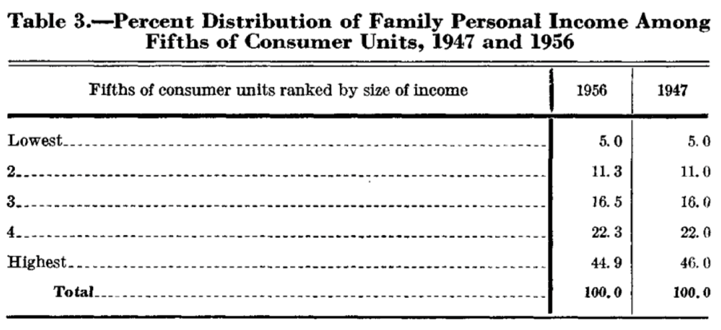
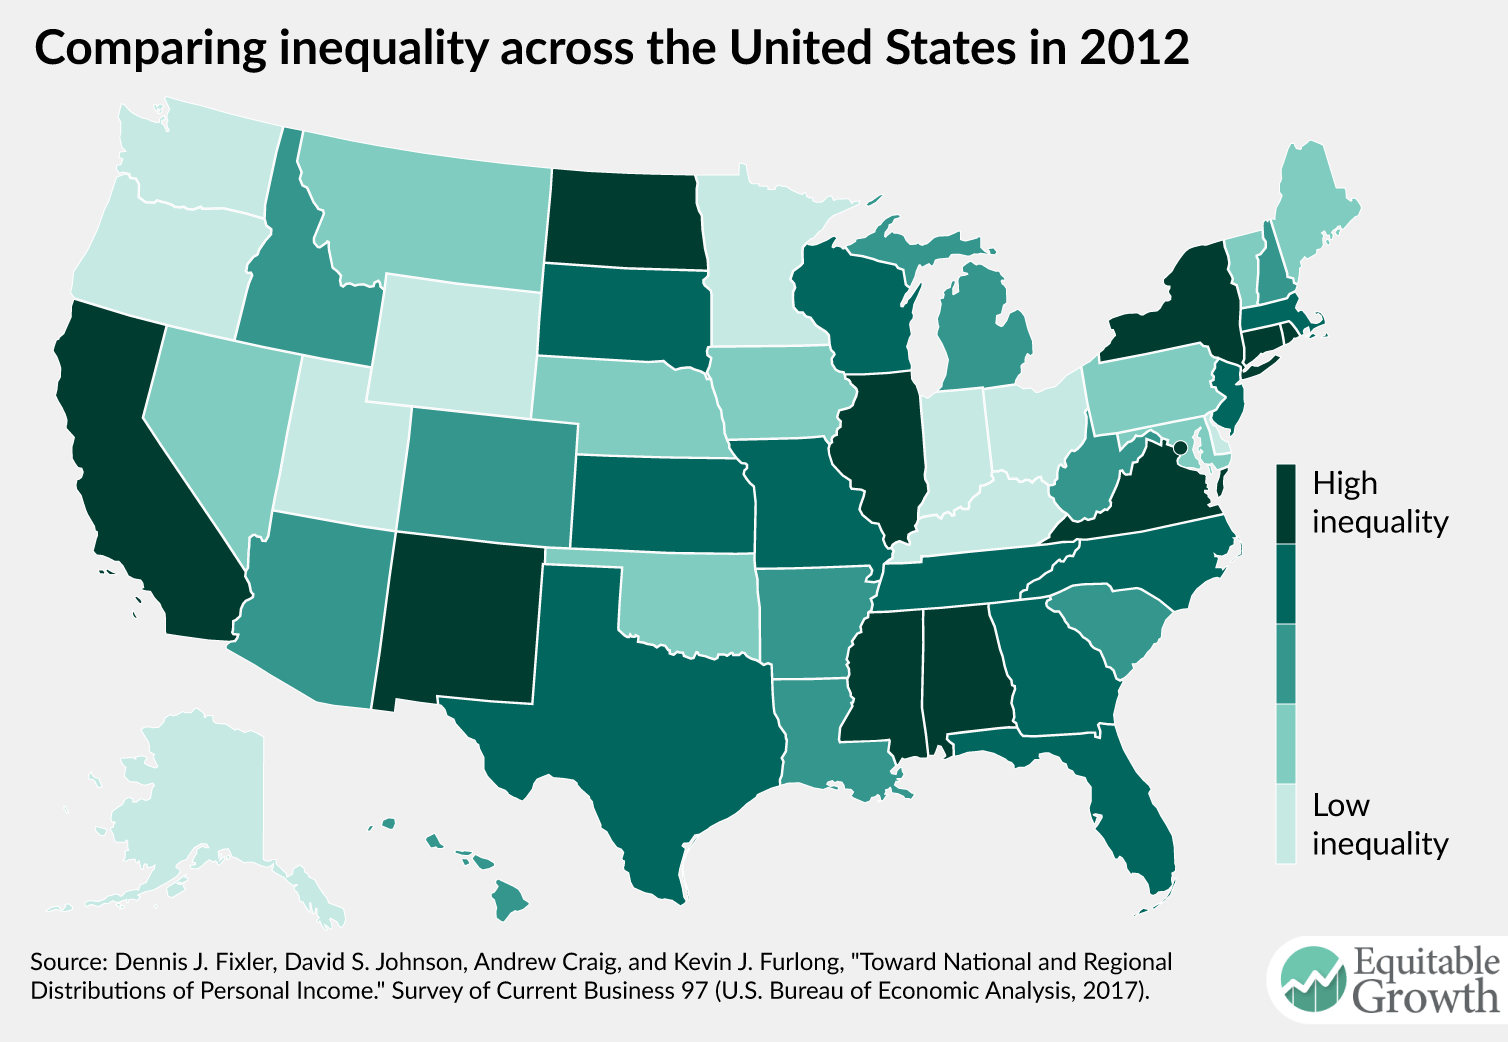
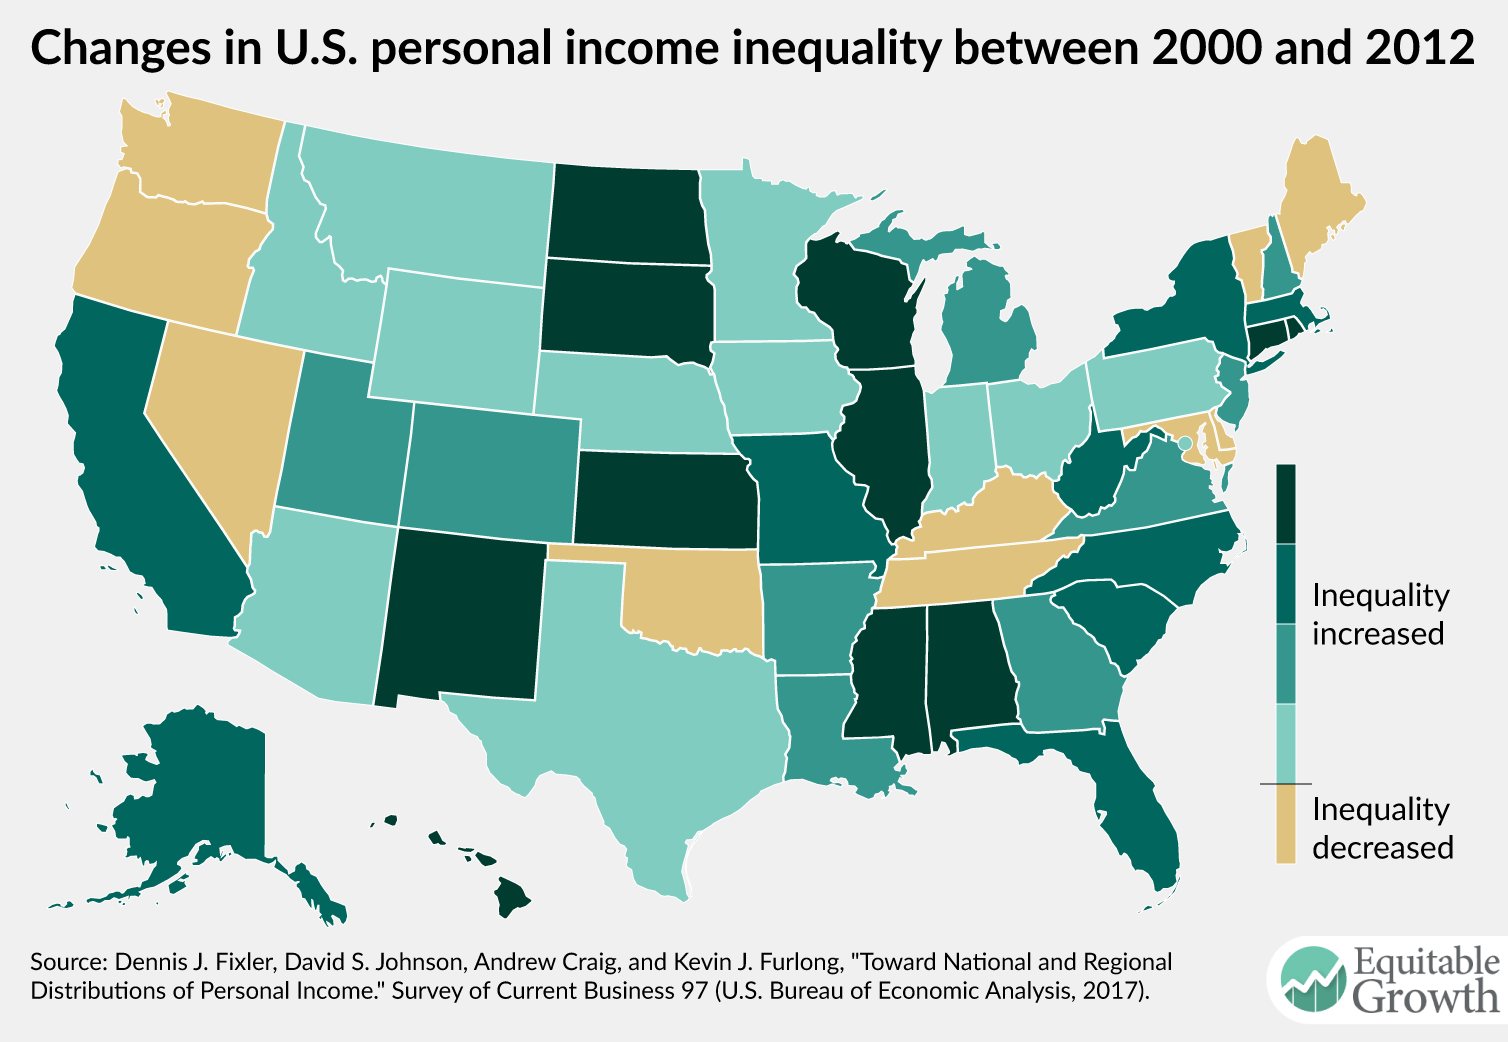
  1. High income inequality, which boosts savings too much because the rich can’t think of other things they’d rather do with their money.
  2. Technological and demographic stagnation that lowers the return on investment and pushes desired investment spending down too far.
  3. Non-market actors whose strong demand for safe, liquid assets is driven not by assessments of market risk and return but rather by political factors or by political risk.
  4. A collapse or risk-bearing capacity as a broken financial sector finds itself overleveraged and failing to mobilize savings, thus driving a large wedge between the returns on risky investments and the returns on safe government debt.
  5. Very low actual and expected inflation, which means that even a zero safe nominal rate of interest is too high to balance desired investment and planned savings at full employment.
  6. Limits on the demand for investment goods coupled with rapid declines in the prices of those goods, which together put too much downward pressure on the potential profitability of the investment-goods sector.
  7. Technological inappropriateness, in which markets cannot figure out how to properly reward those who invest in new technologies even when the technologies have enormous social returns—which in turn lowers the private rate of return on investment and pushes desired investment spending down too far.
  8. Increased technology- and rent seeking-driven obstacles to competition which make investment unprofitable for entrants and market-cannibalizing for incumbents.

The first of these was John A. Hobson’s explanation a century ago for the economic distress that had led to the rise of imperialism.(3) The second was, of course, Hansen’s, echoed today by Robert Gordon.(4) The third is Ben Bernanke’s global savings glut.(5) The fourth is Ken Rogoff’s debt-supercycle.(6)

The fifth notes that, while safe real interest rates are higher than they were in the 1980s and 1990s, that is not the case for the 1960s and 1970s. It thus attributes the problem to central banks’ inability to generate the boost from expected and actual inflation a full-employment flex-price economy would generate naturally.(7)

(6), (7), and (8) have always seemed to me to be equally plausible as potential additional factors. But the lack of communication between industrial organization and monetary economics has deprived them of scrutiny. While Gordon, Bernanke, Rogoff, Krugman, and many others have covered (1) through (5), (6), (7), and (8) remain undertheorized.

In general, economists have focused on a single individual one of these causes, and either advocated policies to cure it at its roots or waiting until the evolution of the market and the polity removes it. By contrast, Lawrence Summers(8) has focused on the common outcome. And if one seeks not to cure a single root cause but rather to neutralize and palliate the deleterious macroeconomic effects of a number of causes working together, one is driven—as Larry has been—back to John Maynard Keynes (1936)(9):

A somewhat comprehensive socialisation of investment… [seems] the only means of securing an approximation to full employment… not exclud[ing] all manner of compromises and of devices by which public authority will cooperate with private initiative…

Summers has, I think, a very strong case here. Ken Rogoff likes to say that nine years from now nobody will be talking about secular stagnation.

Perhaps.

But if that is so, it will most likely be so because we will have done something about it.


Notes:

(1) For considerably overlapping and much extended versions of this argument, see J. Bradford DeLong (2016): Three, Four… Many Secular Stagnations! http://www.bradford-delong.com/2017/01/three-four-many-secular-stagnations.html; (2015): The Scary Debate Over Secular Stagnation: Hiccup… or Endgame? Milken Review http://tinyurl.com/dl20170106m

(2) Alvin Hansen (1939): Economic Progress and Declining Population Growth American Economic Review https://www.jstor.org/stable/1806983

(3) John A. Hobson (1902): Imperialism: A Study (New York: James Pott) http://files.libertyfund.org/files/127/0052_Bk.pdf

(4) Robert Gordon (2016): The Rise and Fall of American Growth http://amzn.to/2iVbYKm

(5) Ben Bernanke (2005): The Global Saving Glut and the U.S. Current Account Deficit http://www.federalreserve.gov/boarddocs/speeches/2005/200503102/

(6) Kenneth Rogoff (2015): Debt Supercycle, Not Secular Stagnation http://www.voxeu.org/article/debt-supercycle-not-secular-stagnation

(7) Paul Krugman (1998): The Return of Depression Economics http://tinyurl.com/dl20170106r

(8) Lawrence Summers (2013): Secular Stagnation http://larrysummers.com/imf-fourteenth-annual-research-conference-in-honor-of-stanley-fischer/ ; https://www.youtube.com/watch?v=KYpVzBbQIX0&ab_channel=JamesDecker; (2014): U.S. Economic Prospects: Secular Stagnation, Hysteresis, and the Zero Lower Bound http://link.springer.com/article/10.1057%2Fbe.2014.13; (2015): Rethinking Secular Stagnation After Seventeen Months http://larrysummers.com/wp-content/uploads/2015/07/IMF_Rethinking-Macro_Down-in-the-Trenches-April-20151.pdf;(2016): The Age of Secular Stagnation http://larrysummers.com/2016/02/17/the-age-of-secular-stagnation/

(9) John Maynard Keynes (1936): The General Theory of Employment, Interest and Money https://www.marxists.org/reference/subject/economics/keynes/general-theory/ch24.htm


This File: http://www.bradford-delong.com/2017/04/sluggish-future-no-longer-fresh-over-at-finance-and-development.html

Edit This File: http://www.typepad.com/site/blogs/6a00e551f08003883400e551f080068834/post/6a00e551f08003883401b7c8db1dcc970b/edit

Pages: https://www.icloud.com/pages/0FTAYBVrR3N8H4mtJ8FqbDMiQ#2017-01-09_Sec_Stag_for_F.D_.6x812pt

The once and future measurement of economic inequality in the United States

A man drives a golf cart from his house to his golf club as a group of landscape workers take a break in Vista, California.

A slew of research into economic inequality replete with serious looking graphs may give the impression that measuring inequality in the United States is a solved problem. This is misleading. Inequality is still measured incompletely because existing U.S. government statistics do not attempt to match their estimates to the National Income and Product Accounts. NIPA is the source of the most reported and well-understood economic statistics such as the nation’s Gross Domestic Product and quarterly GDP growth figures.

Because existing estimates of economic inequality are not pegged to NIPA, they don’t account for all sources of income. They may exclude, for example, fringe benefits provided by employers such as employer-provided health insurance and retirement benefits, government transfers such as supplemental nutrition assistance or the child tax credit, government services such as public education, and tax expenditures such as the home mortgage tax deduction and tax breaks for employer-provided insurance. These exclusions, big and small, make many existing estimates of inequality fundamentally incomparable to our most well-established measures of economic growth.

This wasn’t always the case. The Office of Business Economics—the precursor to the U.S. Department of Commerce’s Bureau of Economic Analysis—compiled inequality data decades ago, starting in 1947 and ending in 1971. These estimates were relatively simple: They divided households into five quintiles and reported the accumulated income of each quintile. The bottom 20 percent of households, for example, held 5 percent of all personal income in 1956, while the top 20 percent held 44.9 percent of all personal income. (See Figure 1.)

Figure 1

Inequality remained fairly stable during this period. Because economic prosperity was broadly shared from the end of World War II until the early 1970s, the distribution of income rarely changed. As one researcher noted, “the relative distribution of income has remained virtually constant over the post-war period.” Unfortunately, these estimates were discontinued due to a lack of resources at an inopportune time: Income inequality would increase slowly starting in the 1970s and more rapidly in the succeeding decades.

Today, with inequality increasing, there is rekindled interest within the Bureau of Economic Analysis in measuring inequality alongside growth. A new paper in the BEA’s Survey of Current Business attempts to reconstruct measures of inequality that are pegged to NIPA, similar to those compiled in the middle of the 20th century. The team of current and former government economists—Dennis Fixler at the BEA, David Johnson at the University of Michigan, and Andrew Craig and Kevin Furlong at the BEA—merge the Current Population Survey and the Consumer Expenditure Survey to construct estimates of income for each quintile of the U.S. population between 2000 and 2012.

They find that the top 20 percent now hold about 52 percent of all personal income. Moreover, the paper moves beyond the BEA’s older efforts in key ways. The authors provide estimates of inequality for regions of the United States and for each state individually, as well as the change in inequality between 2000 and 2012. (See Figures 2 and 3.)

Figure 2

Figure 3

In the paper, “Toward National and Regional Distributions of Personal Income,” the four authors also decompose personal income by category, showing how Social Security income, Medicare benefits, and more are shared by each quintile of the income distribution. They find, for example, that 86 percent of all dividend income flows to the top 20 percent of U.S. households, highlighting the near-monopoly that upper-class households have over financial assets.

There are limits to what can be done with the tools that are currently available. Respondents to the surveys under- and over-report income, for example. Some components of income are missing entirely and must be estimated based on what clues are available. The two surveys used are linked using a procedure that introduces some error into the estimates. Other estimates of inequality show that it is important to break out the top 10 percent of income earners or even the top 1 percent of earners, and these groups are not addressed in this paper.

Another approach, by Thomas Piketty at the Paris School of Economics and University of California, Berkeley economists Emmanuel Saez and Gabriel Zucman, uses tax data to look at very high earners, showing that the top 1 percent and even the top 0.1 percent have been the foremost beneficiaries of recent increases in inequality. Ultimately, better surveys and more interagency access to U.S. government administrative data is necessary to address the challenges of providing better inequality statistics.

The ability to look at the geographic distribution of inequality and at slices of income within different income groups teases the possibilities of a more robust project to disaggregate the National Income and Product Accounts statistics that are currently the most referenced statistics of economic progress in the nation. Devoting federal resources to the project could allow us to track inequality not only by income bands, but also by age, geographic location, gender, ethnicity, and type of income.

Must- and Should-Reads: March 29, 2017


Interesting Reads:

Must-Read: Noah Smith: The Blogs vs. Case-Deaton

Noahpinion The blogs vs Case Deaton

Must-Read: Noah Smith: The Blogs vs. Case-Deaton: “Selection effects are very real…

…But as Zumbrun points out, once you lump all white Americans together-which totally eliminates the education selection effect-the mortality increase remains. Just look at this graph from the 2015 paper…. So why are people tripping over themselves to launch attacks on Case & Deaton? It’s pretty obviously politics… excerpts from [Malcolm] Harris…. The critiques of Case-Deaton are overdone. Maybe they should have focused less on disaggregating by education, and more on disaggregating by gender, age, and region. But those are quibbles. The main results are real and important.

Interview: The Politics Guys

Brad DeLong: Interview: The Politics Guys: “Economic inequality, economic growth, why this is the best time ever to be poor (in the United States, at least)…

…grifters and suckers, alien sinister forces, McDonalds, restaurant gift cards, how the best con artists are those who can con themselves, and lots more….

Mike talks to UC Berkeley economist Brad DeLong. Professor DeLong, who served as Deputy Assistant Secretary of the Treasury in the Clinton administration, blogs at ‘Grasping Reality….

It’s about politics. It’s about ideas. It’s about half an hour.

Must-Read: Michael T. Kiley and John M. Roberts: Monetary policy in a Low Interest Rate World

Must-Read: Back in 1992 Larry Summers and I warned that, *even with business cycles of the size seen in the “Great Moderation” era, trying to reduce inflation much below 5%/year was a risky and dangerous endeavor. Since they we have learned that the world can give us—from causes that seem trivial as a share of world asset stocks—shocks much larger than was thought reasonable in the “Great Moderation” era, plus we have had a very sharp and apparently permanent fall in real interest rates. That has changed the 2%/year inflation target from being risky and dangerous to being… simply not sane…

Michael T. Kiley and John M. Roberts: Monetary policy in a Low Interest Rate World: “Nominal interest rates may remain substantially below the averages of the last half-century…

…Persistently low nominal interest rates may lead to more frequent and costly episodes at the effective lower bound (ELB) on nominal interest rates…. Monetary policy strategies based on traditional simple policy rules lead to poor economic performance when the equilibrium real interest rate is low, with economic activity and inflation more volatile and systematically falling short of desirable levels. Moreover, the frequency and length of ELB episodes under such policy approaches is estimated to be significantly higher…. A risk-adjustment to a simple rule in which monetary policymakers are more accommodative, on average, than prescribed by the rule ensures that inflation averages its 2 percent objective–and requires that policymakers systematically seek inflation near 3 percent when the ELB is not binding…. Commitment strategies in which monetary accommodation is not removed until either inflation or economic activity overshoot their long-run objectives are very effective in both the DSGE and FRB/US model. Finally, raising the inflation target above 2 percent can mitigate the deterioration in economic performance…

Must-Read: Thomas Piketty, Emmanuel Saez, and Gabriel Zucman: Economic growth in the US: A Tale of Two Countries

Must-Read: It’s not robots or technology or trade: it’s policy that has caused U.S. income stagnation over the past one and a half generations. Making America much less egalitarian in the economic sphere is what Reagan and his coalition said they wanted to do. And, lo, they have done it. It did not have to be this way:

Economic growth in the US A tale of two countries VOX CEPR s Policy Portal

Thomas Piketty, Emmanuel Saez, and Gabriel Zucman: Economic growth in the US: A Tale of Two Countries: “Given the generation-long stagnation of the pre-tax incomes among the bottom 50% of wage earners in the US…

…policy discussion… should focus on how to equalise the distribution of human capital, financial capital, and bargaining power rather than merely the redistribution of national income after taxes. Policies that could raise the pre-tax incomes of the bottom 50% of income earners could include:

  • Improved education and access to skills, which may require major changes in the system of education finance and admission;
  • Reforms of labour market institutions to boost workers’ bargaining power and including a higher minimum wage;
  • Corporate governance reforms and worker co-determination of the distribution of profits; and
  • Steeply progressive taxation that affects the determination of pay and salaries and the pre-tax distribution of income, particularly at the top end.

The different levels of government in the US today obviously have the power to make income distribution more unequal, but they also have the power to make economic growth in the US more equitable again. Potentially pro-growth economic policies should always be discussed alongside their consequences for the distribution of national income and concrete ways to mitigate their unequalising effects. We hope that the distributional national accounts we present today can prove to be useful for such policy evaluations…

Must-Read: Ronald Klain (2016): It’s a Trap!

Must-Read: I very much wish it were otherwise—I wish Trump or somebody in his immediate entourage were behind a serious infrastructure economic stimulus and public investment program. It would be good for the country. (It would be good for Trump.)

But nobody is:

Ronald Klain (2016): It’s a Trap!: “President-elect Donald Trump’s infrastructure plan: Don’t do it. It’s a trap…

…Backing Trump’s plan is a mistake in policy and political judgment… [was was voting] for Ronald Reagan’s tax cuts in 1981 and George W. Bush’s cuts in 2001…. Trump’s plan is not really an infrastructure plan. It’s a tax-cut plan for utility-industry and construction-sector investors, and a massive corporate welfare plan for contractors…. Trump’s plan provides tax breaks to private-sector investors who back profitable construction projects…. There’s no requirement that the tax breaks be used for incremental or otherwise expanded construction efforts…. Moreover… desperately needed infrastructure projects that are not attractive to private investors—municipal water-system overhauls, repairs of existing roads, replacement of bridges that do not charge tolls — get no help from Trump’s plan. And contractors? Well, they get a “10 percent pretax profit margin,” according to the plan. Combined with Trump’s sweeping business tax break, this would represent a stunning $85 billion after-tax profit for contractors—underwritten by the taxpayers….

As a result… Trump’s plan isn’t really a jobs plan…. Because the plan subsidizes investors, not projects; because it funds tax breaks, not bridges; because there’s no requirement that the projects be otherwise unfunded, there is simply no guarantee that the plan will produce any net new hiring. Investors may simply shift capital from unsubsidized projects to subsidized ones…

Must-Read: Stephen Cecchetti and Kim Schoenholtz: The Fed’s Price Stability Achievement

Must-Read: Ummmm… No. The Federal Reserve’s inflation policy has been not an achievement but a mistake. Driving expectations of inflation so low that the economy spends half its time in a liquidity trap—as has been the case so far this millennium—is a substantial policy error, not an achievement.

As John Maynard Keynes wrote back in 1923:

Inflation is unjust and Deflation is inexpedient. Of the two perhaps Deflation is, if we rule out exaggerated inflations such as that of Germany, the worse; because it is worse, in an impoverished world, to provoke unemployment than to disappoint the rentier. But it is not necessary that we should weigh one evil against the other. It is easier to agree that both are evils to be shunned…

“Achievement” is balance. “Achievement” is not falling out of balance to one side or the other:

Stephen Cecchetti and Kim Schoenholtz: The Fed’s Price Stability Achievement: “US monetary policy has been the target of substantial criticism over the years…

…This column outlines one key area where the Federal Reserve has done remarkably well–managing price stability.  Its ability to control inflation is a key reason that, for the sake of the US and global economies, the Fed’s independence should be preserved.