Many countries have experienced both a slowdown in aggregate productivity growth and a decline in labor’s share of national income in recent years. This column argues that the productivity slowdown may have caused the decline in labor’s income. Calibrating the authors’ model to US data suggests that a one percentage point decline in the productivity growth rate accounts for between half and all of the observed decline in the US labor share.
(Editors’ note: This column first appeared on the VoxEU website. Reproduced with permission.)
In recent years, many countries, including the US, have experienced both a slowdown in aggregate productivity growth and a decline in labour’s share of national income (Elsby et al. 2013, Fernald 2014, Karabarbounis and Neiman 2014). The existence, timing, and magnitude of these changes is the subject of an ongoing and important empirical debate. However, beginning by at least 2000, and probably earlier, the US labour share seems to have fallen by five or six percentage points. Meanwhile, Gordon (2010, 2012, 2016) argues that annual total factor productivity growth in the US has been one percentage point slower since the 1970s compared to the preceding decades.
Suggested explanations for the decline in labour’s income share include capital accumulation (Karabarbounis and Neiman 2014, Piketty 2014), automation of tasks previously performed by labour (Acemoglu and Restrepo 2016) and the rise of superstar firms (Autor et al. 2017, Kehrig and Vincent 2017). In a recent paper, we propose a new explanation – the productivity slowdown may have caused the decline in labour’s income share (Grossman et al. 2017a). We show that in a neoclassical growth model with endogenous human capital (Ben Porath 1967) and capital-skill complementarity (Grossman et al. 2017b), the labour share is increasing in the rate of technical change. Calibrating our model to US data implies that a one percentage point decline in the productivity growth rate can account for between one half and all of the observed decline in the US labour share.
A theory of labour’s income share
To understand the determinants of labour’s share of income, we extend the neoclassical growth model by allowing for endogenous human capital accumulation. Each individual’s output depends not only on their labour supply and how much capital they work with, but also on their human capital. Individuals accumulate human capital through schooling and divide their time between working and learning in order to maximise expected lifetime income (Ben Porath 1967).
Consistent with empirical evidence, we also assume the production technology features complementarity between physical and human capital, an elasticity of substitution between physical capital and raw labour less than one, and exogenous technical change that takes both capital-augmenting and labour-augmenting forms. As in Grossman et al. (2017b), we model capital-skill complementarity by assuming that human capital is akin to capital-using technical progress.
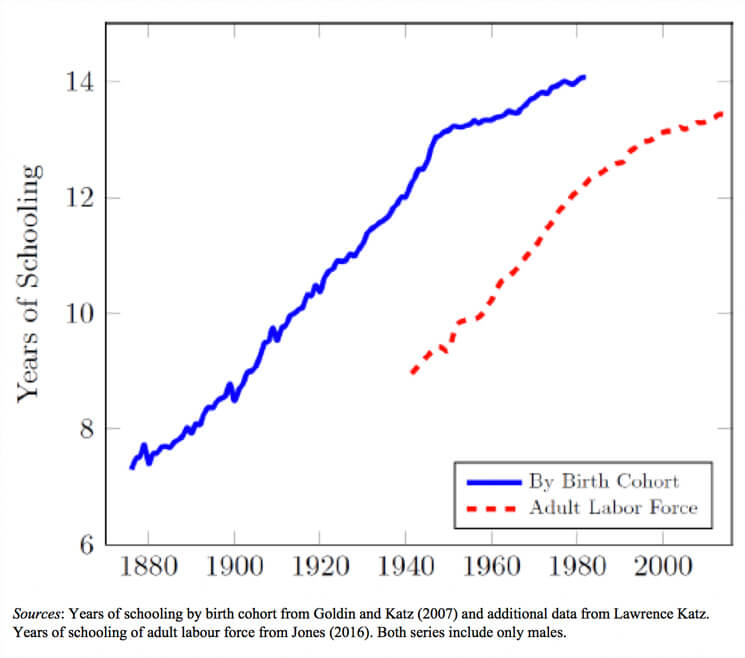
In this setting, capital accumulation raises labour’s income share, holding the supply of skill constant, because the elasticity of substitution is below one. However, as the capital stock grows, the existence of capital-skill complementarity means that workers choose to accumulate more human capital and this effect tends to reduce labour’s income share. For a class of production functions identified in Grossman et al. (2017b), these effects exactly offset one another and the economy has a unique balanced growth path along which labour’s income share is constant. On the balanced growth path, educational attainment rises steadily over time, in keeping with the US experience for much of the 20th century (Figure 1).
Figure 1 US education by birth cohort and among adult labour force
The main outcome of interest is labour’s steady state income share. In the empirically relevant case where the intertemporal elasticity of substitution is less than one, we find that a decline in the rate of either capital-augmenting or labour-augmenting technical progress reduces labour’s income share. Thus, a productivity slowdown induces a decline in the labour share. The mechanism operates through optimal schooling choices. Slower growth reduces the real interest rate, leading individuals to raise their targeted human capital for any given level of the effective capital stock. Since skills are capital-using, this change is equivalent to a reduction in the capital-labour ratio, which redistributes national income toward capital when the elasticity of substitution between capital and labour is less than one.
A productivity slowdown also reduces the rate at which educational attainment increases, but only if it results from a decline in capital-augmenting (not labour-augmenting) technical progress. Figure 1 shows that the increase in schooling in the US slowed for cohorts born after around 1950.
To understand the novelty of these findings, we can compare our results with the canonical neoclassical theory of the functional distribution of income dating back to Hicks (1932) and Robinson (1933). In the canonical approach, where aggregate output is a constant returns to scale function of capital and labour, variation in the labour share results from changes in the capital-labour ratio or in the bias of factor augmenting technologies. If the capital-labour elasticity of substitution is below one, as most empirical evidence suggests (Oberfield and Raval 2014), either an increase in the capital-labour ratio or an improvement in the capital-augmenting technology would raise the labour share.
By contrast, according to our model it is not the levels of technology parameters that determine the labour share, but the rate of technical progress. Moreover, the factor bias of technical progress does not play a critical role in our story. Both a fall in the rate of labour-augmenting technical change and a fall in the rate of capital-augmenting technical change cause a decline in the steady state labour share, because both have qualitatively similar effects on targeted human capital levels.
Quantifying the consequences of a productivity slowdown
How large is the change in labour’s income share resulting from a slowdown in productivity growth? We address this question by calibrating our model to the postwar US economy and simulating a reduction in technical progress that results in a one percentage point per year fall in labour productivity growth. All but one of the parameters can be pinned down using standard data moments such as the capital share, the internal rate of return on schooling, and the growth of labour productivity and years of schooling prior to the shock.
The remaining parameter controls the degree of capital-skill complementarity. To calibrate this parameter, we try two approaches. First, we make ad-hoc assumptions about the bias of technical change. Second, we estimate the parameter structurally using variation in labour shares and average wage growth rates across US states and industries. In all the cases we consider, a one percentage point decline in the labour productivity growth rate reduces labour’s income share by at least 1.5 percentage points. For our preferred specification, the labour share declines by 4.6 percentage points if the slowdown results from lower labour-augmenting technical progress and 5.9 percentage points if slower growth in capital-augmenting technology is responsible.
Conclusions
Our work identifies a new mechanism behind changes in labour’s income share. Moreover, calibrating the model shows that the recent productivity slowdown may be quantitatively important in explaining the redistribution of income from labour to capital.
To conclude, we mention two additional attractive features of our story. First, it does not rely on factors that are specific to the US experience, but instead is consistent with evidence of a global productivity slowdown and a decline in the labour share worldwide. Second, although we focus on recent trends in productivity and the labour share, there is some evidence that similar correlations hold over much longer time periods (Growiec et al. 2016). It is possible that productivity growth and the functional distribution of income have been linked for quite some time.
References
Acemoglu, D and P Restrepo (2016), “The Race between Machine and Man: Implications of Technology for Growth, Factor Shares, and Employment”, NBER Working Paper No. 22252.
Autor, D, D Dorn, L Katz, C Patterson and J Van Reenen (2017), “The Fall of the Labor Share and the Rise of Superstar Firms”, mimeo MIT.
Ben Porath, Y (1967), “The Production of Human Capital and the Life Cycle of Earnings”, Journal of Political Economy 75(4, Pt. I): 352-65.
Elsby, M W L, B Hobijn and A Sahin (2013), “The Decline of the U.S. Labor Share”, Brookings Papers on Economic Activity 47(2): 1-63.
Fernald, J G (2014), “Productivity and Potential Output Before, During, and After the Great Recession”, Federal Reserve Bank of San Francisco Working Paper 2014-15.
Goldin, C and L F Katz (2007), “Long-Run Changes in the Wage Structure: Narrowing, Widening, and Polarization”, Brookings Papers on Economic Activity 38(2): 135-68.
Gordon, R J (2010), “Revisiting U.S. Productivity Growth over the Past Century with a View of the Future”, NBER Working Paper No. 15834.
Gordon, R J (2012), “Is U.S. Growth Over? Faltering Innovation and the Six Headwinds”, NBER Working Paper No. 18315.
Gordon, R J (2016), The Rise and Fall of American Growth: The U.S. Standard of Living Since the Civil War, Princeton: Princeton University Press.
Grossman, G M, E Helpman, E Oberfield and T Sampson (2017a), “The Productivity Slowdown and the Declining Labor Share: A Neoclassical Exploration”, CEPR Discussion Paper 12342.
Grossman, G M, E Helpman, E Oberfield and T Sampson (2017b), “Balanced Growth despite Uzawa”, American Economic Review 107(4): 1293-1312.
Growiec, J, J Muck and P McAdam (2016), “Endogenous Labor Share Cycles: Theory and Evidence”, SGH KAE Working Paper No. 2016/0015.
Hicks, J R (1932), The Theory of Wages, London: Macmillan.
Jones, C I (2016), “The Facts of Economic Growth”, in J B Taylor and H Uhlig (eds), Handbook of Macroeconomics, vol 2A, Amsterdam: Elsevier.
Karabarbounis, L and B Neiman (2014), “The Global Decline of the Labor Share”, Quarterly Journal of Economics 129(1): 61-103.
Kehrig, M and N Vincent (2017), “Growing Productivity without Growing Wages: The Micro-Level Anatomy of the Aggregate Labor Share”, Economic Research Initiatives at Duke Working Paper No. 244.
Oberfield, E and D Raval (2014), “Micro Data and Macro Technology”, NBER Working Paper No. 20452.
Piketty, T (2014), Capital in the Twenty-First Century, Cambridge, MA: Harvard University Press.
Robinson, J (1933), The Economics of Imperfect Competition, London: Macmillan.