New financial health survey shows that traditional metrics of economic growth don’t apply to most U.S. households’ incomes and savings

Headlines regarding the state of the U.S. economy often tout statistics that indicate robust economic expansion and a booming stock market. High Gross Domestic Product growth rates and low unemployment rates are important, but these single aggregate data points do not capture how economic growth is experienced by different people in very different ways. Similarly, a galloping stock market does not benefit all that many people because a majority of the population doesn’t own stocks.
Underscoring the importance of knowing who specifically benefits from a strong economy is a new survey by the Center for Financial Services Innovation, “U.S. Financial Health Pulse: 2018 Baseline Survey,” which takes aim at addressing this information deficit by disaggregating the data collected on U.S. households’ financial health and preparedness. The survey contains metrics that explain how the current economic expansion is being felt by various socioeconomic and demographic groups.
The Center, in collaboration with researchers at the University of Southern California’s Dornsife Center for Economic and Social Research, circulated the baseline survey to members of the university’s “Understanding America” study, which recruits participants using address-based sampling. Of the 6,161 panelists invited, 5,109 completed the survey, and 5,019 respondents were used to create the baseline survey sample. Questions asked revolved around the financial behavior of the respondents’ households, though the survey also collected the demographic data of individual respondents.
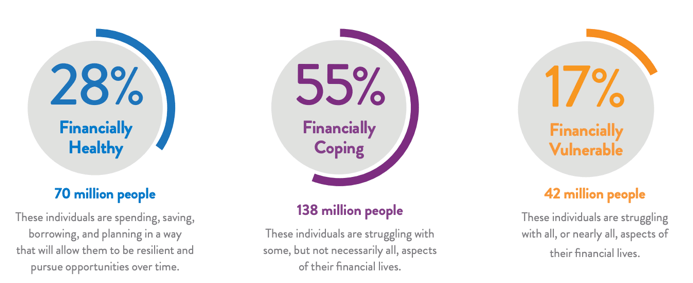
Their first survey, released last month, found that of the approximately 5,100 respondents, 55 percent are financially coping and 17 percent are financially vulnerable. Those in the “financially vulnerable” group are individuals “struggling with all, or nearly all, aspects of their financial lives,” while their counterparts in the “financially coping” category are those “struggling with some, but not necessarily all, aspects of their financial lives.” (See Figure 1, pulled from the report.)
Figure 1

The financial health of individuals naturally depends in part on their income. Roughly 36 percent of respondents with a household income of $30,000 or less are financially vulnerable, compared to just 20 percent of respondents with household incomes between $30,000 and 60,000. But there are a variety of other factors that affect financial health. The study shows that 78 percent of respondents between the ages of 18 and 25 are financially coping, while 13 percent are vulnerable. But for those between the ages of 26 and 35 who responded to the survey, 57 percent are financially coping, while 19 percent are financially vulnerable.
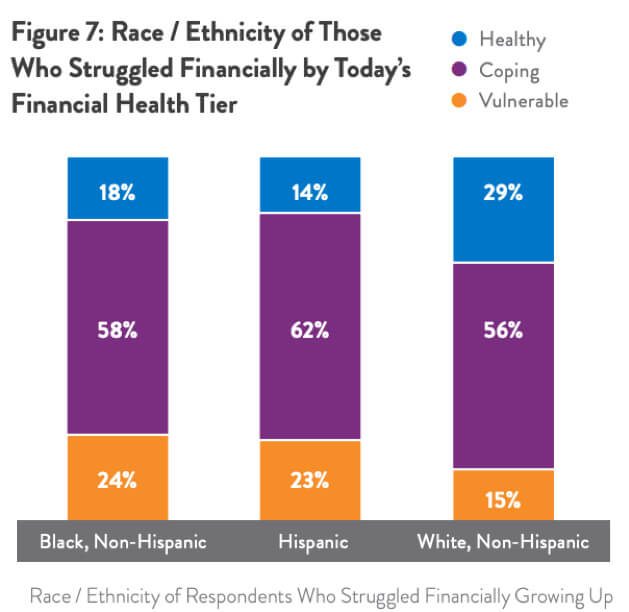
The results also address economic outcomes by race and ethnicity. The survey finds that 68 percent of Native Americans, regardless of income, are financially coping and 24 percent are financially vulnerable. Similarly, 58 percent of African Americans are coping, while 24 percent are vulnerable. These percentages drop for white, non-Hispanic respondents, where 52 percent are coping and only 15 percent are vulnerable. (See Figure 2, pulled from the report).
Figure 2

Respondents to the survey were more likely to be financially vulnerable if they were less well-educated. Thirty percent of respondents with less than a high school degree are financially vulnerable, but only 7 percent of those with a bachelor’s degree fall into this category.
Poor financial health in a good economy can have effects on the ability of individuals to save in preparation for emergencies or negative income shocks. The survey suggests that many Americans are shockingly unprepared for emergencies. Approximately 45 percent of those who are financially vulnerable said that if they had to live off the savings they had readily available, without withdrawing from retirement accounts or taking out a loan, they would survive less than a week. This could be because only 2 percent of financially vulnerable respondents said they were actively saving in a checking account, and only 6 percent were actively saving in a savings account. There is a $3,200 difference in the total median value of liquid savings accounts between financially coping and financially vulnerable respondents.
Many households also find themselves behind in saving for retirement. Approximately 42 percent of survey respondents have no retirement savings, while 75 percent of financially vulnerable respondents are not confident in their ability to meet their long-term savings goals. The median value of a financially vulnerable individual’s retirement account is $4,000, whereas the median value for a financially healthy individual is around $106,000.
These savings and retirements findings underscore that we should approach the glut of good news about the aggregate growth of the U.S. economy cautiously. Even amid a strong economy, when savings are poor, small downturns in the labor market can lead to crisis for many households and can result in widespread economic problems.


