Federal and state governments can help solve the employment problems of people in distressed places to spur equitable growth

Overview
Places in the United States differ greatly in their residents’ access to jobs, including access to good jobs. In economically distressed places, these job problems can be addressed by creating more jobs, particularly good jobs, and by improving residents’ access to those jobs. Effective policy solutions require customized public services for businesses to create jobs where they are needed alongside similarly customized public services for individuals seeking work to improve their access to good jobs.
The federal government and state governments already provide about $80 billion a year to help create jobs around the nation through a variety of longstanding programs that are detailed in my analysis below. These current job-creation programs are rarely targeted to distressed places, however, and instead spread job creation to all places. In addition, as I discuss below, most of the dollars devoted to these job-creation policies are business tax incentives, which are less cost-effective than some alternative job creation policies that emphasize various public services to businesses and individuals. Although the Biden administration did adopt some programs to spur job creation in distressed places, these programs were funded by Congress at a pilot scale compared to the need.1
Because distressed places lack the resources to provide such public services at a large enough scale, federal or state aid that is specifically adapted to places’ diverse needs is required. As I have proposed in the past—and again propose in this essay—this flexible federal or state aid should be targeted in its per-capita funding based on a local community’s prime-age employment rate. As I argue below, a place’s prime-age employment rate provides a good measure of the availability of labor market opportunities for local residents.
In this essay, I will discuss how best to target distressed places with job creation programs and what job creation programs are most effective. First, I will map out how the prime-age employment measure gauges the job creation needs of local labor markets and neighborhoods across the country. Then, I will examine a number of different government programs at the federal and state levels that have tried to increase people’s access to jobs—and particularly good jobs—and, importantly, what types of programs are most successful at a reasonable cost per job opportunity created. I then close my essay with a set of principles and policy proposals to help guide federal and state aid to distressed places so that the scale is sufficient to significantly alleviate these distressed places’ problems and the aid’s design is targeted, cost-effective, and adaptable to each place’s needs.
The problem of distressed places and their sizes and distribution across the country
Distressed places include both local labor markets and neighborhoods. A local labor market is one or more counties that are sufficiently linked by commuting such that changes in labor market conditions can quickly spread throughout the area. A neighborhood is a portion of a county that has a defined identity and similar within-neighborhood amenities, such as the quality of schools and levels of crime. Examples of local labor market definitions include metropolitan areas, commuting zones, and a definition that I developed of “spillover-based” local labor markets.2 Neighborhoods are defined in an ad hoc way in different local communities and are typically based on what residents identify as distinct neighborhoods.
A useful measure for discerning whether a local labor market or neighborhood is experiencing labor market distress is its so-called prime-age employment rate, or the employment-to-population ratio for those ages 25 to 54. Prime-age persons generally both want to work and are expected by society to work. As a result, increases in employment for this prime-age group are widely perceived as enhancing social well-being, in contrast to increased employment for persons who might be closer to retirement or enrolled in college or graduate school.
In addition, a focus on the local prime-age employment rate roughly controls for a place’s age mix. It would be a mistake to classify a place as “distressed” simply because there is a high proportion of its population that is not working due to being in college or retired.
An increase in the local prime-age employment rate by itself signifies increased earnings per capita for residents, due to a higher proportion of the population having a job. A higher prime-age employment rate also indirectly increases earnings per capita by putting upward pressure on local real wages and making it easier for residents to get hired for better jobs.3 A reduced prime-age employment rate has the reverse effects.
The prime-age employment rate is not a perfect or comprehensive measure of local labor market distress.4 But it is a measure that is closely associated with how many of a place’s residents are experiencing problems in getting jobs or getting good jobs. Furthermore, the prime-age employment rate is one of the few reasonable measures of local labor market distress that can be consistently defined for all U.S. counties and census tracts.5
The most recent comprehensive data on the prime-age employment rate for all counties and census tracts comes from the 2019–2023 period.6 However, as discussed further below, the relative prime-age employment rate for places, compared to the national rate, is highly persistent over time. Therefore, places whose prime-age rate is far below the national average in 2019–2023 will typically be similarly far below the national average in 2025.
Based on 2019–2023 data, the prime-age employment rate varies widely across local labor markets in the United States. About 10 percent of the U.S. population lives in local labor markets that, as of 2019–2023, have a prime-age employment rate of 84.1 percent or higher. These places’ economies are not showing escalating wage and price inflation and thus, their labor market situation can be considered economically sustainable. Indeed, this 84.1 percent rate is a rough-and-ready approximation of full employment because the overwhelming majority of local residents who want a job can find a reasonable-quality job, and yet the economy is not experiencing excess inflationary pressures.
In contrast, 10 percent of the U.S. population lives in local labor markets where the prime-age employment rate, as of 2019–2023, was 73.8 percent or lower, indicating that local residents have much more difficulty finding jobs and, in particular, finding good jobs. These difficulties have large social costs: Low employment rates lead to poorer mental health, increased substance abuse, higher crime, more family break-ups, and poorer outcomes for children.7
The map below shows local U.S. labor markets that are “severely distressed” or “moderately distressed,” as well as those that are less distressed and not distressed, according to the 2019–2023 data. The former is defined as more than 10 percentage points below the “full employment” prime-age employment rate of 84.1 percent and the latter as between 5 percentage points and 10 percentage points below that rate. Under these definitions, 10.5 percent of the U.S. population lives in local labor markets that are severely distressed, and another 28 percent lives in moderately distressed areas. (See map.)
10.5 percent of the U.S. population lives in local labor markets that are severely distressed, and another 28 percent lives in moderately distressed areas.
Map
More than one-third of the U.S population lives in local labor markets that are distressed
Severely distressed, moderately distressed, less distressed, or nondistressed local labor markets, 2019–2023
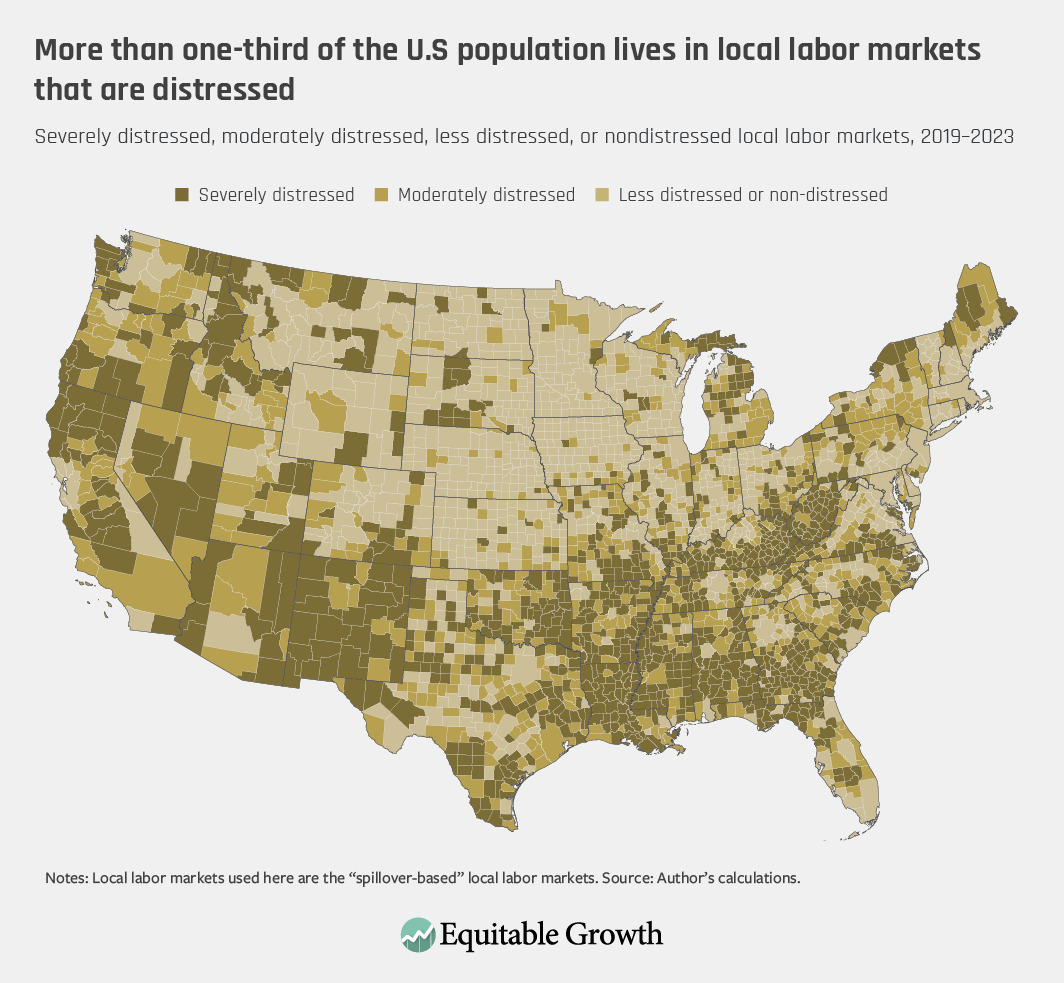
Distressed local labor markets include most of Appalachia and the rural South and Southwest. But many rural areas elsewhere in the country also are distressed, including in upstate New York, northern Maine, Michigan, and many rural areas in the western United States. Many urban areas are at least moderately distressed, among them Detroit and Flint, Michigan; Gary, Indiana; Fresno and Bakersfield in California; Memphis, Tennessee; and Spokane, Washington.
In both booming and distressed local labor markets, some neighborhoods have much lower prime-age employment rates. If we define a distressed neighborhood as at least 10 percentage points below this local labor market average, then 10.7 percent of the U.S. population lives in distressed neighborhoods, based on the 2019–2023 data.
Although distressed neighborhoods are widespread, the size of the problem differs. Among the 30 largest local labor markets, the three local labor markets with the highest percentage of their population in distressed neighborhoods are Detroit (16.2 percent), Philadelphia (14.3 percent), and Cleveland (14.3 percent). The three local labor markets with the lowest percentage of their population in distressed neighborhoods are Portland, Oregon (6.1 percent), Seattle (6.5 percent), and Minneapolis/St. Paul (6.5 percent).
The racial and ethnic composition of distressed local labor markets is similar across demographic groups. In contrast, Black and Hispanic people are more likely to reside in distressed neighborhoods: The national average percentages of the population living in distressed neighborhoods are 7.3 percent for White, non-Hispanic persons, 11.8 percent for Hispanic persons, and 21.7 percent for Black persons.8
The prime-age employment rate in different local labor markets goes up and down with the national economy’s rate, yet different places’ relative positions, compared to the nation, often persist. In 2000, for example, about 47 percent of the U.S. population lived in severely or moderately distressed local labor markets. Of this population living in distressed local labor markets as of 2000, 74 percent still lived in severely or moderately distressed local labor markets as of the 2014–2018 period.9
But, sometimes, places dramatically improve. The local labor market’s prime-age employment rate in the New York City area, for example, went from 6.9 percentage points below the national average in 2000 to slightly above the national rate in the 2014–2018 period.10
Solving places’ job distress: Effective programs are services to promote job creation and job access
The jobs problems of distressed places cannot be solved at scale by moving people from distressed places to better places, a strategy that local economic development specialist Jason Segedy has called the “U-Haul School of Urban Policy.”11 Why doesn’t the “U-Haul” strategy work? The arguments for this position are two-fold. First, people are hard to move. More than half of Americans spend most of their careers in their childhood local labor market.12 Even large local job losses increase out-migration over the next decade by less than 1 percentage point.13 Estimated moving costs, both financial and psychological, often exceed 100 percent of annual income.14
Second, moving some people out of distressed places does not help those left behind. In local labor markets, population loss leads to a similar percentage loss of employment, with no improvement in the local employment rate.15 Population loss lowers demand for local goods and services and disproportionately removes younger and more entrepreneurial workers. In neighborhoods, population loss leads to abandoned housing, higher crime, and loss of local retail outlets.16
In sum, places that are distressed cannot be helped simply by encouraging individual out-migration because people have valuable ties to places, and out-migration has spillover costs. Instead, policymakers need to enact place-based policies to help people in their home places.
Boosting employment rates in distressed places requires different strategies for local labor markets versus neighborhoods. For distressed local labor markets, local employment rates can be increased by creating jobs. In severely distressed places, local job creation can result in half the jobs boosting local employment rates and the other half going to in-migrants.17 In other words, if a distressed local labor market is able to add 100 jobs, 50 of those jobs could go to additional in-migrants to the local economy, while the other 50 jobs would then be reflected in the original local residents having a higher probability of having a job.
In contrast, in booming local labor markets with high employment rates, any added local job creation almost entirely boosts in-migration, with little effects on local employment rates.18 In booming local labor markets, newly created jobs will be filled mostly by in-migrants or already-employed local workers, as few readily employable, local, nonemployed workers are available.
The hiring of already-employed local workers results in job vacancies, filled in the same two ways. At the end of this job-vacancy chain, the initial job creation will be reflected close to 100 percent in in-migration.19 In booming places, job creation mostly increases property values for property owners rather than helping workers.20
How can local jobs be created? Most government job creation dollars come from state and local governments, and most of these job creation dollars are in the form of business tax incentives or cash grants to business to create jobs, which total more than $70 billion annually.21 Examples include property tax abatements, job creation tax credits, or cash grants tied to a firm’s job creation or investment.
But federal, state, and local governments together devote about $10 billion annually to various spending programs that promote job creation by what I describe as customized business services: providing business with better business sites, more productive labor, or business-relevant information.22 These services are customized in that they are typically designed to meet the needs of a particular industry, or even a particular firm.
One type of customized business service is business-specific infrastructure. A regular part of the local economic developer’s toolkit is to create industrial parks or high-tech research parks, which provide land that is zoned for a particular industry type and has appropriate supportive infrastructure. State economic development agencies or state transportation agencies frequently pay for industrial access roads, which provide new roads in association with a major new firm location, to facilitate movement of supplies, workers, or output. Business incubators, of which there are about 1,400 in the United States, help provide affordable business space for new or small businesses, along with some support services.23
States also seek to create jobs through customized job training programs. Rather than targeting disadvantaged residents, these programs target firms that are either creating jobs or facing competitive threats, providing them with free or heavily subsidized job training. This training is customized in that it is designed around the particular firm’s skill needs. Training is typically provided by local community colleges. Around 42 states provide such customized training, at a cost of around $1 billion annually.24
Jobs also can be created by providing individual firms with business-specific information or advice. For example, the Manufacturing Extension Partnership in the U.S. Department of Commerce provides federal support that pays for part of the costs of manufacturing extension services in all 50 states.25 In manufacturing extension services, program staff or reliable consultants provide small- and medium-sized manufacturers with advice, typically paid for partly by fees and partly supported by government, on how to best adopt new technology or move into new markets.
The federal Small Business Administration also provides funding that pays for part of the costs of Small Business Development Centers that exist in all 50 states and help new or small businesses develop and implement better business plans.26 In both manufacturing extension services and Small Business Development Centers, the information and advice is customized to the needs of the individual business.
Which of the above types of job creation is most cost-effective? While tax incentives can create jobs, the cost per job is high. The various customized business services are more cost-effective because they provide businesses with better access to inputs, such as real estate, labor, and information, which are difficult for many firms, particularly smaller firms, to access on their own.
Based on my research, Figure 1 below shows the cost in severely distressed local labor markets of increasing the overall employment rate by one job.27 To avoid possible misinterpretations, it is important to note that this figure is based on research that estimates the cost of government job-creation programs per job actually induced by the particular program. These induced jobs numbers will be lower than the number of jobs subsidized by the program. For example, only a minority of firms receiving tax incentives or customized services would have changed their location and job creation decisions due to being provided this incentive or service.28
The figure then takes these research findings on costs per job actually induced and translates these costs into costs in 2024 dollars. Furthermore, this figure translates research findings about costs per induced job into costs, divided by total jobs created, for jobs that actually boost the employment rate of local residents in distressed local labor markets. As mentioned above, in severely distressed local labor markets, about half of jobs created can go to increase the employment rate of local residents, and the other half go to in-migrants. This focus on jobs that boost the local employment rate actually doubles the cost per job.29
Figure 1
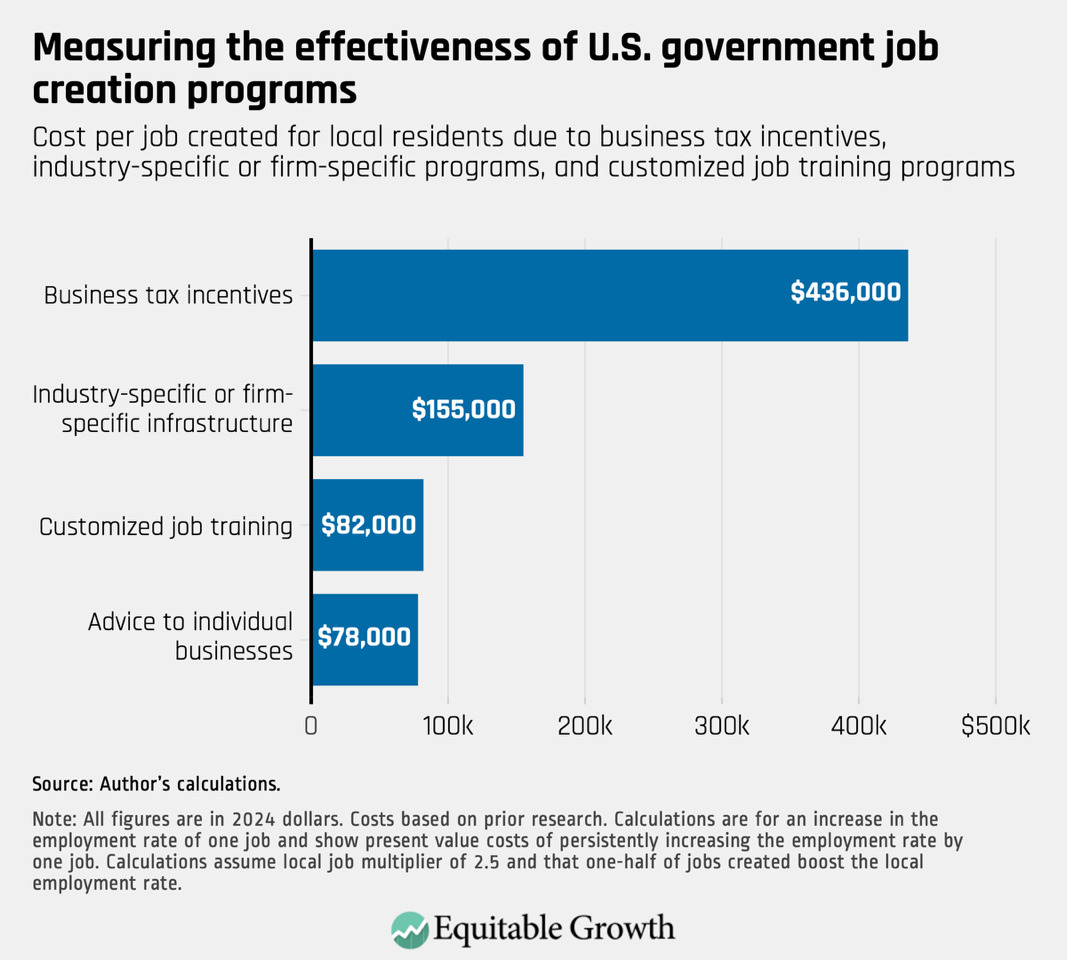
Are these costs of increasing the employment rate outweighed by the benefits? In severely distressed local labor markets, benefits probably do outweigh the costs. Permanently increasing the employment rate has economic benefits whose present value in many cases will exceed $1 million per job.30 As a result, even business tax incentives can have benefits greater than costs. But the cost per job of these three types of customized business services is less than half the cost of business tax incentives, as presented in Figure 1. More cost-effective local job creation strategies would emphasize these services, as opposed to tax incentives.
One example of successful local use of these job creation strategies is Grand Rapids, Michigan.31 This medium-sized city in the west-central part of the state has experienced manufacturing job growth of more than 10 percent since 1990, while the United States as a whole has lost one-quarter of its manufacturing jobs. Grand Rapids’ economic development strategy included extensive use of both state and local incentives but also included supporting a local manufacturing extension office that helps some auto suppliers diversify their markets into health care, customized training programs to better meet the skill needs of different local manufacturing clusters, and support for a biotech research corridor.
For distressed neighborhoods, neighborhood job creation is ineffective in helping residents. Most Americans do not live and work in the same neighborhood, so adding more jobs to a distressed neighborhood will not significantly boost the employment rates of its residents. What residents need is better job access, including improving public transit or helping provide reliable used cars, helping residents find affordable, quality child care, and both classroom training and on-the-job training services for in-demand jobs in the local labor market, among others. Studies show that these neighborhood job access services can increase employment rates at a cost per job of $103,000.32
Job access services for distressed neighborhoods should be combined with investments in improving the neighborhood’s amenities, including by lowering crime rates, improving schools, and investing in public parks, neighborhood business districts, and other neighborhood infrastructure. If neighborhood amenities are improved without increasing neighborhood residents’ earnings, though, the result is excessive gentrification, with housing price increases outpacing residents’ ability to pay. At the same time, if neighborhood residents’ earnings are boosted without improving a distressed neighborhood’s amenities, the result is excessive out-migration, undermining neighborhood improvement. Simultaneously boosting both neighborhood amenities and residents’ earnings is more likely to lead to neighborhood improvements that actually help residents.
A good example of job access services is the Employer Resource Network program. The ERN model started in west Michigan in 2007 and currently is a loose network of programs active in 25 local labor markets across eight states that all follow a similar model. The national network provides certification of local programs and some training support for programs, but programs are administered and funded locally.33
Under the ERN model, employers share in the cost, typically alongside a public subsidy, of providing what amounts to support for social work casework services for newly hired workers, particularly disadvantaged workers. The ERN “success coach” can provide counseling to both the worker and their supervisor to help overcome problems with attendance or personal relationships that might impede job retention.
The ERN model can be viewed as a form of on-the-job training in so-called soft skills. Success coaches also can help employees find new child care arrangements if needed. In some ERN programs, if an employee’s car breaks down, the success coach can work with a local credit union or bank to quickly obtain a loan to repair the car.34 For the local ERN program in the Kalamazoo, Michigan, area, for example, car repair loans of up to $1,000 can be provided, and about 3 percent annually of all ERN-served workers need such a loan.35
Job access services can be coordinated by Neighborhood Employment Hubs, as has been done in Battle Creek, Michigan.36 Such hubs move the workers in job training agencies out of impersonal downtown office buildings into trusted institutions in distressed neighborhoods, making services more accessible to residents, both physically and psychologically. In Battle Creek, these trusted neighborhood institutions include a neighborhood group, a subsidized housing project, and a neighborhood church.
Moving the training agencies’ workers into these local hubs makes these workers more aware of neighborhood weaknesses and assets and more in touch with neighborhood services and needs. For example, workers at the hubs may be more in touch with neighborhood businesses, which may increase awareness of job vacancies and facilitate more productive job placements.
What it takes: A federal government or state governments that can provide significant resources to target and empower distressed places
Based on these costs of around $100,000 per job added, significantly increasing distressed places’ employment rates requires providing these places with annual assistance of around $300 per capita37 for at least 10 years.38 The total national costs of significantly helping severely distressed places sum to around $20 billion per year for at least 10 years.39
This total amount is obviously just rounding error compared to total annual federal spending, which is more than $6 trillion. Yet such a commitment to local economic development would be large compared to recent federal commitments to local development. In fiscal year 2024, for example, federal appropriations for the Community Development Block Grant program, which supports various types of community and economic development activities in distressed urban neighborhoods and distressed rural communities, were about $3 billion.
As another example, the public perception that the Biden administration succeeded in getting large-scale appropriations for programs targeting distressed places is incorrect. Most of the programs targeting distressed places ended up receiving appropriations that were at a pilot scale.40
Yet the Biden administration did succeed in getting the U.S. Congress to appropriate significant dollars for industrial policies that targeted specific industries for job creation. For example, the CHIPS Act appropriated $53 billion to revitalize the U.S. semiconductor industry.41 But such a subsidy program for the semiconductor industry is not really a place-based program—it is certainly not targeted at distressed places.42 Other programs tried to geographically diversify the tech industry, but, in most cases, that is not the same as targeting distressed places.43
Consider one example of a program that did explicitly target distressed places. The Recompete program was originally proposed by former Rep. Derek Kilmer (D-WA) in 2022 as a program specifically targeting distressed places with low prime-age employment rates, offering flexible funding that could include many of the customized services advocated for earlier in this essay. The suggested funding level in Rep. Kilmer’s original bill averaged more than $17 billion per year for 10 years. In the CHIPS Act, the program was authorized as the Recompete Pilot Program, with a one-time authorization of $1 billion. Actual appropriations ended up at $200 million.44 Recompete may be a promising program, but it was not funded at scale. In fact, Recompete was not even funded at a sufficient scale to be readily evaluable, to simply see if this approach works.45
In sum, recent experience suggests that it is difficult politically for the federal government to target $20 billion annually in aid to distressed places. But $20 billion annually is comparable to what has sometimes been spent in the past. For example, just after it was created in 1974, Community Development Block Grant funding, which replaced urban renewal and other categorical community development programs as part of President Richard Nixon’s new federalism policies, peaked in the late 1970s at an annual funding level equivalent to more than $15 billion today.46 The question is whether the federal government for the foreseeable future can recover its ability to fund such targeted development aid at scale.
What, then, are the alternatives, if federal aid of the required scale is not forthcoming? Distressed places cannot realistically afford annual costs of $300 per capita, which is more than 10 percent of average local tax revenues.47
State governments, however, could afford to invest $300 per capita in their most distressed quintile of places, which would have a statewide cost of $60 per capita ($300 times 20 percent).48 As mentioned above, state governments in total invest more than $70 billion per year in business tax incentives for economic development, which typically do not do much to target distressed places. Simply cutting current incentive programs by less than one-third would free up the $20 billion per year needed to help the most severely distressed places.
Yet such federal or state aid requires targeting distressed places. And targeting is politically challenging and has rarely been sustained at scale for development aid from federal or state governments.
As I have argued before, perhaps federal or state targeting of development aid would be more feasible if it were “targeting within universalism,”49 which has usually been discussed as a political consideration in the design of social programs. The argument is that a social program to help the poor is more politically feasible if significant benefits also go to the middle class and other groups.50 Applying such a concept to development aid could mean providing some job creation aid to all places but tying per-capita aid to a place’s prime-age employment rate.51 The argument is that such an approach would be more politically feasible because all places would get some aid.
Such a targeting-within-universalism approach has sometimes been used for various large government programs.52 Social Security, for example, provides retirement income help for almost all workers, but the benefit formula provides higher benefit payments relative to payroll taxes for lower-wage workers. Perhaps the most relevant example is intergovernmental aid for public schools: Many states tie school aid for Kindergarten-through-12th grade school districts to the district’s number of low-income students.53 This extra state aid per low-income student is sometimes 40 percent to 50 percent greater than the general support per student. So-called federal Title I aid to school districts, funded annually at more than $18 billion, is even more targeted, with the funds mostly determined by a school district’s number of low-income students.54
All of these are precedents for basing a government program’s aid on need while still recognizing that everyone may have some level of need. Doing so for place-based jobs policies simply requires conceptualizing this local economic development aid as a way to help, first of all, nonemployed or under-employed workers. Greater aid to local labor markets or neighborhoods with lower prime-age employment rates can then be viewed as fair. Funding would be proportionate to the number of local residents needing jobs.
Aid for distressed places by the federal government or state governments also must recognize the need for local flexibility. When attempting to increase local employment rates, one size does not fit all. Whether a local labor market’s job creation strategy should emphasize manufacturing extension services, for example, depends upon the viability of local manufacturing. As another example, the specific business real estate or local skills that are needed will vary greatly across places.
At the neighborhood level, the transit or car options that are most needed will depend on the area’s size and the neighborhood’s proximity to job centers. The availability of child care also varies greatly by neighborhood. And the need for job training programs can depend on residents’ skills compared to the jobs in locally growing industries. Local leaders and residents should help design local strategies, as local investments will be needed to complement federal or state investments.


Conclusion
Helping distressed places requires a different philosophy of federal or state aid to local places. The federal or state aid must be generous and long term yet highly targeted, while also allowing for considerable local discretion. Such an aid strategy differs from usual intergovernmental aid, which comes in the form of categorical programs. These categorical programs provide short-term funds whose allowable uses are dictated from the top down to the localities.
This long-term, flexible, and targeted aid is needed to visibly help the residents of distressed places. The aforementioned Recompete Pilot Program, which used the prime-age employment rate as its investment metric, is a start, but these investments need to be made at scale in distressed communities across the country.55 Such aid would show respect for the worth of distressed local communities. It would honor the high value that many residents place on where they live because people care that their home community is doing well economically and socially.
Promoting employment via such aid would offer residents in distressed communities the dignity of work. A key part of personal identity and self-respect for many residents of distressed communities is the ability to find a good job in their home community, rather than being forced to move out. This flexible aid approach also shows respect for the unique characteristics of local places. Flexible aid empowers local leaders and institutions, rather than dictating to them from the top down.
Can federal or state governments say to the leaders and residents of distressed places: “I am from the federal or state government, and I am here to help,” and credibly deliver? The outlook is hazy. We need to try again with this new approach—and continue trying until we get it right.
About the author
Timothy J. Bartik is a senior economist at the W.E. Upjohn Institute for Employment Research, a nonprofit and nonpartisan research organization. He co-directs the Institute’s research initiative on policies for place. Bartik received his Ph.D. in economics from the University of Wisconsin-Madison.
Did you find this content informative and engaging?
Get updates and stay in tune with U.S. economic inequality and growth!
End Notes
1. Timothy J. Bartik, Kathleen Bolter, and Kyle Huisman, “Early data shows positive job growth in distressed US counties as new federal policies take effect” (Washington: Brookings Institution, 2024), available at https://www.brookings.edu/articles/early-data-shows-positive-job-growth-in-distressed-us-counties-as-new-federal-policies-take-effect.
2. For more on the spillover-based local labor market definition, see Timothy J. Bartik, “Local Labor Markets Should Be Redefined: New Definitions Based on Estimated Demand-Shock Spillovers.” Working Paper 24-407 (W.E. Upjohn Institute for Employment Research, 2024), available at https://research.upjohn.org/up_workingpapers/407). I explain in this working paper why I prefer it to metro area and commuting zone definitions, which are often too large. The spillover-based definition defines local labor markets by county groupings that capture as much as possible of spillover effects of employment changes across counties while having high average spillovers within each defined local labor market.
3. Timothy J. Bartik, “Who Benefits from State and Local Economic Development Policies?” (Kalamazoo, MI: W.E. Upjohn Institute for Employment Research, 1991), available at https://research.upjohn.org/up_press/77; David Blanchflower and Andrew Oswald, The Wage Curve (Cambridge, MA: MIT Press, 2003).
4. A prominent recent article in the American Economic Review has claimed that the employment rate is a good comprehensive measure of local well-being, arguing that the “employment rate can serve as a sufficient statistic for local well-being.” I wouldn’t go quite that far, but, clearly, the employment rate strongly affects local well-being in terms of labor market success for residents, or at least is strongly positively correlated with such success. See Michael Amior and Alan Manning, “The Persistence of Local Joblessness,” American Economic Review 108 (7) (2018): 1942–1970, available at https://www.aeaweb.org/articles?id=10.1257/aer.20160575.
5. The prime-age employment rate is defined for all census tracts and counties in 5-year averages from the American Community Survey. Although the 5-year averaging may seem a limitation, the prime-age employment rate is highly correlated over time, so a place’s relative-to-the-nation 5-year average for the prime-age employment rate is likely to be similar to the more up-to-date situation. In contrast, average real hourly wages or their distribution could only be defined based on microdata from the American Community Survey, which only identifies geographies for Public Use Microdata Areas, which are geographic areas of 100,000 or more residents—far larger than almost all neighborhoods and larger than a majority of U.S. counties. Furthermore, if we want to measure local real wages or local real earnings so that they can be compared across local places, these comparisons should ideally adjust local prices for the local quality of life, which is difficult to do on an ongoing basis for all places (although not impossible to do for some selected places). See Rebecca Diamond, “The Determinants and Welfare Implications of US Workers’ Diverging Location Choices by Skill: 1980-2000,” American Economic Review 106 (3) (2016): 479–524, available at https://www.aeaweb.org/articles?id=10.1257/aer.20131706.
6. These data come from some processing of published tables from the American Community Survey for this 5-year period. The prime-age rate is the ratio of prime-age civilian employment-to-prime-age civilian population. For more on the procedure for making these calculations, see Timothy J. Bartik, “Helping America’s distressed communities recover from the COVID-19 recession and achieve long-term prosperity” (Washington: Brookings Institution, 2020), available at https://www.brookings.edu/wp-content/uploads/2020/09/20200923_BrookingsMetro_Distressed-Communities-COVID19-Recovery_Bartik_Report.pdf.
7. Timothy M. Diette and others, “Race, Unemployment, and Mental Health in the USA: What Can We Infer About the Psychological Cost of the Great Recession Across Racial Groups?” Journal of Economics, Race, and Policy 1 (2018): 75–91, available at https://link.springer.com/article/10.1007/s41996-018-0012-x; David Autor, David Dorn, and Gordon Hanson, “When Work Disappears: Manufacturing Decline and the Falling Marriage Market Value of Young Men,” American Economic Review: Insights 1 (2) (2019): 161–178, available at https://pubs.aeaweb.org/doi/pdfplus/10.1257/aeri.20180010; Justin R. Pierce and Peter K. Schott, “Trade Liberalization and Mortality: Evidence from US Counties,” American Economic Review: Insights 2 (1) (2020): 47–64, available at https://pubs.aeaweb.org/doi/pdfplus/10.1257/aeri.20180396; Bryan Stuart, “Essays on the Economics of People and Places,” Ph.D. dissertation (Ann Arbor, MI: University of Michigan, 2017), available at https://deepblue.lib.umich.edu/handle/2027.42/138735.
8. Timothy J. Bartik, “How State Governments Can Target Job Opportunities to Distressed Places” (Kalamazoo, MI: W.E. Upjohn Institute for Employment Research, 2022), available at https://research.upjohn.org/cgi/viewcontent.cgi?article=1048&context=up_technicalreports. The definition of local labor markets used here is different, and statistics are for 2015–2019.
9. That is, 35 percent of the population (74 percent of 47 percent) lived in severely or moderately distressed local labor markets in both 2000 and 2014–2018. This calculation uses the local labor market definitions and data described in Bartik, “Helping America’s distressed communities recover from the COVID-19 recession and achieve long-term prosperity.” Severely or moderately distressed is defined as a local prime-age employment rate at least 5 percentage points below the 90th percentile of the population-weighted prime-age employment rate by local labor market. As another measure of persistence over time, the population-weighted correlation between local labor markets’ prime-age employment rates from 2000 to 2014–2018 was 0.79.
10. See Bartik, “Helping America’s distressed communities recover from the COVID-19 recession and achieve long-term prosperity.” These trends from 2000 to 2014–2018 use commuting zones to define local labor markets. I have not updated these commuting zone trends. However, using spillover-based local labor market definitions (see Bartik, “Local Labor Markets Should Be Redefined: New Definitions Based on Estimated Demand-Shock Spillovers”), the New York City area is still slightly higher than the national average, at 79.7 percent versus a national average of 79.2 percent. This is not surprising, as local labor markets rarely show large changes, relative to the national average, over 5-year time periods.
11. See Jason Segedy, “The U-Haul School of Urban Policy,” The Stile 1972 blog, January 7, 2019, available at https://www.tumblr.com/thestile1972/181809404165/the-u-haul-school-of-urban-policy. Segedy’s arguments against the “U-Haul” school emphasize somewhat different points than my arguments. He does mention that people are hard to move because of strong ties to their families, and he also expresses doubts that the communities left behind will be better off. Yet he does not mention the empirical evidence that I stress, that when a population out-migrates, employment goes down as much as population in percentage terms. I also argue that people are hard to move based on empirical studies of estimated “moving costs,” which Segedy does not do. Segedy also argues that the right kinds of jobs are not available in growing places, which I am not sure is true. In addition, he argues that local housing prices are too high in growing places, but many of the advocates of greater mobility want to lower such costs by expanding housing supply. See Yoni Appelbaum, “How Progressives Froze the American Dream,” The Atlantic, February 10, 2025, available at https://www.theatlantic.com/magazine/archive/2025/03/american-geographic-social-mobility/681439/.
12. Timothy J. Bartik, “What Proportion of Children Stay in the Same Location as Adults, and How Does This Vary Across Location and Groups?” Working Paper 09-145 (W.E. Upjohn Institute for Employment Research, 2024), available at https://research.upjohn.org/up_workingpapers/145.
13. Alexander W. Bartik, “Essays on the Economics of Labor Markets,” Ph.D. dissertation (Cambridge, MA: Massachusetts Institute of Technology, 2017), available at https://dspace.mit.edu/handle/1721.1/111369.
14. Ibid. See also Jesse Gregory, “The Impact of Post-Katrina Rebuilding Grants on the Resettlement Choices of New Orleans Homeowners,” Ph.D. dissertation (Madison, WI: University of Wisconsin, 2017), available at https://users.ssc.wisc.edu/~jmgregory/Gregory_katrina_dissertation2.pdf; Gizem Koşar, Tyler Ransom, and Wilbert van der Klaauw, “Understanding migration aversion using elicited counterfactual choice probabilities,” Journal of Econometrics 231 (1) (2022): 123–147, available at https://www.sciencedirect.com/science/article/abs/pii/S0304407621000415.
15. Timothy J. Bartik, “Using Place-Based Jobs Policies to Help Distressed Communities,” Journal of Economic Perspectives 34 (3) (2020): 99–127, available at https://www.aeaweb.org/articles?id=10.1257/jep.34.3.99.
16. Alexander W. Bartik and Evan Mast, “Black Suburbanization: Causes and Consequences of a Transformation of American Cities” Working Paper 21-355 (W.E. Upjohn Institute for Employment Research, 2023).
17. Author’s calculations for this essay based on Bartik, “Long-run effects on county employment rates of demand shocks to county and commuting zone employment.” I use the elasticities from this paper for distressed commuting zones with low growth (See Table 2, column 2) and apply them to the most distressed 10 percent of all local labor markets, defined in Bartik, “Local Labor Markets Should Be Redefined: New Definitions Based on Estimated Demand-Shock Spillovers.” The average share of jobs going to local nonemployed residents is 0.68. This calculation uses as weights the number of civilian prime-age nonemployed workers in each local labor market that exceeds the “full employment” nonemployment rate, which occurs when the prime-age rate is 84.1 percent and the nonemployment rate is 15.9 percent. This is a plausible allocator for federal or state aid for distressed places. However, this is for a demand shock to the local export base, with a local multiplier. (See endnote 29 for more on local multipliers.) I assume that the average long-run multiplier in these data is 1.5; see Timothy J. Bartik and Nathan Sotherland, “Local Job Multipliers in the United States: Variation with Local Characteristics and with High-Tech Shocks.” Working Paper 19-301 (W.E. Upjohn Institute for Employment Research, 2019), available at https://research.upjohn.org/up_workingpapers/301/. This means that in total jobs created, rather than the initial export-base shock, the share of total jobs going to the nonemployed population would be 0.45 (0.68/1.5). I also assume that a well-designed local economic development policy for distressed local labor markets would increase this proportion by using customized training programs and hiring requirements for incentivized jobs, which will tend to increase the nonemployed share of jobs created relative to in-migrants; see Bartik, “How State Governments Can Target Job Opportunities to Distressed Places.” An increase to 0.5 seems plausible. As shown in Bartik, “Long-run effects on county employment rates of demand shocks to county and commuting zone employment,” the share of jobs going to the local nonemployed can also be increased by targeting more distressed counties within the local labor market. As this discussion suggests, the devil is in the details, which, in this case, means the exact proportion of jobs going to local nonemployed workers will depend on the details of where exactly the jobs are created and what policies accompany the job creation.
18. See Bartik, “Long-run effects on county employment rates of demand shocks to county and commuting zone employment.” There is a continuum of net effects: In average local labor markets, more local jobs in the long run are reflected 20 percent in higher local employment rates, 80 percent in in-migration; see also Bartik, “Using Place-Based Jobs Policies to Help Distressed Communities,” which reviews the research. Of course, even in booming areas, aggressive policies to encourage assisted firms to fill job vacancies with the nonemployed may yield some increased employment rates for local residents, but the potential of such policies is limited by the relatively low proportion of local nonemployed workers in the labor market.
19. In distressed, average, or booming local labor markets, new jobs are initially only filled 10 percent to 20 percent by in-migrants, with only slight variation across these different types of local labor markets; see Joseph Persky, Daniel Felsenstein, and Virginia Carlson, Does “Trickle Down” Work?: Economic Development Strategies and Job Chains in Local Labor Markets (Kalamazoo, MI: Upjohn Press, 2004), available at https://research.upjohn.org/up_press/25. But, as Persky and his co-authors’ job vacancy chain analysis shows, these different local labor market conditions lead to significant differences in whether previously nonemployed local residents are able to get and keep jobs as new jobs or job vacancies are filled. The more distressed the local labor market, the more likely employers are to fill vacancies with the local nonemployed, and the more likely these workers are to be retained in jobs over time.
20. For a typical project that is subsidized by a business tax incentive, in an average-distress local labor market, the project barely passes a benefit-cost test, with overall benefits of about 152 percent of the incentive costs. See Table 4.1 on page 42 and surrounding discussion in Timothy J. Bartik, Making Sense of Incentives: Taming Business Incentives to Promote Prosperity (Kalamazoo, MI: W.E. Upjohn Institute for Employment Research, 2019), available at https://www.upjohn.org/research-highlights/making-sense-incentives-taming-business-incentives-promote-prosperity. Labor market benefits in higher real earnings from this typical project in a typical area are about 106 percent of incentive costs, and property value capital gains have a present value of 34 percent of incentive costs. But if the project were in a local labor market that was so booming that employment rates did not much increase, local labor market benefits from real earnings increases would dramatically decrease. Property value benefits might slightly increase due to more in-migration, but this is largely offset because higher property values tend to raise local prices and nominal wages, which discourages job growth. Based on empirical elasticities of how property values respond to population growth and how job growth responds to higher property prices, property value increases alone can rarely, if ever, justify a policy that promotes local job creation.
21. Timothy J. Bartik, “Reimagining Business Incentives to do More with Less” (Kalamazoo, MI: W.E. Upjohn Institute for Employment Research, 2024), available at https://www.upjohn.org/reimagining-business-incentives-do-more-less.
22. Bartik, “Using Place-Based Jobs Policies to Help Distressed Communities,” Table 1.
23. Ned Smith, “Incubators Heat Up Chances of Small Business Survival,” Business News Daily, October 23, 2023, available at https://www.businessnewsdaily.com/272-incubators-increase-small-business-success.html.
24. Lisa B. Kahn and others, “Do Workforce Development Programs Bridge the Skills Gap?” (2024), available at https://www.atlantafed.org/-/media/documents/news/conferences/2024/09/26/annual-employment-conference/kahn–do-workforce-development-programs-bridge-the-skills-gap.pdf; Kevin M. Hollenbeck, “Is There a Role for Public Support of Incumbent Worker On-the-Job Training?” Working Paper 09-138 (W.E. Upjohn Institute for Employment Research, 2008), available at https://research.upjohn.org/up_workingpapers/138/.
25. “Manufacturing Extension Partnership (MEP),” available at https://www.nist.gov/mep (last accessed February 2025).
26. “Small Business Development Centers (SBDC),” available at https://www.sba.gov/local-assistance/resource-partners/small-business-development-centers-sbdc (last accessed February 2025).
27. See Bartik, “How State Governments Can Target Job Opportunities to Distressed Places.” These costs are present-value costs of persistently increasing the employment rate by one job. A one-time investment in incentives or services can persistently increase a place’s employment, and a once-and-for-all shock to a place’s level of jobs can persistently increase employment rates in distressed places; see also Bartik, “Using Place-Based Jobs Policies to Help Distressed Communities.”
28. For an analysis of the “but for” for business incentives—what percentage of jobs in incented firms would not have been created but for the provision of the incentives—see Timothy J. Bartik, “’But For’ Percentages for Economic Development Incentives: What Percentage Estimates are Plausible Based on the Research Literature?” Working Paper 18-289 (W.E. Upjohn Institute for Employment Research, 2018), available at https://research.upjohn.org/up_workingpapers/289/. The estimated “but for” is between 2 percent and 25 percent, meaning that between 75 percent and 98 percent of the incented jobs would have been created at the same location if the incentives had not been provided. The research on the costs per induced job for various programs, including customized business services, is reviewed in Bartik, “How State Governments Can Target Job Opportunities to Distressed Places.”
29. Countering this effect is that the costs per total jobs created also depend on the assumed local multiplier, and will go down if the multiplier is higher and up if the multiplier is lower. (The local jobs multiplier is a ratio of total jobs created in a local economy to the direct jobs created in a so-called export-base business, one that sells its goods or services to buyers outside the local economy, although not necessarily outside the United States. What causes these multiplier effects? Mostly re-spending effects. When state and local economics developers successfully encourage growth in an export-base business, this brings new dollars into the local economy. These local dollars are, in part, re-spent on local suppliers, and the workers at the export-base firms and their local suppliers will buy some locally produced goods and services. The result is that the direct jobs created in the export-base business have some multiplier effects on local supplier and retail jobs. In addition, sometimes the ideas and skilled workers in export-base firms, particularly in tech firms, may have agglomeration economy effects in encouraging growth in nearby tech firms, which also can lead to multiplier effects.) The assumed multiplier of 2.5 is within the range of multipliers estimated Bartik and Sotherland, “Local Job Multipliers in the United States: Variation with Local Characteristics and with High-Tech Shocks.” However, it is larger than the average multiplier for a randomly chosen export-base job of 1.5. The implicit assumption is therefore that a smart local economic development strategy will target high-multiplier export-based firms. The multiplier of 2.5 lowers the cost per total jobs created by 60 percent, compared to a multiplier of 1 (a multiplier higher than 2.5 lowers the cost per job created to 40 percent of what it was originally, if there were a multiplier of only 1.) If policymakers instead randomly targeted export-base industries, the long-run multiplier would be 1.5, and the costs in Figure 1 would need to be inflated by (2.5/1.5), or by two-thirds. But this seems an extremely poorly run local economic development policy. For an in-between policy, suppose the targeting of export-base firms can increase the effective long-run local multiplier to 2. Then, the costs per job that increases residents’ employment rates would be (2.5/2), or 25 percent greater than the costs estimated in Figure 1. The lesson from all this is that targeting high-multiplier export-base firms is indeed important to the benefit-cost ratio of local job creation policies.
30. For example, suppose we assume that the average induced job has earnings of $60,000 per year; the increased employment rate persists for 20 years; and the social discount rate per year is 3 percent. Under these assumptions, an additional job due to a higher employment rate would have a present value of $919,428, looking solely at earnings gains for the individual worker. When we add in social spillovers in reduced crime, reduced substance abuse, and fewer family break-ups, the plausible social benefits exceed $1 million per extra job from a higher local employment rate.
31. Timothy J. Bartik, “What Works to Help Manufacturing-Intensive Local Economies?” (Kalamazoo, MI: W.E. Upjohn Institute for Employment Research, 2018), available at https://research.upjohn.org/up_technicalreports/35/; Timothy J. Bartik, “Bringing Jobs to People: Improving Local Economic Development Policies” (Washington: Aspen Economic Strategy Group, 2020), available at https://www.economicstrategygroup.org/publication/bringing-jobs-to-people/.
32. See David Neumark and Timothy Young, “Enterprise zones, poverty, and labor market outcomes: Resolving conflicting evidence,” Regional Science and Urban Economics 78 (2019), available at https://www.sciencedirect.com/science/article/abs/pii/S0166046218302606. This uses estimates from the Empowerment Zone program. These calculations are explained in Bartik, “How State Governments Can Target Job Opportunities to Distressed Places.” Other estimates are lower, at $84,000 per job; see Matias Busso, Jesse Gregory, and Patrick Kline, “Assessing the Incidence and Efficiency of a Prominent Place Based Policy,” American Economic Review 103 (2) (2013): 897–947, available at https://www.aeaweb.org/articles?id=10.1257/aer.103.2.897.
33. “Employer Resource Network,” available at https://ern-usa.com/about-us (last accessed February 2025).
34. My employer, the Upjohn Institute, oversees the ERN network for Michigan and runs ERN services in the Kalamazoo area.
35. Timothy J. Bartik and others, “Training Needs and Costs in Kalamazoo’s Core Neighborhoods” (Kalamazoo, MI: W.E. Upjohn Institute for Employment Research, 2024), available at https://research.upjohn.org/reports/306/.
36. See Kathleen Bolter, “Neighborhood Employment Hubs: Bringing Effective Job Assistance Directly to Residents” (Kalamazoo, MI: W.E. Upjohn Institute for Employment Research, 2022), available at https://www.upjohn.org/research-highlights/neighborhood-employment-hubs-bringing-effective-job-assistance-directly-residents. This Battle Creek Neighborhood Employment Hubs program is run by the job training division of my employer, the Upjohn Institute, with funding from the Kellogg Foundation.
37. $300 per capita happens to be the peak annual spending per capita in the 1950s of the largest-ever federally funded regional economic development program, the Tennessee Valley Authority, a New Deal program. These calculations were reported and explained on page 161 of Timothy J. Bartik, “Bringing Jobs to People: Improving Local Economic Development Policies” (Washington: Aspen Economic Strategy Group, 2020), available at https://www.economicstrategygroup.org/publication/bringing-jobs-to-people/. The calculations are in part based on data on Tennessee Valley Authority spending reported by Patrick Kline and Enrico Moretti, “Local Economic Development, Agglomeration Economies, and the Big Push: 100 Years of Evidence from the Tennessee Valley Authority,” The Quarterly Journal of Economics 129 (1) (2013): 275–331.
38. See Bartik, “Bringing Jobs to People: Improving Local Economic Development Policies”; Bartik, “How State Governments Can Target Job Opportunities to Distressed Places.” These studies look at individual distressed places and calculate the average amount required to reduce their employment rate gap versus the nation by some percentage after 10 years. To get intuition for this estimate, suppose we want to improve the employment rate on average in distressed places by about 5 percent of baseline employment. The 2024 ratio of employment in the Current Population Survey to the total U.S. population was 47.4 percent. Therefore, this increase in jobs would have a ratio of 2.4 percent (47.4 percent times 5 percent) to a distressed place’s population. A cost of $100,000 per job would imply a cost of around $2,400 per capita, which would imply an annual cost of $240 per capita over 10 years.
39. Again, these estimates look at each distressed place and then sum what it would take to reduce the employment rate gap versus the nation by some percentage. To gain intuition for this estimate, suppose we want to increase the employment of the most distressed 20 percent of the nation by 5 percent. This requires increasing these places’ employment rates by 1.6 million jobs (national Current Population Survey employment of 161 million jobs times 20 percent times 5 percent). At a cost of $100,000 per job, the total cost is $160 million, or $16 million per year if accomplished over 10 years.
40. Matt Hourihan, Mark Muro, and Melissa Roberts Chapman, “The bold vision of the CHIPS and Science Act isn’t getting the funding it needs” (Washington: Brookings Institution, 2023) available at https://www.brookings.edu/articles/the-bold-vision-of-the-chips-and-science-act-isnt-getting-the-funding-it-needs/.
41. U.S. Department of Commerce, “Two Years Later: Funding from CHIPS and Science Act Creating Quality Jobs, Growing Local Economies, and Bringing Semiconductor Manufacturing Back to America,” blog post, August 9, 2024, available at https://www.commerce.gov/news/blog/2024/08/two-years-later-funding-chips-and-science-act-creating-quality-jobs-growing-local.
42. There certainly were a variety of promising programs that are place-based that were enacted during the Biden administration; see The White House, “FACTSHEET: The Biden-Harris Administration Cements Legacy of Helping Left-Behind Communities Make a Comeback,” January 19, 2025, available at https://bidenwhitehouse.archives.gov/briefing-room/statements-releases/2025/01/19/fact-sheet-the-biden-harris-administration-cements-legacy-of-helping-left-behind-communities-make-a-comeback/. However, although there was significant place-based targeting—for example, various programs to diversify U.S. technology industries beyond Silicon Valley—most of these programs were not significantly targeted at distressed local labor markets. Such diversification of tech industries may be desirable but is not the same as targeting distressed places.
43. In addition, these tech diversification programs were not funded at a large scale. For example, both Tech Hubs and National Science Foundation Regional Innovation Engines were funded at well below their authorized level and really are pilot programs; see Hourihan, Muro, and Chapman, “The bold vision of the CHIPS and Science Act isn’t getting the funding it needs.” Neither program was highly targeted at distressed places.
44. See U.S. Economic Development Administration, “U.S. Economic Development Administration Issues Statement on Fiscal Year 2023 Appropriation,” Press release, December 30, 2022, available at https://www.eda.gov/news/press-release/2022/12/30/us-economic-development-administration-issues-statement-fiscal-year.
45. See discussion in Timothy J. Bartik and Mark Muro, “The Recompete Pilot Program Can Help Rebuild Distressed Places – If Policymakers Properly Fund It” (Washington: Brookings Institution, 2023), available at https://www.brookings.edu/articles/the-recompete-pilot-program-can-help-rebuild-distressed-places-if-policymakers-properly-fund-it/. Rep. Kilmer’s Recompete Act was based in part on my prior research; see also Bartik, “Helping America’s distressed communities recover from the COVID-19 recession and achieve long-term prosperity”; Timothy J. Bartik, “Broadening Place-Based Jobs Policies: How to Both Target Job Creation and Broaden its Reach” (Kalamazoo, MI: W.E. Upjohn Institute for Employment Research, 2020), available at https://research.upjohn.org/up_policypapers/24/.
46. During the 5-year period from 1975–1979, annual Community Development Block Grant funding averaged $16.3 billion per year (in 2024 dollars), ranging from $14.4 billion to $19.7 billion annually. Calculations based on Congressional Research Service, “Community Development Block Grants: Recent Funding History” (2014), available at https://www.congress.gov/crs-product/R43394. These nominal figures are adjusted to 2024 dollars by the author, using Consumer Price Index figures from the U.S. Bureau of Labor Statistics.
47. Bartik, “Bringing Jobs to People: Improving Local Economic Development Policies.”
48. Ibid.
49. Bartik, “How State Governments Can Target Job Opportunities to Distressed Places.” As far as I know, I am the first person to explicitly argue for targeting within universalism to make aid to distressed places more politically feasible.
50. For more on the debate about whether targeting with universalism is really necessary politically, see Theda Skocpol, “Targeting Within Universalism: Politically Viable Policies to Combat Poverty in the United States.” In Christopher Jencks and Paul E. Peterson, eds., The Urban Underclass (Washington, Brookings Institution, 1991), available at https://www.brookings.edu/books/the-urban-underclass/; Robert Greenstein, “Targeting vs. Universalism, and Other Factors That Affect Social Programs’ Political Strength and Durability” (Washington: The Hamilton Project, 2022), available at https://www.brookings.edu/wp-content/uploads/2022/08/20220806_ES_THP_SocialPrograms_ExpandedEdition.pdf.
51. Bartik, “How State Governments Can Target Job Opportunities to Distressed Places.”
52. Skocpol, “Targeting Within Universalism: Politically Viable Policies to Combat Poverty in the United States”; Greenstein, “Targeting vs. Universalism, and Other Factors That Affect Social Programs’ Political Strength and Durability.”
53. Kevin M. Hollenbeck and others, “The Road Toward K-12 Excellence in Michigan: How an Upgraded Financing System Can Better Support Enhanced Student Achievement” (Kalamazoo, MI: W.E. Upjohn Institute for Employment Research, 2015), available at https://research.upjohn.org/reports/215/.
54. Congressional Research Service, “ESEA Title I-A Formulas: A Primer” (2023), available at https://sgp.fas.org/crs/misc/R47702.pdf.
55. See Anthony F. Pipa and Zoe Swarzenski, “New Recompete awards seek to jump-start economic renewal, from Rust Belt to rural places” (Washington: Brookings Institution, 2024), available at https://www.brookings.edu/articles/new-recompete-awards-seek-to-jump-start-economic-renewal-from-rust-belt-to-rural-places/. The flexible and generous per-capita funding of the Recompete Pilot Program led to record numbers of applications from places throughout the country, including many rural communities. But the small-scale pilot nature of the program meant that almost all of this demand for such aid was unserved by the program’s current funding levels.