What happened to the job ladder in the 21st century?

The job ladder, Veer.com

A few weeks ago, we published an analysis showing that the lowest-paying industries saw the largest increases in workers with a college degree between 2000 and 2014. Today, we follow that up by showing that the pattern is similar among young workers ages 19 to 34 (as opposed to workers with a college degree), but with one big difference—the oil, gas, and mining resource extraction and refining industries, which pay relatively well, saw a substantial increase in the share of young workers hired.

Considered alongside our previous results, this new analysis implies that resource extraction and refining industries provided an outlet for young workers without college degrees to attain well-paying employment. These industries profited from the development of hydraulic fracturing and other new technologies, as well as a worldwide boom in demand for natural resources that seems to have reversed since late 2014.

Figure 1

But these young adults working in the high-paid extraction and refining sectors obscures the larger picture of the U.S. job ladder: Outside those industries, young workers are increasingly being hired into low-paying ones. That is important to document because, as we discussed in our previous column, the education level for most workers in the U.S. Census Bureau’s Quarterly Workforce Indicators database is imputed rather than observed directly—and that imputation is potentially faulty since it is based on the 2000 Census. In contrast, the age of workers is observed directly for the vast majority of workers.

Figure 2

Looking at the share of young workers hired in each quarter between 2000 and 2014 yields further insight, which our colleague Kavya Vaghul discussed in part in her column last week on the impact of student debt on economic security. It divides industries into thirds based on their average earnings in 2000, then traces the share of hires in each industry that went to young workers. The share of young workers hired in high-paying industries shrank right at the onset of the Great Recession, while in its aftermath that share grew in low-paying ones. (See Figure 3.)

Figure 3

These findings are consistent with previous findings on the evolution of the job ladder during and after the Great Recession of 2007-2009, though our analysis indicates that the job ladder had already started deteriorating even before that, following the recession of the early 2000s.

The labor market has always been characterized by what economists call a “last in/first out” or “last hired/first fired” structure, meaning that workers who are laid off during recessions are generally those with the shortest job tenure, many of whom tend to be young. We also know that high-paying firms exhibited the greatest decline in hiring during the Great Recession. In combination, these two patterns imply that young adult workers disproportionately lost out at high-paying firms and industries, which is what the darkest green line in Figure 3 shows.

Following the Great Recession, employment grew most in low-wage jobs, so that is where young adults entering the workforce could find work—even if they had a college education. And because the high-wage firms and industries aren’t hiring, many of these workers are stuck in low-wage jobs. That failure of the job ladder portends dire consequences for young workers’ lifetime earnings since the peak years for job-switching and wage growth are the early ones. If these workers do not find opportunities to climb, then they will potentially be stuck on the lower income rungs for the rest of their lives.

Appendix

The construction of the U.S. Census Bureau’s Quarterly Workforce Indicators, the data from which these charts are constructed, is discussed in the appendix to our previous column. To make these charts on young adult workers’ share of hires, we define “young adult workers” as QWI age groups 2, 3, and 4 (comprised of workers ages 19 to 34), and we exclude groups 1 (ages 14 to 18) and 8 (ages 65 to 99) from the analysis entirely. Industry average earnings of full-quarter hires in 2000, or EarnHiraS, are deflated to 2014 dollars using the U.S. Consumer Price Index for all Urban Consumer, or CPI-U. When industries are divided into thirds according to earnings levels in Figure 3, the three groups are weighted by employment so that each group corresponds to approximately one third of the total U.S. workforce.

The observations excluded between Figures 1 and 2 are the North American Industrial Classification System (three-digit) industries 211 (Oil and Gas Extraction), 212 (Mining except Oil and Gas), 213 (Support Activities for Mining), and 324 (Petroleum and Coal Products Manufacturing, including Oil Refineries).

The pernicious effects of growing student debt on the economic security of young workers

Student debt illustration by David Evans, Equitable Growth

Student loans in the United States are now the second-largest source of debt, totaling $1.1 trillion shared among 42 million people with no sign of slowing down. Unfortunately, many questions about student debt, the characteristics of borrowers, and the nature of delinquency remain unanswered, primarily because agencies and researchers alike lacked access to the rich data in the U.S. Department of Education’s loan portfolio.

That changed last week when Adam Looney of the U.S. Department of the Treasury and Constantine Yannelis of Stanford University released an impressive new report that makes use of administrative data on student borrowing and earnings from linked, de-identified tax records to explore the student debt terrain.

Student debt nearly quadrupled over the past 15 years, and Looney and Yannelis find that the accelerated growth is largely due to a new type of borrower: students attending for-profit colleges. During the Great Recession, the number of students attending for-profit universities grew significantly in response to poor employment opportunities and a weak labor market. As a consequence, the number of borrowers grew too. Looney and Yannelis find that most of these “non-traditional” borrowers are vulnerable individuals who mostly come from lower-income backgrounds. Although average loan balances for borrowers who graduate from for-profit schools are smaller than those of nonprofit undergraduates or graduate students, these for-profit students face worse labor market opportunities, lower earnings, and, ultimately, much higher delinquency rates than their traditional college counterparts.

But just because the student loan crisis is concentrated among non-traditional borrowers does not mean that students attending a selective, non-profit, four-year university have it easy: The current labor market is not kind to young workers, even with traditional college degrees.

Young workers rely on job-to-job flows—transitioning between jobs to find better offers—in order to build their careers, move up the job ladder, and grow their earnings. Low unemployment allows workers to quit their jobs to search for more fruitful employment. When the labor market contracted during the Great Recession of 2007-2009, however, these job-to-job flows fell. Economists Giuseppe Moscarini of Yale University and Fabien Postel-Vinay of University College London find that during the recession, the jobs ladder shut down, trapping young workers in low-wage jobs. (See Figure 1.)

Figure 1

The danger for recent college graduates is that carrying a large load of student debt requires young people to remain employed, even at jobs that don’t pay well, and hence restricts their ability to search out better opportunities for long-term earnings growth.

Joseph Altonji, Lisa Kahn, and Jamin Speer of Yale University report that all recessions have a damaging long-term effect on recent college graduates no matter what they majored in. For the average major, a recession means a 10 percent reduction in earnings in their first year out of college. In past recessions, high-paying majors such as engineering were less adversely affected, but in the Great Recession, even an engineering degree wasn’t sufficient protection. The three researchers find that between 2007 and 2009, the effect of unemployment on earnings halved the relative advantage that a high-paying major previously guaranteed.

So if young, traditional college graduates are being challenged by the post-recession labor market, what happens when high levels of student debt are thrown into the mix? In a recent paper, Emmanuel Saez and Gabriel Zucman of the University of California-Berkeley find that between 1986 and 2012, the wealth of the bottom 90 percent of the wealth distribution in the United States didn’t grow at all. With the little wealth that is, it’s unlikely that recent graduates with large student debt are able to accumulate any savings after servicing their student debts. In fact, the Pew Research Center’s tabulations of the Survey of Consumer Finances show that college-educated householders under 40 who have student debt have one-seventh of the wealth of people who don’t.

Student debt is a long-term burden in other ways too. Paying off college loans displaces other costs associated with our traditional perception of U.S. adulthood and the economic life-cycle. Economists David Cooper and J. Christina Wang of the Federal Reserve Bank of Boston find that homeownership rates among college graduates ages 30 to 40 are lower for households with student debt. Similarly, other studies show that car ownership and marriage rates are also lower for young student borrowers.

As the student debt load grows for young borrowers, it is clear there may be long-term effects on young workers’ economic security. Just a generation ago, higher education was considerably more affordable or at least heavily subsidized by state governments, enabling young workers to begin saving and eventually realize the American Dream. But now, higher education is a transformative economic burden for the young workforce. And for the amount of student debt that graduates face upon entering the workforce, higher education certainly has not yielded commensurate benefits.

Comments on proposed U.S. overtime regulation

Photo of clock by A. Strakey, flickr, cc

In the Notice of Proposed Rulemaking (NPRM) RIN 1235-A111, DOL proposes to increase and automatically update the salary threshold for exemptions from overtime protections under the The Fair Labor Standards Act (FLSA). I observe in the comments below that DOL understates the economic benefits of the proposed threshold and that the proposed level is consistent with the historical growth in prices and economic output.

In its analysis of the effect of the proposed rule on hours worked, DOL understates the benefits to the workforce by failing to account for employers’ tendency to hire additional workers and to schedule non-overtime work in response to the rule change. Footnote 120 of the NPRM acknowledges that the substitution of overtime hours to non-overtime hours is a possibility, and that DOL understandably “did not have credible evidence to support an estimation of the number of hours transferred to other workers.” Yet it should be noted that this possibility is actually an implication of the fixed-wage model that partially underlies DOL’s analysis.

Ignoring this consequence of the economic model underlying DOL’s analysis causes the NPRM to overestimate the total reduction in economy-wide hours due to the proposed rule, at least in the short run. In particular, when the overtime premia threshold is raised, employers will substitute away from overtime hours and either hire additional workers or schedule additional hours for workers below the 40-hour threshold. Indeed, the fact that there is a spike of 40 hours in the distribution of weekly hours is consistent with the idea that firms substitute away from overtime hours. Moreover, private-sector analyses such as those by the National Retail Federation (2015) and Goldman Sachs (2015) predict increases in employment as employers hire additional workers to work non-overtime hours. This substitution toward non-overtime hours is necessarily implied by the fixed-wage model when output is constant, say in the very short run or in an economy with a large degree of excess capacity. Any offsetting increase in non-overtime hours will be smaller over the medium- to long-term, when both output and capital adjust more easily.

The possibility that some individuals will see increased employment through the extensive or intensive margins has important welfare considerations ignored by the NPRM. Based on empirical evidence describing the extent of overwork in the United States, the NPRM correctly concludes that the proposed rule may improve welfare because it “may result in increased time off for a group of workers who may prefer such an outcome.” At the same time, although many workers in the United States are overworked, a sizable portion of the labor force does not work as many hours as desired (Golden and Gebreselassie 2007; Jacobs and Gerson 2005). Footnote 135 of the NPRM states that the lack of existing scholarly studies precludes quantifying any increase in employment or hours due to the rule, but DOL should make clear that under certain conditions the fixed-wage model underlying their analysis implies that some workers will see an increase in hours. If these workers are under-employed, the shift in the composition of those hours from over-worked to under-worked employees will be a welfare-improving consequence of the proposed rule.

In its calculation of the monetary benefits of reducing hours, the NPRM fails to account for significant externalities associated with high levels of hours worked. The NPRM approximates the benefit an affected worker receives for an hour of additional leisure by the average hourly wage, but this approximation understates the social benefits when the social and private costs of work differ. Some empirical work calculates that longer work hours entail greater energy consumption and consequentially more environmental damage (Rosnick and Weisbrot 2006). And economic theory suggests that long work hours may be detrimental both within and outside of the household (Gersbach and Haller 2005; Folbre, Gornick, Connolly, and Muzni 2013). In a separate section on health benefits of the proposed rule, the NPRM also effectively acknowledges the existence of these externalities cited above, stating that the rule will not only benefit the worker’s welfare through its positive health effects but also “their family’s welfare, and society since fewer resources would need to be spent on health.” Although the NPRM states that its wage-based approximation may overestimate the social benefits of fewer hours worked because not all workers will prefer to reduce their hours, the exclusion of important externalities causes the NPRM to underestimate some benefits of reducing hours.

The NPRM also understates benefits by excluding the possibility that an updated salary threshold will improve pay for hourly workers who are not paid overtime, even when they should be. Rohwedder and Wenger (2015) find that 19 percent of hourly workers are not paid a premium for working overtime hours. While it is unclear if all of these workers are legally required to receive overtime payments (due to occupational exemptions), many of them are not receiving pay promised under the FLSA. The proposed, transparent update to the salary threshold will provide employers an opportunity to revisit whether their employees are paid according to the law.

Finally, the proposed threshold for the overtime weekly salary exemption appears to be consistent with a range of economically appropriate levels. The NPRM proposes raising this threshold to approximately $921, or the 40th percentile of the weekly earnings distribution of salaried employees working full-time. This level is appropriate because it is similar to the exemption threshold that already applied in 1975, after adjusting for inflation ($250 in 1975 dollars, or approximately $1,000 per week in 2014 dollars.). Yet if the labor market’s capacity to bear this regulation is determined by productivity, then this threshold is almost certainly too low. Since 1975, real productivity has grown by more than 72 percent, suggesting an overtime weekly salary threshold of at least $1,720, well exceeding the proposed rule.


Ben Zipperer

Research Economist

Washington Center for Equitable Growth

1333 H St., NW

Washington, DC  20005


References

Folbre, Nancy, Janet Gornick, Helen Connolly, and Teresa Munzi. 2013. “Women’s Employment, Unpaid Work, and Economic Inequality,” in Janet Gornick and Markus Janti, editors, Income Inequality: Economic Disparities and the Middle Class in Affluent Countries, Redwood City CA: Stanford University Press.

Golden, Lonnie and Tesfayi Gebreselassie. 2007. “Overemployment mismatches: the preference for fewer work hours.” Monthly Labor Review. April.

Gersbach, Hans and Hans Haller. 2005. “Beware of Workaholics: Household Preferences and Individual Equilibrium Utility.” IZA Discussion Paper. February. http://ftp.iza.org/dp1502.pdf

Goldman Sachs Global Macro Research. 2015. “The New Federal Overtime Rules: A Greater Effect on Payrolls than Pay.” July 7.

Jacobs, Jerry, and Kathleen Gerson. 2005. The Time Divide: Work, Family, and Gender Inequality. Cambridge MA: Harvard University Press.

National Retail Federation. 2015. “Rethinking Overtime.” https://nrf.com/sites/default/files/Documents/Rethinking_Overtime.pdf

Rohwedder, Susann and Jeffrey B. Wenger. 2015. “The Fair Labor Standards Act: Worker Misclassification and the Hours and Earnings Effects of Expanded Coverage.” http://www.rand.org/content/dam/rand/pubs/working_papers/WR1100/WR1114/RAND_WR1114.pdf

Rosnick, David and Mark Weisbrot. 2006. “Are Shorter Hours Good for the Environment? A Comparison of U.S. & European Energy Consumption.” Center for Economic and Policy Research. December. http://www.cepr.net/documents/publications/energy_2006_12.pdf

The cruel game of musical chairs in the U.S. labor market

Musical chairs by Paolo, flickr, cc

Last year, our colleague Elisabeth Jacobs referred to the fate of young people in today’s slack labor market as “a cruel game of musical chairs” because there aren’t enough jobs to employ everyone at their full earning potential. Workers with college degrees tend to win out in the competition for the few jobs that are available, but many must settle for lower-paying jobs than similarly credentialed workers entering the workforce in previous decades. Those without college degrees, in turn, are driven into even lower paying work or pushed out of the labor market entirely. Economists refer to this phenomenon as “filtering-down,” with the best-educated workers increasingly filling jobs lower and lower on the job ladder.

The dire experience of these workers with college degrees displacing workers with less formal education stands in strong contrast to the widelyheld view in economic and policymaking circles that the main problem facing the U.S. economy is a shortage of highly-educated workers. If college-educated workers were in short supply, then we would expect their wages to rise as employers attempted to lure them away from their competitors. Yet the inflation-adjusted value of the wages of college-educated workers has barely increased in the 21st century.

What’s more, between 2000 and 2014 (the last year for which complete data are available), the employment of college-educated workers has increased much more rapidly in low-earning industries than in high-earnings ones. If there weren’t enough college graduates to go around, then the opposite should be happening because high-earnings industries would presumably be outcompeting low-earnings industries to hire college-educated workers. Our new analysis of the data from the U.S. Census Bureau’s Quarterly Workforce Indicators strongly suggests that college-educated workers are more likely to “filter down” the job ladder than to climb it.

The QWI dataset is a comprehensive administrative source for information on flows in and out of employment, collecting information on total employment, hires, “separations” (workers either quitting their jobs, getting laid off, or fired for cause), and earnings. The data are disaggregated along many dimensions, including workers’ education level and the industries where they work. We can, for example, look at the share of employees in restaurants and bars that have a Bachelor’s degree or more, or the share of workers on Wall Street who have less than a high school degree.

Our analysis examines the average earnings of workers in the 91 industry groups—identified by their 3-digit coding in the North American Industrial Classification System–which together account for nearly all employment in the United States, alongside the share of workers in each industry with a college degree or more. While not definitive, the most striking finding is that the industries with the lowest earnings for all employees are experiencing the largest increases in the share of workers with a college education or higher. Our analysis, for example, finds that 16.3 percent of all workers who work in restaurants and bars in the United States have attained a Bachelor’s degree or more, compared to 14.2 percent in 2000. In contrast, high-paying industries such as the financial sector saw their share of college-educated workers decrease, from 65.2 percent in 2000 to 56.1 percent in 2014 (See Figure 1).

Figure 1

08XX15-filtering-down-01-3

This “filtering down” trend in the employment of college-educated workers is even more acute when we look at recent hires rather than overall employment. The trend line over 2000-2014 is even more steeply downward sloping for hires than for all employees, highlighting the cruel game of musical chairs. In short, a college degree is becoming increasingly less predictive of employment in a high-earnings industry. (See Figure 2.)

Figure 2

If instead of plotting the change in employment of college-educated workers or the change in recent hires of college-educated workers on the vertical axis—as we have done in Figures 1 and 2—we had alternatively plotted the share of college-educated workers in total employment, or the share of college-educated workers in recent hires, then we would see that industries with higher average earnings tend to employ more credentialed workers. In other words, the trend line we would see in the alternative charts would slope up, not down. Findings of that kind, which depict the higher average earnings of college-educated workers, are typically trumpeted as evidence that the only thing preventing young, under-employed workers from finding a good job is their lack of a Bachelor’s degree. But what our analysis demonstrates is that this relationship has gotten less positive since 2000. (See the data appendix below for a complete description of the data and our methodology.)

This means that the changing share of workers with a college degree or more across industries is unlikely to be due to “skill-biased technical change” in low-earnings industries, since by and large workers in those industries are less prone to technological substitution. Think bartenders and busboys. Those workers perform what economists call “non-routine, manual” tasks that can’t easily be performed by pre-programmable machines. Nor does the rise in the share of college-educated workers in lower-paying industries merely reflect that there were fewer such workers in these industries prior to 2000, because the same trend is true among recent hires as among employees overall.

Finally, the increased hiring of workers with college degrees has not boosted the relative pay in those low-paying industries. The patterns are quite similar whether we calculate industry average earnings in 2000 or in 2014 because average earnings across industries haven’t changed very much. What’s changed is the education mix of workers.

The implication of all of these findings is that the U.S. labor market doesn’t lack for college-educated workers. Workers who have degrees are already taking jobs further and further down the job ladder. Encouraging or subsidizing higher education attainment will not solve the fundamental problem facing workers in the current job market: There are not enough jobs.

Data appendix

The U.S. Census Bureau’s Quarterly Workforce Indicators is a comprehensive administrative dataset of employment “matches,” meaning labor market relationships between employers and employees. The existence of a match (employment), the beginning of a match (hires), and the end of a match (separations) are observed in a given quarter, along with average earnings of workers in each group of hired workers, employed workers, and separated workers. The QWI is disaggregated by geography, industry, and many demographic characteristics, including, for our purposes, education attainment (discussed more completely below).

There are two predominant underlying sources of the QWI data: U.S. Census data and state unemployment insurance filings by businesses. QWI is the publically available version of a dataset called Longitudinal Employer-Household Dynamics, or LEHD, which follows individual workers from job to job over the course of their careers. QWI, however, does not track individual workers over time. Instead, quarter-by-quarter, it counts up all the flows described in the previous paragraph, for each detailed sub-population and employer category.

Because state-provided data from the unemployment-insurance system are critical to constructing LEHD and hence the QWI, and because states only began to participate in the LEHD at different points in time, the data are available as an unbalanced geographic panel. Every state except Massachusetts is currently providing data to the program, but the start dates vary by state. Enough states have joined by about 2000 that the literature has labeled QWI nationally representative from that point forward, which covers all the data reported in this exercise. We aggregate the data across states to create our industry-education disaggregation.

LEHD does not actually observe the education levels of most workers. For those it does not observe, education is imputed from other worker characteristics using Census Bureau microdata (mostly from the 2000 Decennial Census). That is the most likely reason why the QWI-reported share of college-educated workers has decreased by slightly more than one percentage point overall, and by substantially more in some industries. The imputation procedure works best around the date when its source data was collected (2000), and increasingly less well as we get further away from that date. The Current Population Survey, a representative sample of the population collected continuously, reports that the overall share of college-educated workers in the economy increased by approximately five percentage points between 2003 and 2012, and has only declined by a small amount in a very few industries.

The education imputation in QWI complicates the inference from exercises such as the one we present here, because the whole point of our interpretation is that educational attainment has become less predictive of workers’ experience in the labor market, and in particular, of their earnings, as better-educated workers are forced to take worse jobs. The effect of the data imputation, however, is most likely to mute the phenomena we highlight: if credentialed workers are taking jobs further down the labor market hierarchy, then workers who take jobs further down the hierarchy than they did in the past would be more likely to be misidentified as lacking educational qualifications. For that reason, we believe the imputation of education data means that our results understate the effect of filtering-down.

Tentative confirmation for this can be found in a regression of the change in the share of young workers on industry average earnings, which yields an even-more-sharply negative slope than Figures 1 and 2. In other words, young workers are filtering down the labor market even more starkly than BA-educated ones, according to QWI. Since young workers are more likely to have college degrees than retirees, the education-based regressions we present here probably understate the cruelty of the cruel game of musical chairs.

In order to construct Figures 1 and 2, we use a NAICS 3-digit Industrial Sector disaggregation of the QWI’s 2015Q3 Sex by Education files with all firm size and age categories for all available states and the District of Columbia. The data are smoothed using a four-quarter moving average, and nominal earnings are adjusted for inflation (to 2014 dollars) using the Consumer Price Index for all Urban Consumers, or CPI-U. We use the “stable jobs” concept, meaning only “full-quarter employment” is counted. A worker is “full-quarter employed” at a given match if and only if that worker has positive earnings from that match in the quarter itself and (at least) the ones preceding and subsequent. (Similarly, a “full-quarter hire” is one in which positive earnings are observed in the preceding, current, and subsequent quarters but not two-quarters-ago.)

The dependent variables in the regression are calculated from either EmpS or HiraS (for employment and hires respectively), and the dependent variables are correspondingly EarnS or EarnHiraS. We use the education category corresponding to a “BA or more” to calculate college-educated shares of employment and hires, and we exclude workers aged 24 or under since QWI does not report education attainment for that age group. (See Figure 3.)

Figure 3

The raw data and the Python script we used to clean and reshape the raw data are available at Equitable Growth’s GitHub.

The Declining Labor Force Participation Rate: Causes, Consequences, and the Path Forward

Elisabeth Jacobs, Senior Director for Policy and Academic Programs, Washington Center for Equitable Growth, testifying before the United States Joint Economic Committee on “What Lower Labor Force Participation Rates Tell Us about Work Opportunities and Incentives”

I would like to thank Chairman Coats, Ranking Member Maloney, and the rest of the Committee for inviting me here today to testify.

My name is Elisabeth Jacobs and I am Senior Director for Policy and Academic Programs at the Washington Center for Equitable Growth. The center is a research and grant-making organization dedicated to understanding what grows our economy, with an emphasis on understanding whether and how economic inequality impacts economic growth and stability.

I am pleased to be here today to address an important topic for understanding the health of the labor market and the economy overall: the labor force participation rate, which currently stands at 62.6 percent. The continued decline of the unemployment rate since 2010 is the most commonly cited piece of evidence that the labor market is recovering. Indeed, it is undeniable that the labor market has improved considerably in the years since the Great Recession, as unemployment has fallen to 5.3 percent, its lowest rate in seven years. Despite this progress, however, the labor market remains troubled. Simply relying on the unemployment rate as an indicator of the health of the job market masks underlying problems, many of which have persisted for decades. In order to fully understand the current state of the labor market, policymakers need to take into account not just the unemployment rate, but also other indicators of how the labor market is functioning, including the labor force participation rate.

My testimony draws five major conclusions:

    • The labor market is recovering from the deepest economic downturn since the Great Depression. The private sector has added 12.8 million private-sector jobs over 64 straight months of job growth, the longest streak of private-sector job creation on record. The unemployment rate is down to 5.3 percent, a seven-year low.
    • While the labor market is on the mend, looking solely at the falling unemployment rate overstates that recovery. Other indicators of labor market health, including the labor force participation rate, suggest that there is more work to be done.
    • The decline in the labor force participation rate predates the Great Recession and is mainly the result of several structural changes in the labor market, including the aging of the workforce.
    • Recent declines in the labor force participation rate that are not explained by long-standing structural changes are largely due to persistent business cycle effects. Five years into the labor market’s recovery from the most severe recession in recent history, demand remains slack.
    • Policy can play an important role in boosting the labor force participation rate, but policymakers need to focus on the correct levers. Persistent slack demand suggests that fiscal and monetary policies are an important first step. In the absence of political action on those fronts, however, family-friendly policies and criminal justice reform are important options.

The rest of my testimony will 1) discuss recent trends in the unemployment rate and other measures of the health of the labor market, 2) examine the potential reasons for the long-run decline in the labor force participation rate, and 3) review the research on the trends in the labor force participation rate since the Great Recession. I conclude by suggesting key implications for policy moving forward.

Download the full pdf for a complete list of sources

Trends in the unemployment rate and the health of the labor market

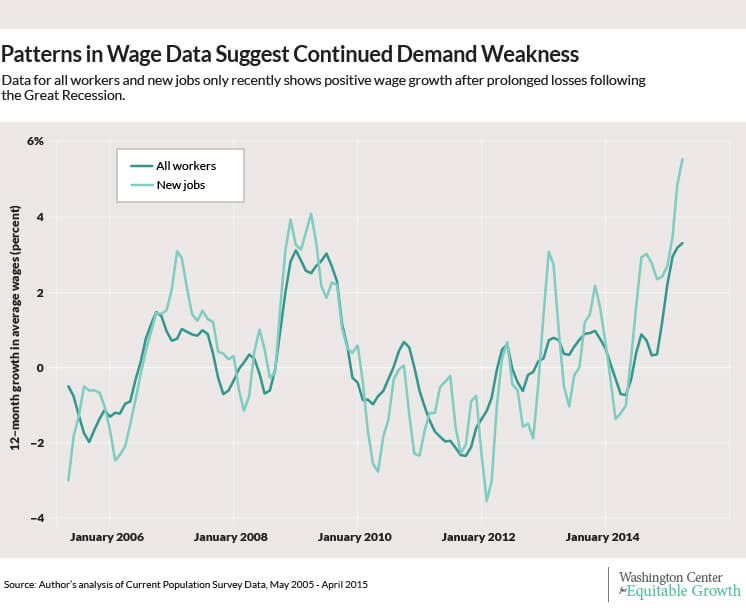
The Great Recession’s impact on the labor market was devastating. In December 2007, the month the recession began according to the National Bureau of Economic Research, the unemployment rate was 5 percent. By the end of the recession, in June 2009, the unemployment rate hit 9.5 percent and continued to climb until it peaked at 10 percent in October 2009. Over the past five and a half years, the labor market has made substantial progress back toward where it was before the financial crisis. The economy is in the midst of the longest streak of private-sector job growth on record, with 12.8 million jobs created over 64 straight months. The most notable headline has been the continued downward trajectory in the unemployment rate. Joblessness as defined by the official unemployment rate has been on the decline more than 5 years, and stood at 5.3 percent in June, according to the latest data from the Bureau of Labor Statistics. Indeed, an observer looking solely at the unemployment rate might conclude that the labor market is roughly as healthy as it was prior to the Great Recession. (See Figure 1.)

Figure 1

lfpr-testimony-01

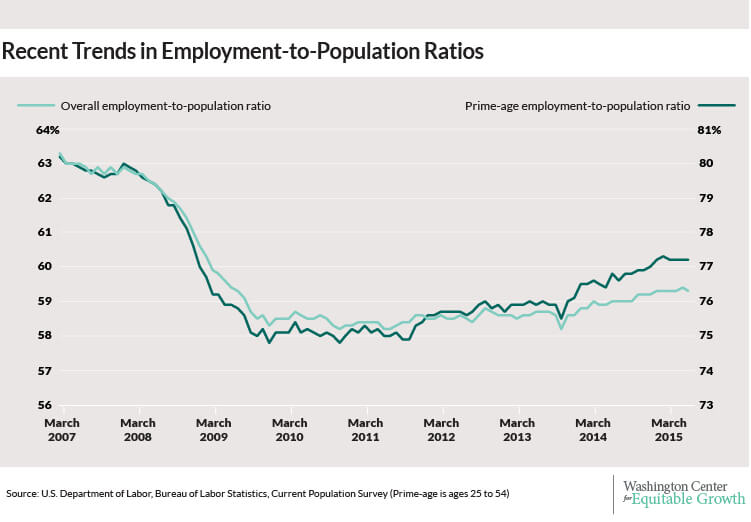
Yet, other measures of the labor market tell a more complicated story. Consider the employment-to-population ratio, which is the share of the total population currently employed. Whereas a decreasing unemployment rate is a sign of improvement in the labor market, an increasing employment ratio can be an even stronger signal of improvement. Unfortunately, the trend in the employment ratio is less sanguine than trend in the unemployment rate.

The employment ratio plummeted during the Great Recession, unsurprisingly. In December 2007, the employment ratio was 62.7 percent, and it fell to a nadir of 58.2 percent in November 2010. The share of the population currently employed has improved over the course of the recovery, and has been growing for just under four years, reaching 59.3 percent in June. Yet it remains 3.4 percentage points below its level prior to the Great Recession, suggesting continued weakness in the labor market. A second key point to keep in mind is that, like many indicators of underlying labor market health, the downward trajectory of the employment ratio pre-dates the Great Recession. The employment ratio peaked in December 2006, a year before the financial crisis, and was higher still in April 2000, when it hit 64.7 percent.

The prime-age employment ratio, or the share of the total population between the ages of 25 and 54 years old with a job, has followed a similar trajectory. Its pre-recession peak, in December 2007, was 79.7 percent. But the prime-age employment ratio was just 77.2 percent in June, a current gap of 2.5 percentage points. The labor market has made considerable gains in the light of the worst recession since the Great Depression. But looking at these employment-to-population ratios is one indication that reveals how those gains are incomplete. (See Figure 2.)

Figure 2

lfpr-testimony-02

Why does the unemployment rate indicate a more complete labor market recovery than does the employment rate? The answer has to do with the intertwined and complicated relationship between the unemployment rate and the labor force participation rate.

The unemployment rate is calculated by the Bureau of Labor Statistics using the Current Population Survey, or CPS, a survey that interviews a sample of households every month and details information about individuals over the age of 16. Individuals who had a job during the week they were interviewed are counted as employed. But not all workers who lack a job are counted as unemployed. According to the CPS, a worker is only officially unemployed if she lacks a job, has actively searched for a job in the last four weeks, and is available to work. Employed workers and officially unemployed workers are together the “labor force.” Any worker without a job who is not counted as officially unemployed is considered to be “not in the labor force.” The official unemployment rate is then calculated by dividing the number of officially unemployed by the labor force. It is an important measure of labor market health because of the clarity of what’s being counted: the unemployment rate is a clear indication of the share of Americans who are actively looking for work. The labor force participation rate is the labor force divided by the total population.

When we think about the unemployment rate declining, we usually think of a situation where an unemployed worker gets a job, moving from unemployment to employment. The ranks of the unemployed would decline, while the size of the labor force would stay the same. The result would be a lower unemployment rate. But the unemployment rate could decline in another way. An unemployed worker could drop out of the labor force, reducing the size of both the number of officially unemployed workers and the labor force. This also would also lead to a decline in the unemployment rate.

An example can help clarify this point. Imagine a labor market with 150 potential workers: 95 are employed, 5 are officially unemployed and 50 are not in the labor force. The official unemployment rate would be 5 percent (5 unemployed workers divided by a labor force of 100 workers.) If one of the unemployed workers got a job, then the unemployment rate would decline to 4 percent (4 unemployed workers divided by a labor force of 100 workers). But if instead an unemployed worker retired and left the labor force, then the unemployment rate would decline to 4.04 percent (4 unemployed workers divided by a labor force of 99 workers). In the first case, the labor force participation rate would stay the same at 66.7 percent (100 divided by 150), but in the second case it would drop to 66 percent (99 divided by 150).

So trends in the unemployment rate are intimately tried to trends in the labor force participation rate. While the decline in the labor force participation rate was particularly stark during the Great Recession, the trend predates it. It’s to the long-term term that I now turn.

The long-run decline in the labor force participation rate

The Bureau of Labor Statistics has been keeping track of the labor force participation rate since January 1948, when the rate was just 58.6 percent. Labor force participation stayed at about this level until 1965 when it began a climb that would last 35 years, until it peaked in April 2000 at 67.3 percent. What caused the steady increase in the rate? Looking at the difference in labor force participation by gender reveals the answer. (See Figure 3.)

Figure 3

lfpr-testimony-03

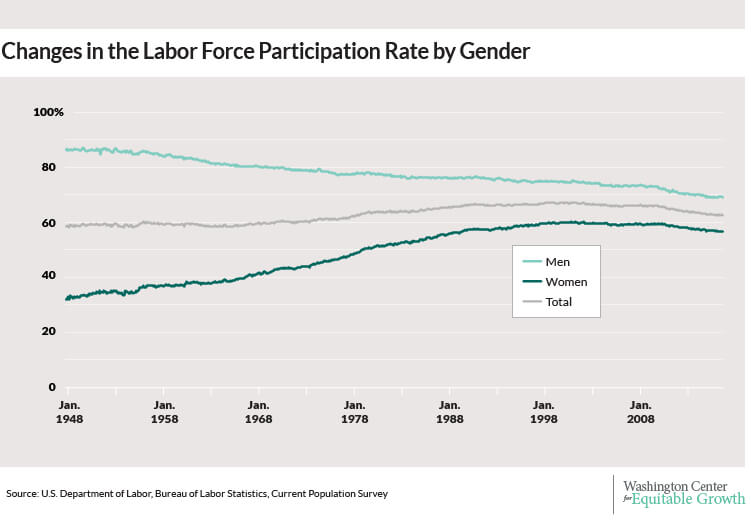
The labor force participation rate for men has been on a downward trajectory for nearly 60 years, almost from the moment the agency started keeping track of the statistic. In January 1948, male labor force participation was 86.7 percent. By April 2000, when overall labor force participation peaked, male labor force participation had fallen to 74.9 percent. For women, the trend has operated in precisely the opposite direction. In April 1948, the participation rate for women was 32 percent. Female labor force participation steadily increased for the next half century, peaking at 60.3 percent in April 2000. Over the second half of the 20th century, women moved into the labor force—and were increasingly likely to stay there, even after becoming mothers. This sea change in women’s labor force participation is what helped buoy the overall labor force participation rate, even as men were increasingly less likely to be in the labor force.

Since 2000, however, the growth in women’s labor force participation has stalled out. Men’s labor force participation has continued to decline. So the question remains: what is responsible for the decline beginning in 2000?

The clearest cause of the decline in the overall labor force participation rate is the aging of the population. The Baby Boom generation, born between 1946 and 1964, is a large cohort of workers whose retirement age coincides with decline in labor force participation that began in 2000. As these workers retired, they left the labor force and in turn pushed down the total labor force participation rate.

At the same time, the participation rate for younger workers  (age 16 to 24 years) has been on the decline for decades as well. The downward trend in labor force participation for younger Americans is explained by increased schooling: younger workers are more likely to stay in school longer, as college attendance has become substantially more common. So, a positive development—increased educational attainment—pushed down the labor force participation rate.

Yet the demographic shifts described above cannot explain the entire decline in the labor force participation rate. Prime-age workers’ labor force participation has also been on the decline. The rate of participation for workers ages 25 to 54 declined from 84.4 percent in April 2000 to 83.1 percent in December 2007, on the eve of the Great Recession.

Women’s labor force participation was driving the overall upward trend in labor force participation through 2000, so the plateau and then decline in women’s participation in the ensuring years is an important factor for explaining the national trend. Understanding why women’s labor force participation has stalled is key to reversing the downward trends in the national rate. In 1990, the United States had the sixth-highest female labor force participation rate amongst 22 high-income OECD countries. By 2010, its rank had fallen to 17th. Why have other high-income countries continued their climb while the United States has stalled? Research by economists Francine Blau and Lawrence Kahn suggests that the absence of family-friendly policies such as paid parental leave in the United States is responsible for nearly a third of the U.S. decline relative to other OECD economies. As other developed countries have enacted and expanded family-friendly policies, the United States remains the lone developed nation with no paid parental leave.

Trends in labor force participation since the Great Recession

While labor force participation was declining before the Great Recession, the downward trend accelerated during the economic crisis. The raw data cannot tell us how much of the decline since the end of 2007 is a continuation of the longer-term trends discussed above, and how much of the decline is due to the lingering effects of the Great Recession. Untangling these two trends—the structural and the cyclical—has become an important and highly contested debate amongst economists and other labor market analysts.

Some research on the recent decline argues that a large portion was due to the structural forces in place before the recession, and concludes that not much of the current lower rate is due to weakness in the labor market due to the Great Recession. A 2014 study by economist Stephanie Aaronson and her colleagues finds that the majority of the decline is due to structural forces. According to their calculations, cyclical weakness is responsible for pushing down the labor force participation rate between 0.24 and 1 percentage point in the second quarter of 2014. In June 2014, the participation rate was about 3 percentage points below its pre-recession level, meaning the recession was only responsible for, at most, one-third of the lower rate.

Other research finds a much larger role for the recession, albeit over a different time frame. A 2012 study by economist Heidi Shierholz finds that only one-third of the decline between 2007 and 2011 was due to structural factors and the other two-thirds of the decline was due to the cyclical impact of the Great Recession.

An analysis from White House Council of Economic Advisers finds a result somewhere in the middle of these two estimates. The CEA, using conservative estimation techniques, concludes that about half of the decline from 2007 to the middle of 2014 is due to the aging of the population, one-sixth is part of a cyclical decline consistent with what we would expect given previous recessions, and the final third is a combination of other structural trends from before the recession and “consequences of the unique severity of the Great Recession.”

So, while there is room for the rate to move upward as the economy strengthens, long-term forces will continue to exert downward pressure on labor force participation. So far in 2015, the labor force participation rate has been holding fairly steady, moving sideways instead of downward. While the June report saw a 0.3 percentage point decline in the participation rate, we should be cautious about drawing conclusions from this dip. The monthly CPS data are noisy, meaning that several months’ of consistent movement are necessary before concluding that a trend is in place. Drawing conclusions from last month’s numbers is particularly risky, due to an anomaly in the timing of survey data collected by the Bureau of Labor Statistics for the June report.

Policy implications moving forward

What are the implications for future policy? If policy makers want to raise the labor force participation rate, or at least keep it as high as possible, a variety of options belong on the table.

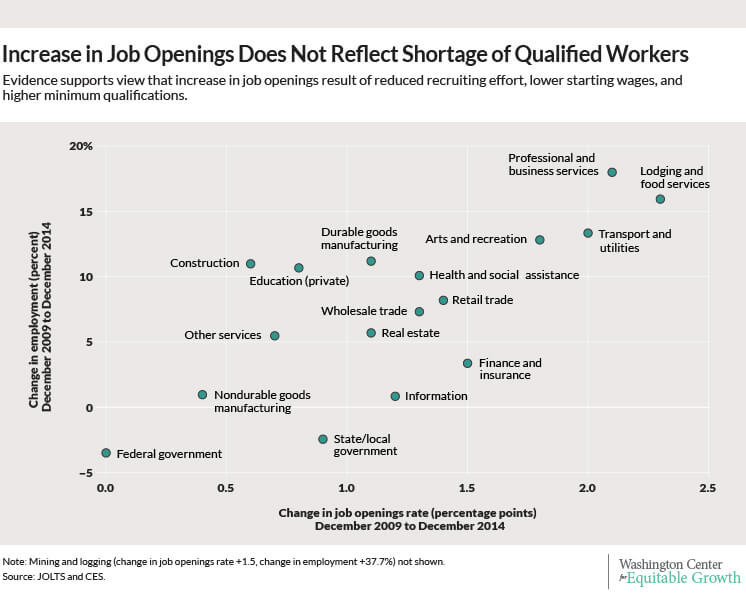
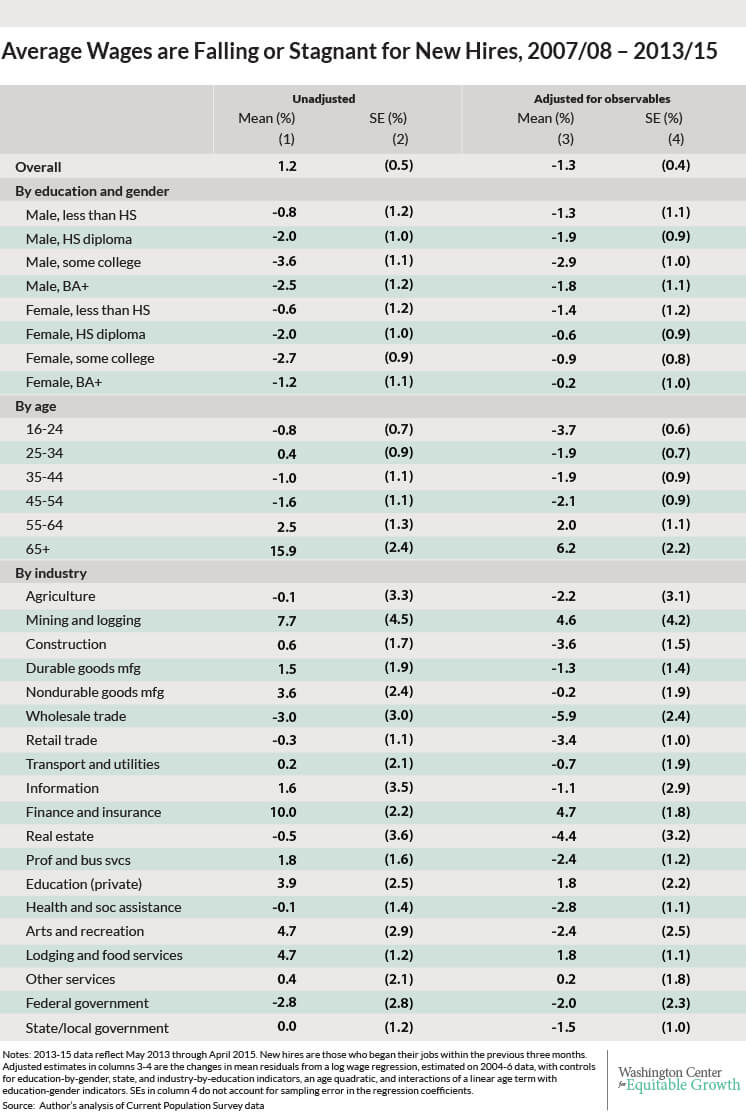
Fiscal and monetary policy that focuses on strengthening economic growth and prioritizing full employment can help boost the labor force participation rate. A new study from economist Jesse Rothstein finds lackluster employment growth across nearly all industries between 2009 and 2014, reflecting a continued shortage of demand for all workers. Stronger economic growth can help pull more workers into the labor force if they see higher wages being offered by employers. Doing so requires more stimulus through fiscal policy, such as increased infrastructure investment. According to the International Monetary Fund, boosting infrastructure spending can accelerate economic growth by 1.5 percent in the short-term. This increased growth would help create jobs and pull discouraged workers back into the labor force, as well as improving the health of the economy in the longer-term. More accommodative monetary policy also has immense potential to stimulate labor demand. Fiscal and monetary policies are immensely important, but smart microeconomic policies could help as well.

First, the absence of family-friendly policies in the United States is a key reason for the decline in the overall labor force participation rate and the stalling out of women’s labor force participation. The Mad Men Era is over, to the great relief of many women. But public policy has not kept up with the needs of working families, and balancing the competing demands of work and home remains a fundamental challenge for millions of households. Recent research suggests that the failure to adapt our policies to meet the demands of the modern American family means that women’s labor force participation has stagnated. Paid family leave, flexible scheduling, affordable high-quality childcare, and universal pre-kindergarten are all policies that could play a major role in jump-starting the engine of women’s labor force participation. By providing policies that recognize individuals’ dual roles as both workers and caregivers, we have the opportunity to attract and retain talent in the labor force.

The potential impact of paid family leave on the labor force participation rate is worth discussing in a bit more detail because of the demographic trends discussed earlier. Research suggests that paid parental leave can substantially improve mothers’ labor force participation, because it encourages them to return to their job following a period of bonding with a new baby. But caregiving extends beyond children, as anyone who has provided care for an aging relative well knows. The share of prime-age workers with eldercare responsibilities is increasing as the Baby Boom cohort ages. Unpaid family caregiving is the most common form of eldercare for people of advanced age. Nearly half of all individuals who provide eldercare are part of the “Sandwich Generation,” simultaneously responsible for both aging parents and young children. Paid family leave that allows workers to take temporary time off to care for a loved one—whether that loved one is a new child or an aging parent—is a potentially powerful tool for bolstering labor force participation.

A second proactive policy option to improve labor force participation is a criminal justice reform agenda that includes a reduction in the incarceration rate and policies to reduce discriminatory employment practices against those with criminal records. The U.S. incarceration rate is currently the highest in the world, a consequence of three decades of dramatic growth in the prison population. While the crime rate has fallen over the same period that the prison population has grown exponentially, research shows that the efficacy of increased incarceration as a crime control technique is virtually non-existent; crime rates rise and fall independent of incarceration rates since the 1990s. Coupled with the rise in incarceration, nearly one in three adults in 2010 had a serious misdemeanor or felony arrest that can show up on a routine background check for employment, and a substantial share of discouraged workers report a felony conviction. Nine in ten large corporations report that they conduct criminal background checks, and a wide range of research suggests that a criminal record (both felony and misdemeanor charges, regardless of age) plays a significant negative role in an individual’s employment prospects. New research by economist Michael Mueller-Smith shows that overly aggressive criminal justice policies can significantly reduce the labor force participation of individuals once they leave prison or jail.

Taken together, the impact of our nation’s current criminal justice policies suggest that reform could play a significant role in improving labor force participation. In the long run, reducing flows into the prison population could help boost the labor force participation rate. In the short-term, “ban the box” policies that remove the criminal history question from job applications and postpone the criminal background check until later in the hiring process could help pull some discouraged workers back into the labor force.

It is important to avoid being distracted by policies that have little to do with the trends in the labor force participation rate. Social Security Disability Insurance, or SSDI, for example, has been cited as a program that reduces the participation rate by discouraging work. Proponents of this hypothesis argue that more relaxed medical screening for disability and an increase in the program’s income-replacement rate have increased the disability rolls and pulled able-bodied workers out of the labor market. But studies suggest that the increase in the number of Americans receiving SSDI may be a simple matter of demographics. For instance, economist Monique Morrisey uses the demographic-adjusted disability incidence rate, which shows that after controlling for the aging of the population the rate for men has been on the decline for the last 20 years. At the same time, the age-adjusted rate for women has increased, but to a level similar to the age-adjusted rate for men. This analysis indicates that disability has not become more prevalent, but rather that the aging of the workforce has been the primary cause of the increase in SSDI receipt. Of course, policymakers may have other reasons for wanting to reform the disability insurance program, but we should not expect changes in SSDI to provide a major boost to the labor force participation rate.

Similarly, the Affordable Care Act has been cited as a program that could reduce the labor force participation rate and depress overall labor supply. To a certain extent, this is true. The Congressional Budget Office’s model predicts that workers will supply less labor once the five-year-old health care law is fully implemented in 2016. Note, however, that this reduction in labor supply is due to choices by the workers, not because of a reduction in employers’ demand for labor. Some of this decline in labor supply will come as a reduction in the hours worked by some workers, rather than a decline in the number of workers employed. In other words, the program may lead to an increase in voluntary part-time work. Data from the past several years shows just that trend: an increase in workers voluntarily working part-time. While the ACA may have impacts on labor supply, those effects generally reflect a positive outcome for workers.

Conclusion

Untangling the causes of causes of labor market trends is a tricky endeavor, particularly given the intersection of a long-run trend with the cataclysmic recession of 2007-2009. The drop in the labor market participation rate means that the unemployment rate overstates the extent of the labor market recovery. While the decline in labor force participation was underway decades before the Great Recession began, the downturn played a significant role in the accelerating the recent decline. Demographic forces, namely the aging of the population, are putting significant downward pressure on the labor force participation rate. While the primacy of demographics means limits the extent to which policies can impact increase labor force participation, this structural challenge does not mean that policy has no role to play. The trick for policymakers is to be strategic, and to pull the levers with the most potential to jump-start the labor market back into high gear.

The Great Recession and its aftermath: What role do structural changes play?

The last seven years have been disastrous for many workers, particularly for lower-wage workers with little education or formal training, but also for some college-educated and higher-skilled workers. One explanation is that lackluster wage growth and, until recently, high unemployment reflect cyclical conditions—a combination of a lack of demand in the U.S. economy and greater sensitivity of workers on the bottom-rungs of the job ladder to changes in the business cycle. A second explanation attributes stagnant wages and employment losses to structural changes in the labor market, including long-term industrial and demographic shifts and policy changes that reduce the incentive to work. This explanation interprets recent trends as the “new normal” and suggests that the U.S. economy will never return to pre-recession labor market conditions unless policies are changed dramatically.

My research, based on a review of extensive data on labor market outcomes since the end of the Great Recession of 2007-2009, finds no basis for concluding that the recent trend of stagnant wages and low employment is the “new normal.” Rather, the data point to continued business cycle weakness as the most important determinant of workers’ outcomes over the past several years. It is only in the past few months that we have started to see data consistent with growing labor market tightness, and even this trend is too new to be confident. The continued stagnation of wages through the end of 2014 implies that, at a minimum, a fair amount of slack remained in the labor market as of that late date. In turn, policies that would promote faster recoveries and encourage aggregate demand during and after recessions remain key policy tools.

View full pdf here.

Why is this relevant for policymakers?

Labor force participation rates are still down sharply since the onset of the Great Recession, but the unemployment rate, which spiked from 5 percent to 9.5 percent during the recession, has almost returned to its pre-recession level. If the low participation rate reflects structural economic changes then the current labor market is the “new normal” and there is not much that policymakers can do to improve short-term performance. If instead the problems are due to cyclical economic weakness, generating continued labor market slack that is hidden by the low unemployment rate, then there is much more scope for fiscal and monetary policy to improve labor market conditions. Clearly, cyclical and structural explanations imply vastly different policy responses.

A number of structural shifts have been suggested as explanations for the “new normal,” among them a reduction in workers’ willingness to take jobs (perhaps driven by changes in the incentives created by government transfer programs such as extended unemployment insurance), an aging population that creates shortages of younger workers, and rapid shifts in employers’ needs toward newer types of skills that are in short supply in the labor force. My examination of recent data finds little basis for any of these hypothesized changes. Rather, the evidence—most notably stagnant wages among those who are employed—suggests that lackluster employment growth from 2009 through at least the end of 2014 reflected a continued shortage of demand for virtually all types of workers. It is only in the most recent data—which may well be a temporary blip—that we start to see wage growth consistent with a tightening labor market. It is far too soon to conclude that structural changes will prevent a full recovery to pre-recession labor force participation rates. In the meantime, it will be important to have accommodative fiscal and monetary policies, lest we strangle the belated, still nascent recovery in its infancy. What little wage growth we have seen to date suggests little reason to worry that increases in demand for labor above the current level will trigger meaningful wage inflation.

What do the data say?

The unemployment rate has been below 6 percent since September 2014, lower than many estimates of the level consistent with “full employment.” (Even in a full-employment labor market, we would expect some unemployment as workers transition from one job to another.) Yet the employment-to-population ratio—the share of working-age adults who hold jobs—has been much slower to recover after the Great Recession, and remains lower than was seen at any point between 1984 and 2009. The difference between these measures of labor market slack reflects a sharp decline since 2007 in the share of the population that is participating in the labor market. These declines have continued throughout the recovery, and show no sign of being reversed.

Diagnoses of the situation have thus depended on which data series one chooses to emphasize. The unemployment rate data suggested a robust recovery from early 2011 onward. By 2014, the economy appeared to have little room left to improve, leading some to conclude that the still low employment rate and weak wage growth must have been the “new normal.” But the employment rate series suggested that there remained substantial slack left in the labor market throughout the period as four percent of the population who had been employed before 2007 but were not being pulled back into the labor market. Neither data series in isolation could reveal the true state of the labor market.

To distinguish between these “glass-half-full” and “glass-half-empty” views, I look to evidence regarding employment and wage growth by industry and demography, seeking indications of imbalances between labor supply and demand. If the labor market in 2013-14 was as tight as the unemployment rate alone indicated then we should have seen wage increases as employers bid against each other for workers who were in increasingly short supply. By contrast, if wage growth remained anemic throughout the period, and if employment shortfalls were spread evenly across high- and low-skill demographic groups, then that would be an indication that the unemployment rate was misleading and that the labor market remained quite slack.

View full pdf here.

Findings by industry

One potential source of structural problems is an imbalance between employers’ needs and the skills being offered by job seekers. Rapid technological changes can lead to increases in the demand for workers with specialized skills, yet slack might still remain in other parts of the labor market. There is clear evidence of this sort of imbalance in the mining and logging sector, which has grown substantially since before the recent recession and where there are clear signs that employers are having trouble finding workers to fill open jobs. But outside of this sector, there is little sign that demand growth has been disproportionately concentrated in sectors such as information and technology that typically require specialized skills.

Rather, job openings have grown most in sectors such as transportation, lodging and food services, and arts and recreation. These data generally appear consistent with the view that the increase in job openings reflects reduced recruiting efforts, lower starting wages, or higher minimum qualifications rather than shortages of qualified workers.  (See Figure 1.)

Figure 1

070615-rothstein-ib-web-02

It also is possible that demand for labor within certain industries created shortages of some particular types of workers that are masked by weakness in other subsectors. This explanation is perhaps most plausible for the finance and information sectors, where one can easily imagine shortages of workers with industry-specific skills. The information sector, where technological changes requiring new skills are most likely to be an important component of labor demand, and thus where structural labor supply shortages are most plausible, has had only a modest increase in job openings, and total employment remains below its 2007 level.

Findings by demography

Another source of evidence about mismatches between workers skills’ and firms’ needs lies in the demographic distribution of unemployment. In the recent recession, unemployment rose much more for non-college workers than for those who had attended college, and at each education level more for men than for women. The latter likely reflects the disproportionate declines in construction and manufacturing, which are cyclically sensitive industries that were very hard hit in this cycle. The former could be consistent with a shift in favor of higher-skill workers.

But data from the subsequent economic recovery contradict this explanation. The unemployment rate fell faster in the recovery for less-skilled workers than for college-educated workers, and particularly fast for non-college men. There is no indication that the unemployment rate for college-educated workers has reached any sort of a floor since it remains—even in the most recent data—notably higher than in 2007. (See Figure 2.)

Figure 2

070615-rothstein-ib-web-01

Findings regarding wages

Ultimately, the most decisive way to diagnose the adequacy of labor demand is by examining wages: If employers are having trouble finding suitable workers then they will compete against each other for those workers who are available, bidding up wages. Across-the-board labor shortages would mean increases in wages across the economy while shortages for workers with specialized skills would mean raises in particular sectors.

If the economy were pushing against overall limits then we would expect to see rising wages. But the data through 2014 showed no signs of upward pressure on wages. Average real wages (adjusted for inflation) were stagnant since 2009, with increases below 1 percent per year even in 2014. Workers at the very top of the wage distribution saw larger increases, but even these totaled only 2 to 3 percent between 2008 and 2014, and they were concentrated among the top 20 percent of workers. Below the 80th percentile, real wages fell by about 3 percent at the median. It is only in the most recent data (since the beginning of 2015) where there is any sign of real wage growth, at roughly a 3 percent annual rate. If this is sustained, and especially if it accelerates in the coming months, then it might indicate that the labor market has finally begun to tighten. But a few months of data are too little to support this conclusion, particularly when real wage growth has been boosted by low inflation attributable to declines in energy prices. (See Figure 3.)

Figure 3

070615-rothstein-ib-web-03

Over the longer period, there is no sign of meaningfully larger wage increases in sectors with rising job openings, as would be expected if these sectors faced persistent labor shortages. Across industries, only the mining and finance sectors appear to have posted meaningful wage increases, and even these have averaged less than 1 percent per year real wage growth. Once again, the patterns in the data are fully consistent with continued demand weakness, and not at all consistent with growing shortages of workers in growing sectors. (See Table 1.)

Table 1

070615-rothstein-ib-web-04

Policy implications

In the years since the Great Recession, the unemployment rate has gradually crept downward while other indicators of the health of the labor market have been stagnant. Lackluster wage growth and high unemployment rates among lower-skilled workers appear to be attributable to a continued shortage of demand in the U.S. economy, combined with greater sensitivity to cyclical conditions of workers on the bottom-rungs of the job ladder. That means the high nonemployment rate among lower-skilled workers is not the “new normal” but rather could be substantially resolved by more robust economic growth and better fiscal and monetary demand-management policies.

Further, my research suggests that increased aggregate demand for workers, at the current level, will not create inflation. At best, we are only in the past few months seeing meaningful tightness. More likely, this is an artifact of declining oil prices, which means the current labor market still has substantial slack. Under the latter interpretation, additional labor demand would improve employment outcomes, with particular benefits for low-skilled workers and other disadvantaged groups who suffer disproportionately from cyclical downturns.

My results also counsel against many of the recommendations made by proponents of the view that the economy has settled into a “new normal.” In particular, there are two ill-advised responses to current conditions in the labor market predicated on a misdiagnosis of the economy as having escaped the cyclical downturn. First, tax cuts or reductions in unemployment insurance or means-tested government transfer programs aimed at increasing labor supply will do more to reduce wages than to increase employment.

Second, education and training programs aimed at increasing the skill of low-wage workers are unlikely to do much to help the labor market when there are demand shortages at every rung of the job ladder. So education and training programs are unlikely to help in the short term. That said, these programs alongside increased income support for low earners still make sense as a response to long-term trends—even if they cannot be expected to contribute meaningfully in the short run.

Taking ill-advised policy steps, such as failing to implement needed fiscal and monetary policies to boost demand for labor, or, worse, implementing policies aimed at tamping down an overheating economy, could extend periods of underemployment, damaging workers’ productivity for many years to come. Every month that the economy continues to underperform is making us poorer for decades into the future. Over-cautious policy could cause substantial damage. It is also crucial to put policies in place now to prepare for the next downturn, to avoid such a sustained, weak recovery.

Conclusion

Claims that the economy is nearing its growth potential, and that ongoing low employment rates are the unavoidable consequence of structural changes in the labor market, are at odds with the evidence. Neither comparisons across industries or education groups, nor analyses of wage growth offer any evidence of tight labor markets pushing up against their limits. Unemployment rates remain higher than in 2007 for all ages, education levels, genders, and industries. Sectors that have been more cyclically sensitive in the past saw larger increases in unemployment in the Great Recession, but there is remarkably little difference beyond this observation in the current data. And wages have continued to stagnate for the vast majority of workers, at least until the very most recent data. All of these patterns are consistent with an ongoing shortfall in aggregate labor demand, and less so with a gradual adjustment to technological or demand-driven shocks that created demand for new types of skills that cannot be satisfied by the current workforce.

—Jesse Rothstein is an associate professor of public policy and economics and the director of the Institute for Research on Labor and Employment at the University of California, Berkeley.

View full pdf here.

Would graduating more college students reduce wage inequality?

In their influential 2010 book, The Race between Education and Technology, Harvard University economists Claudia Goldin and Lawrence Katz offer an explanation for the United States’ decades-long rise in wage inequality. In their view, the main reason that inequality has increased so much is because the supply of educated workers has not kept pace with an ever-growing demand–especially for workers with a college degree. The short supply of college-educated workers has driven up their price relative to the rest of the workforce, accounting for most of growing gap between workers at the top and the bottom of the earnings ladder. The research implies that the most direct and effective way to reduce the wage gap is to expand the share of the workforce with a college degree.

Goldin and Katz’s diagnosis and prescription represent the predominance of rising wage inequality within academic and Washington policy circles. But, this spring, first in public remarks and later in an interview with the Washington Post, Harvard economist Lawrence Summers declared that focusing on education and training as a way to reduce inequality is “whistling past the graveyard” and “fundamentally an evasion.”

After making these informal comments, Summers–together with Melissa Kearney and Brad Hershbein, both of the Hamilton Project at the Brookings Institution–produced a more formal analysis of how much increasing the share of college-educated workers could aid in reducing inequality. Their more formal analysis concluded “Increasing educational attainment will not significantly change overall earnings inequality” but would “reduce inequality in the bottom half of the earnings distribution, largely by pulling up the earnings of those near the 25th percentile.”

We argue that Hershbein, Kearney, and Summers get it right when they conclude that even a large jump in college attainment would have little impact on overall earnings inequality. But we also believe that they are overly optimistic in their assertion that increasing college attainment will reduce inequality at the bottom.

As Hershbein, Kearney, and Summers correctly argue, expanding the college-educated workforce would do little to lower inequality because “a large share of earnings inequality is at the top of the earnings distribution, and changing college shares will not shrink those differences.” The reason that the top one percent earn so much more than the rest of the workforce is not fundamentally because they have a college or advanced degree. About one third of workers already have a college degree or more, and inequality has increased substantially within that group between 1979 and 2014. As Hershbein, Kearney, and Summers maintain, even a sharp increase in the share of the college-educated population is not likely to put meaningful downward pressure on the earnings of those at the very top.

Their analysis is too sanguine, however, with respect to non-college-educated workers. The authors’ conclusions about workers at the bottom and the middle rest on two assumptions: First, that arbitrarily giving some non-college-educated workers a college degree will automatically give them access to earnings equal to those of existing graduates, and second, that reducing the supply of non-college-educated workers (by turning some of them into college graduates) will boost the earnings of the remaining non-college workers substantially. Both assumptions are unlikely to be true. As a result, the hypothetical plan to bestow 10 percent of non-college-educated men with a diploma would do nowhere near as much for inequality between the middle and the bottom as Hershbein, Kearney, and Summers suggest.

We note that Hershbein, Kearney, and Summers limit their analysis to men, because the period over which they estimate the effect of education attainment on wages is characterized by a large increase in the share of women in paid work, which complicates the analysis. Since the default for working-age men has been market labor throughout the period they analyze, it’s sensible to consider the effect of attainment on the wage distribution of men only, while understanding there are implications for women as well.

To help understand the Hershbein, Kearney, and Summers’ thought experiment, imagine that there are two bowls: one filled with non-college-educated men and one filled with college-educated men. The hypothetical exercise takes 10 percent of the people in the first bowl (of non-college graduates) and puts them into the second one (for college-graduates). This has three effects: It changes earned income for the people in the first bowl (those without degrees) by reducing the supply of non-graduates, bidding up their earnings. It changes earned income for the people in the second bowl (graduates) by increasing the supply, pulling down their wages. And it changes earned income for the people who were moved from the first bowl to the second bowl (from non-graduates to graduates) by giving them access to the higher earnings received by graduates. (See Figure 1.) In each of the three cases, however, the effects assumed by Hershbein, Kearney, and Summers are likely overstated.

Figure 1

hamilton-sim-02

Appealing to a 2010 paper by Daron Acemoglu and David Autor, both economists at the Massachusetts Institute of Technology, Hershbein, Kearney, and Summers argue that shifting 10 percent of men from the first bowl to the second would reduce the wage gap between college and non-college workers by 18 percent, which Hershbein, Kearney, and Summers divide half-and-half between an increase in non-college earnings and a reduction in college earnings. The main basis for that 18 percent estimate is the experience of the 1970s, when the share of college-educated workers increased substantially as the Baby Boomers entered the workforce with far more education than their parents’ generation. This large increase in the supply of graduates arguably drove down the earnings of college graduates relative to the rest of the workforce. When the growth in the college-educated share of the workforce slowed in the 1980s, the college wage premium opened up again. That pattern is the principal motivation for the idea that inequality is primarily “the race between education and technology.”

The decision to divide the 18 percent into two equal parts, with a 9 percent increase in earnings increase for non-college-educated men, drives the reduction in inequality in the bottom of half of earners, one of the key findings that the authors highlight. But the labor market now is very different than it was in the period that Acemoglu and Autor analyze. Since around 2000, the labor market has been deteriorating, jobs are scarce, and the share of the adult population that works has declined. The modest expansion of the mid-2000s did not bring workers back to where they’d been in 2000, and the recovery from the Great Recession of 2007-2009 has not (yet) brought workers back to where they were in 2008. There is simply too much slack remaining in the labor market–for both non-college-and college-educated workers—for reassigning workers from one camp to another to make much difference.

That excess supply is fundamentally why reducing the number of non-college-educated workers (removing workers from the first bowl) is unlikely to increase their earnings by 9 percent. All the college-educated workers who can’t find jobs or are in positions for which they’re over-qualified need to find work or better work first. Only then will we see the emergence of a seller’s market for the non-college-educated, one in which employers have to out-bid each other to find workers. That competition among employers, which we last saw at the end of the 1990s, is what’s necessary to trigger rising wages among the supply of non-college-educated workers.

A second empirical problem with the analysis is that the workers who are assumed to receive an instant college degree are, contrary to a core assumption of the analysis, unlikely to command the kinds of earnings received by those who already have a college-degree. Instead, these hypothetical graduates would continue to compete for the same jobs as the non-college-educated, but the degree would give the graduates a leg up. That, in turn, would push some of the remaining non-college-educated workers out of the labor market entirely.

So, yes, a college degree would improve the individual circumstances of the new graduates relative to those who were not granted an instant degree, but an important part of the payoff would be the ability to out-compete non-college graduates for jobs that don’t actually require a college degree. That, more or less, is what a 2015 study titled “Dropouts, Taxes, and Risks: The Economic Return to College under Realistic Assumptions,” by Alan Benson and Frank Levy of the Massachusetts Institute of Technology and independent economist Raimundo Esteva, finds. The economic benefit to obtaining a college degree for the population that is currently dropping out or otherwise on the cusp of getting one is quite modest. Our colleague Elisabeth Jacobs evocatively referred to this phenomenon as a “Cruel Game of Musical Chairs.” (See Figure 2.)

Figure 2

hamilton-sim-03

It’s worthwhile to place this analysis within the context of a larger debate about the labor market and why it’s not delivering broad-based wage growth to the people who comprise it. Since 2000, median wages have stagnated and the labor market participation rate has fallen, as have the rates of job-to-job mobility and household and small business formation. Young workers are not climbing the job ladder to the middle class. The share of national income earned by workers declined. Over an even longer timeframe, wages have not kept pace with worker productivity.

All of these phenomena suggest that the labor market isn’t working for most employees—problems that aren’t confined to those without a college education—and that suggests the problem isn’t that too few people have college degrees. Rather than focus on education attainment as the solution to inequality, it’s time for policy-makers to move on from the race between education and technology and focus on our stagnant labor market. As Summers said, “the core problem is that there aren’t enough jobs.” The key to reducing inequality is more jobs and a higher demand for labor. In the absence of more jobs, heroic assumptions about educational improvement are likely to deliver only modest economic benefits.


—Marshall Steinbaum is a Research Economist and John Schmitt is the Research Director at the Washington Center for Equitable Growth.

Taxation and fairness in an era of high inequality

Heather Boushey, Executive Director and Chief Economist, Washington Center for Equitable Growth, testifying before the U.S. Senate Committee on Finance on “Fairness in Taxation.”

I would like to thank Chairman Hatch, Ranking Member Wyden, and the rest of the Committee for inviting me here today to testify.

My name is Heather Boushey and I am Executive Director and Chief Economist of the Washington Center for Equitable Growth. The center is a new project devoted to understanding what grows our economy, with a particular emphasis on understanding whether and how rising levels of economic inequality affect economic growth and stability.

I’m honored to be here today to discuss a very important topic: the relationship between fairness and taxation. Over the past several decades, economic inequality, on a variety of measures, has increased in the United States. The benefits of economic growth have flowed primarily to households and individuals at the top of the income and wealth ladders. We need to keep this fact in mind when we consider taxation and fairness in the years ahead.

There are three major conclusions from my testimony:

  • As inequality has increased, the tax code has not kept pace with this change. The tax code does less to reduce inequality than it did in the late 1970s
  • Efforts to reduce inequality are not in tension with economic growth. A variety of research shows that steps taken to reduce inequality do not significantly hinder economic growth
  • There are policy options that can make the tax code more progressive that will have broad benefits for everyone

The rest of my testimony will focus on documenting the rise in inequality, reviewing the academic research on the effects of taxation, and some thoughts about where policy should go forward.

Download the full pdf for a complete list of sources

The rise of inequality

Inequality, at least in the popular conversation about it, is talked about like it is a single phenomenon. Even the most widely used measure of inequality, the Gini coefficient, treats it as such. If the coefficient rises, we know that inequality has gone up. But what we don’t know is how exactly inequality has increased.

In short, the story of the past four decades when it comes to inequality is a rapid rise in incomes and wealth for those at the top, slower growth for the middle compared to earlier time periods, and stagnation, if not outright declines, for incomes at the bottom of the ladder.

According to data from Paris School of Economics professor Thomas Piketty and University of California-Berkeley economist Emmanuel Saez, the average pre-tax income of the top 1 percent grew by 178 percent from 1979 to 2012. Correspondingly, the top 1 percent’s share of pre-tax income has increased from 8 percent to 19 percent over the same time period.

At the same time, inequality of wealth has been rising as well. According to research by Saez and London School of Economics professor Gabriel Zucman, the share of wealth going to top 0.1 percent of households has increased to 22 percent in 2012 from roughly 7 percent in 1979. That’s a 3-times increase in the share of wealth held by the top 10 percent of the top 1 percent. The reason for this rise? The rich have a much higher savings rate than the rest of population and the increase income inequality appears to be calcifying into wealth inequality as the rich save their incomes.

According to data from the Congressional Budget Office, the pre-tax, pre-transfer income of the median U.S. household grew by an average of 0.9 percent a year from 1979 to 2007, the last year before the Great Recession. That growth rate is considerably slower than the 4.7 percent a year for the average income of the top 1 percent of households.

For those at the bottom, the reductions in poverty over the past several decades have been driven almost entirely by tax-and-transfer programs. This means that our anti-poverty programs are working to reduce material hardship. Whether they have reduced it enough is another question. But this research also raises concerns about how the labor market is working for those at the bottom of the ladder.

Another shift toward inequality has been the shift of income from labor income (salaries and wages) toward capital (business income and capital gains). This shift matters for inequality because the distribution of capital income is far more unequal than the distribution of labor income. Households at the bottom and the middle of the income ladder rely much more on labor as a source of income than capital. And capital income is concentrated much more at the top of the income ladder.

As these shifts in inequality occurred, the federal tax system was doing less to reduce inequality, though the federal tax system is still progressive. A quick look at Figure 1 below shows how much the top marginal tax rate for labor income has been declining since the early 1980s.

Figure 1

testimony-visuals-03

However as the top rate has decreased, the improved economic performance that we might expect given the conventional wisdom doesn’t show up in the data. Figure 2 shows no discernible relationship between employment growth and the level of the top marginal tax rate. If cutting taxes resulted in stronger employment growth then there would be a discernible pattern in the years between 1948 and 2014, represented by a green dot in Figure 2. There is no pattern.

Figure 2

testimony-visuals-02

The lack of any obvious relationship isn’t the case for just employment growth. Figure 3 below shows that there is no clear correlation between the growth in labor productivity, one of the key sources of long-run economic growth, and the top marginal tax rate.

Figure 3

testimony-visuals-01

A more in-depth treatment of the relationship between tax rates and macroeconomic growth can be found in a 2012 Congressional Research Service report by Thomas Hungerford.

Now it’s true that the federal income tax has become slightly more progressive by some measures. But more tax revenue has come from payroll taxes, which have become less progressive. And those at the top of the distribution are paying a large share of federal income taxation. According to Congressional Budget Office data, the top 1 percent of earners had 14.2 percent of federal tax liabilities in 1979. By 2011, that share increased to 24 percent.

Yet over that same time period, the top 1 percent’s share of pre-tax income increased from 8.9 percent to 14.6 percent. So if progressivity is measured by the distribution of taxes paid, then progressivity has gone up. But that measure doesn’t account for the rising inequality in the distribution of income. The result of inequality increasing as the tax system does less to reduce inequality (as a CBO report points out) is that the inequality of incomes after taxation has increased more than the inequality of income before taxation.

Why should we care about the rise in inequality? There’s an emerging consensus in economic research that high levels of inequality can threaten economic growth. My colleague Carter C. Price and I went through the research literature on the relationship between inequality and growth and found that research points toward a negative relationship. As inequality goes up, economic growth tends to go down. A recent paper by researchers at the International Monetary Fund further finds that redistribution does not necessarily hamper growth. The exact reason for this apparent relationship is unclear and my organization was founded to help better understand it. But the evidence as it stands is cause to seriously grapple with the negative effects of inequality.

Academic research on taxation

Given the rise in inequality, what can tax policy do about this trend? One potential concern about taxation is that in an effort to reduce inequality, it can reduce economic growth and cause more problems than were already there. An increase in labor taxation might cause some workers to work less or an increase in capital taxation might cause a reduction in savings, both of which are important for economic growth.

These assumptions are widely held by policymakers and economics commentators. And to a certain extent they are true. But the level of taxation at which these problems would occur is much higher than usually expected.

On the subject of income taxation, a body of new research shows that labor income taxes for those at the top of the income ladder have no adverse effect on economic growth. A paper by Nobel Laureate Peter Diamond and UC-Berkeley economist Emmanuel Saez reviewed the research literature on income taxation and finds that progressive taxation is well-supported by the research.

When it comes specifically to top rates, another paper by Saez along with Thomas Piketty and Harvard University’s Stefanie Stantcheva look at the underlying forces that determine what the optimal level of taxation could be. After accounting for a variety of factors, the three economists find that the top marginal rate could be as high as 83 percent without affecting economic growth. I wouldn’t take this paper as evidence that the United States could increase its top income rate to such a level. Rather, the result is instructive that tax rates could be significantly higher without major adverse effects.

Research also shows that reducing certain tax expenditures wouldn’t negatively affect the economy either. Research that shows tax incentives are often ineffective at incentivizing behavior. The tax code may provide a tax break for a certain behavior on the belief that this economic incentive will dramatically change behavior, but some work casts doubt on how much behavior is changed by these kind of incentives. Take, for example, Harvard economist Raj Chetty’s work on retirement savings decisions. He and his co-authors look at millions of data points on changes in retirement savings after a change in tax policy in Denmark. What they found is that 85 percent of workers were non-responsive to changes in tax incentives and savings rates didn’t decline. Of course, this result isn’t perfectly applicable to the U.S. situation. But its results are suggestive and should be considered in the U.S. policy situation.

New research also challenges the idea that capital taxation will invariably result in lower savings and consequently lower economic growth. Recent work that shows the long-held belief that capital income shouldn’t be taxed at all is flawed. A paper by Piketty and Saez shows the flaws with the famous Chamley-Judd assumptions. Chamley-Judd assumptions imply that savers have infinitely long-time horizons when thinking about saving for the future. If I care about the returns on my savings very, very far in the future, then a tax on savings would end up compounding to a point where the burden is immense. Taxing capital in this situation would drastically reduce savings. But Piketty and Saez show that this assumption doesn’t hold up under scrutiny. And a recent paper by Ludwig Straub and Ivàn Werning of the Massachusetts Institute of Technology show that the zero taxation result doesn’t even hold up within the Chamley-Judd framework.

There is also the assumption that reducing capital taxation will induce corporations into investing more. The reduction in taxation supposedly will increase the return to investment. But research by the University of California-Berkeley’s Danny Yagan finds that the 2003 dividend tax cut didn’t have any effect on investment or employee compensation. Yagan compares the investment behavior of public companies, which would were affected by the tax cut, with the behavior of privately held companies. What he found was that the public companies, which should have invested more due to the tax cut, didn’t invest more than similar privately held companies.

Another possible form of capital taxation is increased taxation of bequests and inheritances. A 2013 Econometrica article by Piketty and Saez argues that the optimal tax rate for inheritances for the United States may be as high as 60 percent. And that the rate would be even higher for those at the very top. In their paper a high inheritance tax is optimal if those bequeathing wealth are relatively unaffected by taxation, inheritances are very unequally distributed and society favors work over inheritance. And the United States fits this description, hence the high level of taxation found in their paper.

With this knowledge, what can we say about tax policy moving forward?

 Possible policy steps

So we know that inequality has risen in the United States over the past several decades. At the same time we have learned from research that there is more room to make the tax code more progressive to help reduce inequality. There are quite a few policies that could move the tax code in that direction.

There are many examples of changes that would be consistent with the literature. Two that are on the table right now would be eliminating the “stepped-up basis” for taxation of bequests and expanding the Child Tax Credit and making it permanent. A rather large loophole currently exists when it comes to the taxation of capital gains. When a person inherits, say, a large amount of stock holdings from a parent, the inheritor is only taxed on the gains made after they inherit the stocks. So if a parent bought a stock at $1 and it appreciates to $99 before the child receives the stock, then the child would only be taxed on the gains over $99. So the capital gains that occurred over the lifetime on that asset since it was first purchased aren’t taxed as income.

If we are concerned about the possibility of families passing along large estates to children and the potential damages that could have on the vitality of the economy, this seems like a loophole we should close. There are a variety of other ideas for taxation in this area, including eliminating the carried interest loophole, whereby hedge fund managers do not pay the ordinary income tax. David Kamin, a professor at New York University School of Law, outlines a menu of options for taxing the wealth of the very wealthy, including transfer taxes, raising the ordinary income tax rates or limiting deductions and exclusions.

But we can also do a variety of things at the low end of the income laddee. One example is the Child Tax Credit, which provides workers with children a tax credit of up to $1,000 per child in hopes of offsetting the costs of raising a child. The tax credit is currently partially refundable for a set percentage of income (15 percent) over a set threshold (currently $3,000). The value of the tax credit has been increased and the threshold decreased, both temporarily, in recent years. I recommend making these reforms permanent. Given the rising costs of child care and the incredibly important role of children and the development of their future talents for the future growth of the economy, giving parents more funds to help raise children makes sense.

Conclusion

The past four decades have been a period of high and rising inequality in the United States. Tax policy has an important role to play in the policy response to this major shift in our economy. It cannot, and should not, be policymakers’ sole response. But changes are needed.

Our economy currently isn’t creating prosperity that is broadly shared. And it hasn’t for a while. Today’s hearing is an important contribution to the conversation about how to get our economy on a track to creating shared prosperity for all Americans.

Obamacare and long-term U.S. economic competitiveness

The legal arguments before the U.S. Supreme Court this week in King vs. Burwell may well decide whether a key provision of the Affordable Care Act remains in effect for millions of Americans who now rely on Obamacare for affordable health insurance. But if this elite jury of nine judges is still out on the legal question before the court, the long-term economic consequences of uninsuring the many children now insured under the new health law are clear.

Several new research papers document the importance of early childhood health care for the least advantaged kids among us—on their future workforce productivity, their contributions to our national tax base, their educational attainment, and their declining use of government income supports. These robust findings mirror the results of research that I conducted with economists Sandra Decker of the National Center for Health Statistics and Wanchuan Lin of Peking University. We found that Medicaid coverage for children born between 1985 and 2005 resulted in a better health trajectory for those kids as they because adolescents and young adults, and thus improved their ability to be productive contributors to our economy.

What will happen if less-well-off kids today do not get the affordable health care they need to become successful contributors to our economy over the coming decades? Well, the best economic research shows that current government health care programs, including those recently expanded under Obamacare, already ensure many of these kids will be better and more productive citizens. So lets parse the data.

The first paper, by economists David Brown and Ithai Lurie of the U.S. Treasury Department, and economics professor Amanda Kowalski of Yale University finds that children who gained public health insurance in the 1980s and 1990s under the expanded Medicaid and the Children’s Health Insurance Program paid more in cumulative taxes by age 28, collected less in payments from the Earned Income Tax Credit, and (among the women in the group) attained higher cumulative wages. The three authors estimate that when these now young adults reach the age of 60 the federal government will have recouped at least 56 cents for each dollar spent on childhood health care.

The second paper, by economists Laura Wherry at the University of California-Los Angeles, Sarah Miller at the University of Michigan, Rober Kaestner at the University of Illinois, and Bruce Meyer at the University of Chicago, shows that providing public health insurance to low-income children results in fewer hospitalizations and emergency room visits in adolescence and adulthood. Their findings strongly suggest that substantial health care savings are in the cards for this group of Americans—a welcome boon as the U.S. economy struggles with reducing the cost of health care in our society.

The third paper, by economists Sarah Cohodes of Harvard University and Cornell University’s Samuel Kleiner, Michael Lovenheim, and Daniel Grossman, shows that better public health care among low-income children in the 1980s and 1990s resulted in higher graduation rates from high school and college for these kids, again indicating that the long-run economic benefits of public health insurance are substantial.

None of these studies examined the health of kids enrolled in public health programs due to Obamacare specifically—the program is too new for these kinds of long-term studies—but the further expansion of eligibility for low-income children through Medicaid and the Children’s Health Care Program is one of the things at stake in the Supreme Court’s oral arguments in King vs Burwell next week and the final decision sometime this summer.

What could happen should the Supreme Court decide in effect to shut down the federal health insurance exchange operating in 34 states without their own exchanges? Among the results could be more than 5 million enrollees in the joint state-federal Children’s Health Insurance Program without health insurance, estimates the Children’s Health Fund, a provider of mobile health care for homeless and low-income children. We already know the empirical long-term economic benefits of expanded health care for those least able to afford it—and can say with strong confidence that taking away health insurance for these five million now covered under Obamacare would harm our economy.

—Janet Currie is the Henry Putnam Professor of Economics and Public Affairs at Princeton University and directs the Program on Families and Children at the National Bureau of Economic Research. Her views expressed in this column are her own.

The future of work in the second machine age is up to us

“Big Thinkers” about the role of technology in the U.S. economy are roughly divided into two camps when it comes to the consequences of rapid technological change on the U.S. workforce. There is the techno-optimist view that better technology complements workers and hence benefits them by raising wages. And there’s the pessimistic view that better technology substitutes for workers and therefore displaces and harms them. A debate between the two views was probably what the organizers intended for an event last week hosted by The Brookings Institution’s Hamilton Project entitled “The Future of Work in the Age of the Machine.”

The impetus for the forum was the influential 2014 book “The Second Machine Age” by professors Erik Brynnjolfsson and Andrew McAfee at the Massachusetts Institute of Technology. The authors argue that increasingly “smart” technology displaces workers by reducing the range of tasks that require human ingenuity, and by enabling economic arrangements such as off-shoring that rely on instantaneous global communication and replicability. Brynnjolfsson and McAfee are clearly in the pessimists’ camp.

Until recently, economists were largely in the optimist camp. Sure, some jobs—think buggy whip manufacturers, typists, or travel agents—might disappear, but others would arise to take their place. In the long run, increased productivity would benefit everyone in the form of higher wages.

Yet the debate last week actually highlighted a third position. If either the techno-optimists or the techno-pessimists are right, then we should see a major positive impact on worker productivity. But it just isn’t there in the data. If anything, the rate of technological change in the United States has decreased since at least 2003, specifically in the technology sectors widely thought to be most innovative.

In contrast, we definitely see worker displacement, stagnant earnings, a failing job ladder, rising inequality at the top, “over-education” (workers taking jobs for which they’re historically overqualified), and declining rates of employment-to-population and household and small business formation. What we do not see are the productivity gains, either on a micro or macro level, that are supposedly driving worker displacement. (See Figure 1.)

Figure 1


fernald-graphic

Former Treasury Secretary Larry Summers made this point forcefully at the Hamilton Project event. He said “people see there’s already a lot of disemployment but not a lot of productivity growth.” And he continued by asserting that “the core problem is that there aren’t enough jobs,” and that it’s hard to believe the future promise of labor-supplanting technology is driving current displacement. The reason, he said, is that we’d expect to see the installment of new labor-saving systems that would cause a temporary increase in labor demand during the transition.

Summers noted that back when he was an undergraduate at MIT in the 1960s, his professors said labor would not be displaced by technology. In those days, the non-employment rate for prime-age male workers was 6 percent. Now it’s 16 percent. Summers’ co-panelist David Autor added that since 2000, the education wage premium has reached a plateau and the rate of over-education has increased, both of which are hard to square with the argument that the reason for rising inequality is the advance of technology. Summers added that the idea that more education solves the problem of displaced labor is “fundamentally an evasion.” Summers’ arguments and Autor’s observation imply that if we’re wondering how things got so bad for workers, it’s not because we live in the Second Machine Age.

So if not technology, what explains labor displacement?

Broadly speaking, the explanation is this: market practices and public policies that favor managers over workers, and those who make their living by owning capital over those who make their living by earning wages. That choice lurks behind the decline in full employment as a priority in macroeconomic policymaking. It’s also behind a shift in the legal standards, mores, and incentives of corporate management in favor of the interests of owners over other stakeholders. That choice is also evident in the abandonment of long-term productive investment as a priority in public budgeting in favor of upper-income tax breaks and retirement programs for the elderly.

As Summers noted at the Hamilton Project’s event, there seems to be a lot of so-called rents—economics speak for excessive payment for something beyond its actual value—in corporate profits that can’t be understood as the fruits of productive investment. The big question is: who gets those rents? In 1988, Summers wrote an article fleshing out the idea that the division of rents between corporate stakeholders is what drives rising inequality. More than a quarter century later, he could not have been more prescient.

The good news is that if such a profound shift played out over only three or four decades, then it’s reversible. That wouldn’t be true if it were the result of the technological trends detailed in “The Second Machine Age.” So what should be the focus of public policy is to figure out ways for workers to accrue more of corporate earnings, for more unemployed and underemployed people to find full-time, productive jobs, and for the broader economy to serve the interests of the actual people who inhabit it—those who overwhelmingly derive their living from their labor.

We know what needs to be done and how to do it, because we’ve done it before. (See Figure 2.) But it’s a lot harder to actually do than doubling the number of logic gates on a computer chip every two years—the ostensible tech explanation for our current economic woes.

Figure 2

incomegrowth-quintile1