Will the U.S. Economy Boom?

The very sharp Ken Rogoff predicts a boom over the next four years: “The biggest missing piece… is business investment, and if it starts kicking in… output and productivity could begin to rise very sharply…. You don’t have to be a nice guy to get the economy going…. It is far more likely that after years of slow recovery, the US economy might at last be ready to move significantly faster…”

I really can’t see it as likely. Rogoff talks about:

  • “the prospect of a massive stimulus, featuring a huge expansion of badly needed infrastructure spending…” but Trump’s stimulus proposal as of now is for tax subsidies to projects that would be built in any event coupled with privatization to restrict use. There is definitely space for fiscal stimulus and infrastructure–and we should lobby and argue hard to use that space–but what appears to be on Trump’s agenda is a bunga-bunga Berlusconi-like policy.

  • “a massive across-the-board income-tax cut that disproportionately benefits the rich… [although it] hardly seems as effective as giving cash to poor people… tax cuts can be very good for business confidence…” but I haven’t seen cases in which this is true–rather, rich people say that tax cuts are very good for business confidence and then skip town with the money.

  • “repealing Obama-era regulation… businesses will be ecstatic, maybe enough to start really investing again. The boost to confidence is already palpable…” but I can’t see a bigger carbon-energy boom than we have had, I don’t notice other labor or environmental regulations binding–certainly not in the Seattle restaurant industry–and, this morning, Boeing is really not ecstatic about a president Trump.

  • “the huge shadow Obamacare casts on the health-care system, which alone accounts for 17% of the economy…” but ObamaCare is primarily a source of money for health care, not a regulatory drain. Repeal of ObamaCare would be–as every hospital and insurance company is right now telling everyone on Capitol Hill who will listen–a major downer. Who is Rogoff talking to? When he made this point earlier, he referred to the “substantial regulatory burden of ObamaCare on small business”. But there never was any. Small businesses–those with less than fifty employees–face no burden. Those few larger businesses–those with fifty employees or more–that do not offer employer-sponsored health insurance face a not-yet-implemented and often-postponed 2% of payroll tax. That’s a cost to them, but a benefit to their many, many competitors who have been offering employer-sponsored insurance.

And:

  • “Even steadfast opponents of President-elect Trump’s economic policies would have to admit they are staunchly pro-business (with the notable exception of trade)…” Enough said.

By saying that a boom is “far more likely” than the opposite, I think Rogoff is playing a 20% chance as if it were a 60% chance. And I do not understand what makes him see the world this way. Tax credits for already-planned infrastructure projects are not fiscal stimulus, ObamaCare is not a substantial regulatory burden on small business, etc. Or do I not live in the real world?


Kenneth Rogoff: The Trump Boom?: “Under President Barack Obama, labor regulation expanded significantly…

…not to mention the dramatic increase in environmental legislation. And that is not even counting the huge shadow Obamacare casts on the health-care system, which alone accounts for 17% of the economy. I am certainly not saying that repealing Obama-era regulation will improve the average American’s wellbeing. Far from it. But businesses will be ecstatic, maybe enough to start really investing again. The boost to confidence is already palpable.

Then there is the prospect of a massive stimulus, featuring a huge expansion of badly needed infrastructure spending. (Trump will presumably bulldoze Congressional opposition to higher deficits.) Ever since the 2008 financial crisis, economists across the political spectrum have argued for taking advantage of ultra-low interest rates to finance productive infrastructure investment, even at the cost of higher debt. High-return projects pay for themselves.

Far more controversial is Trump’s plan for a massive across-the-board income-tax cut that disproportionately benefits the rich. True, putting cash in the pockets of rich savers hardly seems as effective as giving cash to poor people who live hand to mouth. Trump’s opponent, Hillary Clinton, memorably spoke of “Trumped-up trickle-down economics.” But, Trumped-up or not, tax cuts can be very good for business confidence.

It is hard to know just how much extra debt Trump’s stimulus program will add, but estimates of $5 trillion over ten years – a 25% increase – seem sober. Many left-wing economics commentators, having insisted for eight years under Obama that there is never any risk to US borrowing, now warn that greater borrowing by the Trump administration will pave the road to financial Armageddon. Their hypocrisy is breathtaking, even if they are now closer to being right.

Exactly how much Trump’s policies will raise output and inflation is hard to know. The closer the US economy is to full capacity, the more inflation there will be. If US productivity really has collapsed as much as many scholars believe, additional stimulus is likely to raise prices a lot more than output; demand will not induce new supply.

On the other hand, if the US economy really does have massive quantities of underutilized and unemployed resources, the effect of Trump’s policies on growth could be considerable. In Keynesian jargon, there is still a large multiplier on fiscal policy. It is easy to forget the biggest missing piece of the global recovery is business investment, and if it starts kicking in finally, both output and productivity could begin to rise very sharply.

Those who are deeply wedded to the idea of “secular stagnation” would say high growth under Trump is well-nigh impossible. But if one believes, as I do, that the slow growth of the last eight years was mainly due to the overhang of debt and fear from the 2008 crisis, then it is not so hard to believe that normalization could be much closer than we realize. After all, so far virtually every financial crisis has eventually come to an end….

At the risk of hyperbole, it’s wise to remember that you don’t have to be a nice guy to get the economy going. In many ways, Germany was as successful as America at using stimulus to lift the economy out of the Great Depression.

Yes, it still could all end very badly. The world is a risky place. If global growth collapses, US growth could suffer severely. Still, it is far more likely that after years of slow recovery, the US economy might at last be ready to move significantly faster, at least for a while.

Comment of the Day: Sherman Robinson: On the Economics of BREXIT

Comment of the Day: Sherman Robinson: On the Economics of BREXIT: “I largely agree with Simon Wren-Lewis’s comments, and with the quote from Maurice Obstfeld…

…The trade-productivity links they discuss, as Wren-Lewis notes, “all make common sense”.

However, I think it is very important to sort out the empirical relevance of the different causal mechanisms—it is impossible to consider policy choices without doing so. I see four mechanisms at work:

  1. Ricardian movement of factors to exploit comparative advantage from opening to international trade. Clearly true, but forty years of work with computable general equilibrium (CGE) models, both single-country and global, indicates that pure Ricardian effects on productivity are very small. In conferences, we often cite a “theorem” due to Arnold Harberger: “triangles” are smaller than rectangles”.

  2. “Winds of competition” or “challenge/response” models. There is a large literature on such models, all arguing that opening up markets to competition forces firms to move to the production frontier and/or induces investment in technological change. These effects appear to be significant.

  3. Explicit backward linkages between exporting and “learning better techniques”. These are also significant effects in particular cases, but would seem to be limited in coverage and probably not large enough to have much effect at the national/global levels.

  4. Fragmentation of production processes that allows strong specialization and regional diversification of production of intermediate inputs. There are many examples of these value chains across economic activities: agriculture, manufacturing, and services. They allow producers to achieve “Smithian” gains in productivity through fine specialization. They are seen by later stages in the value chain as lowering input costs, which are not measured as, say, a TFP gain by the later-stage producer, but is very significant. I think that these Smithian productivity gains are very large and cover a wide range of economic activity for countries that have taken part in value chains.

These four mechanisms are not mutually exclusive—all are operating and are probably very complementary. For a nice discussion of the empirical importance of fragmentation of value chains, see the new book by Ricard Baldwin: The Great Convergence. He argues, and I agree, that this fragmentation has been a major driver of trade-linked productivity growth.

On Brexit. The UK is embedded in the EU and most of its trade involves imports and exports of intermediate inputs in complex value chains, so mechanism (4) is very important. Policies that interrupt value chains will be very damaging. For example, if the UK leaves the EU customs union, then the EU will have to impose rules of origin conditions that will impede trade. Firms may well prefer to move operations to the EU in order to keep the value chains operating smoothly. There are lots of other issues concerning how to support and foster value chains, beyond the scope of a short comment.

Must- and Should- Reads: December 8, 2016


Interesting Reads:

Should-Read: Barry Ritholtz: Putting the Minimum Wage Debate into Context

Should-Read: Barry Ritholtz: Putting the Minimum Wage Debate into Context: “The modern minimum-wage debate traces back to… Krueger and… Card…

…In the fast-food industry… no reduction in job growth in the market where pay was increased…. Many subsequent studies confirmed… [taht] modest increases in minimum wages don’t lead to job losses….The extent to which taxpayers subsidize profitable public companies that game the safety net is serious business. One study noted that U.S. fast-food workers receive more than $7 billion a year in public assistance; another pegged the Wal-Mart taxpayer subsidy at more than $6 billion. Alan Grayson, a former congressman from Florida, observed:

In state after state, the largest group of Medicaid recipients is Walmart employees… the same thing is true of food stamp recipients. Each Walmart ‘associate’ costs the taxpayers an average of more than $1,000 in public assistance.

Politifact reviewed his claims and found them to be “mostly true.” The economic impact of modest increases in the minimum wage may be well-established, but you wouldn’t know this based on the claims of opponents.

Should-Read: Josh Marshall: This Explains How and Why Medicare Will Live or Die

Should-Read: Josh Marshall: This Explains How and Why Medicare Will Live or Die: “John Boozman (R) of Arkansas…

…’Well, if the president goes first, and then if I see Republicans AND Democrats jump and then if the American people decide they want to jump too… well, then I’ll be right behind you.”… This gives you a map into the essentials of this debate and how Medicare will survive if it does…

Should-Read: Kevin Daly: A higher global risk premium and the fall in equilibrium real interest rates

Should-Read: Kevin Daly: A higher global risk premium and the fall in equilibrium real interest rates: “Since the turn of the century, the global economy has also been characterised by a rise in the yields on quoted equity…

…a feature for which the standard excess saving story cannot easily account…. An increase in the global risk premium has increased the wedge between risk-free interest rates and the real required return on risky investments…. Although there are differences between the savings glut and secular stagnation theses, a common implication of both is that excess saving has resulted in a generalised decline in yields across all assets, including but not restricted to real government bond yields (sometimes referred to as real ‘risk-free’ rates)…. The excess saving story is incomplete because it fails to account for the rise in the earnings yield on quoted equity from the early 2000s… a secular increase in the global ex ante equity risk premium…

What has driven the rise in the global risk premium since the turn of the century? One explanation is that the increasing importance of risk-averse investors in China and other emerging economies…. Another explanation (which does not exclude the first) is that it reflects the impact of population aging and pension regulation…

A higher global risk premium and the fall in equilibrium real interest rates VOX CEPR s Policy Portal A higher global risk premium and the fall in equilibrium real interest rates VOX CEPR s Policy Portal A higher global risk premium and the fall in equilibrium real interest rates VOX CEPR s Policy Portal

Should-Read: Mark Thoma: How social welfare benefits help the economy

Should-Read: Mark Thoma: How social welfare benefits help the economy: “Donald Trump has, at times, said he’ll protect Medicare and Social Security…

…But given Trump’s plans to cut taxes and raise the national debt by trillions over the next decade, and the general Republican sentiment about social insurance, it’s hard to see how these programs can be protected if Republicans gain control of Congress and the presidency. Part of the GOP’s objection to these programs is the idea that they take money from those who have earned and deserve it and redistribute it to those who have not. They say that’s unfair. Is that true, or is there an economic basis for social insurance?

The case for social insurance begins with the recognition that capitalist economies are subject to boom-and-bust cycles…. The benefit of a capitalist system is much higher economic growth on average and a more dynamic, innovative and efficient economy. The cost is the instability…

How tight is the U.S. labor market? And how tight do we want it?

A “Now Hiring” sign hangs in the window of a Dollar General.

Is the U.S. labor market at “full employment”? This question may seem open and shut with the unemployment rate at 4.6 percent, according to the latest Employment Situation report. But some other data show some slack remaining in the labor market, including the employment rate for prime-age workers and wage growth that, while increasing, still has some room to grow. Data released this morning as part of the Job Openings and Labor Turnover Survey might be helpful not only when looking at the health of the labor market, but also predicting when policymakers will decide that the labor market hits “full employment.”

The rate at which workers quit their jobs is a good window into the health of the labor market. Quitting is a sign of worker confidence in their ability to find a new job. Workers will be more likely to quit when they see the labor market improving. Higher rates of quitting also are a sign that companies see the labor market tightening and are poaching more workers from other firms. As today’s Job Openings and Labor Turnover Survey shows, the quits rate is close to pre-recession levels, but data that cover a longer time than JOLTS show the current rates far below levels seen in the 1990s. (See Figure 1.)

Figure 1

Another metric is the number of hires per job opening, or the rate at which open jobs are being filled. When the labor market is weak, employers will have a relatively easy time filling open jobs. More unemployed workers means employers will have an easy time picking workers they find acceptable. As the labor market improves, job openings will be harder to fill and the number of hires per job opening will decline. Today’s figures show this “vacancy yield” has fallen over the course of the current recovery. (See Figure 2.) By this metric, the U.S. labor market is tighter than its pre-recession levels. But this may be due to a structural change in how easily employers can create jobs. So it may be difficult to look at this graph and know what level of the yield would constitute full employment.

Figure 2

A third and final metric from the JOLTS data is the number of unemployed workers per job opening. A slack or weak labor market will have a high ratio of workers who are laid off and employers who aren’t looking to hire. A higher ratio means employers have relatively more implicit bargaining power as there are more workers competing for a set number of job openings. Workers’ ability to bargain over pay or working conditions starts moving back to workers as the ratio declines. Of course, with so few workers having a union to support them in any negotiations, the ability to bargain with an employer (or potential employer) is based on the individual’s capacity. The current ratio is now at levels slightly lower than pre-recession levels. (See Figure 3.)

Figure 3

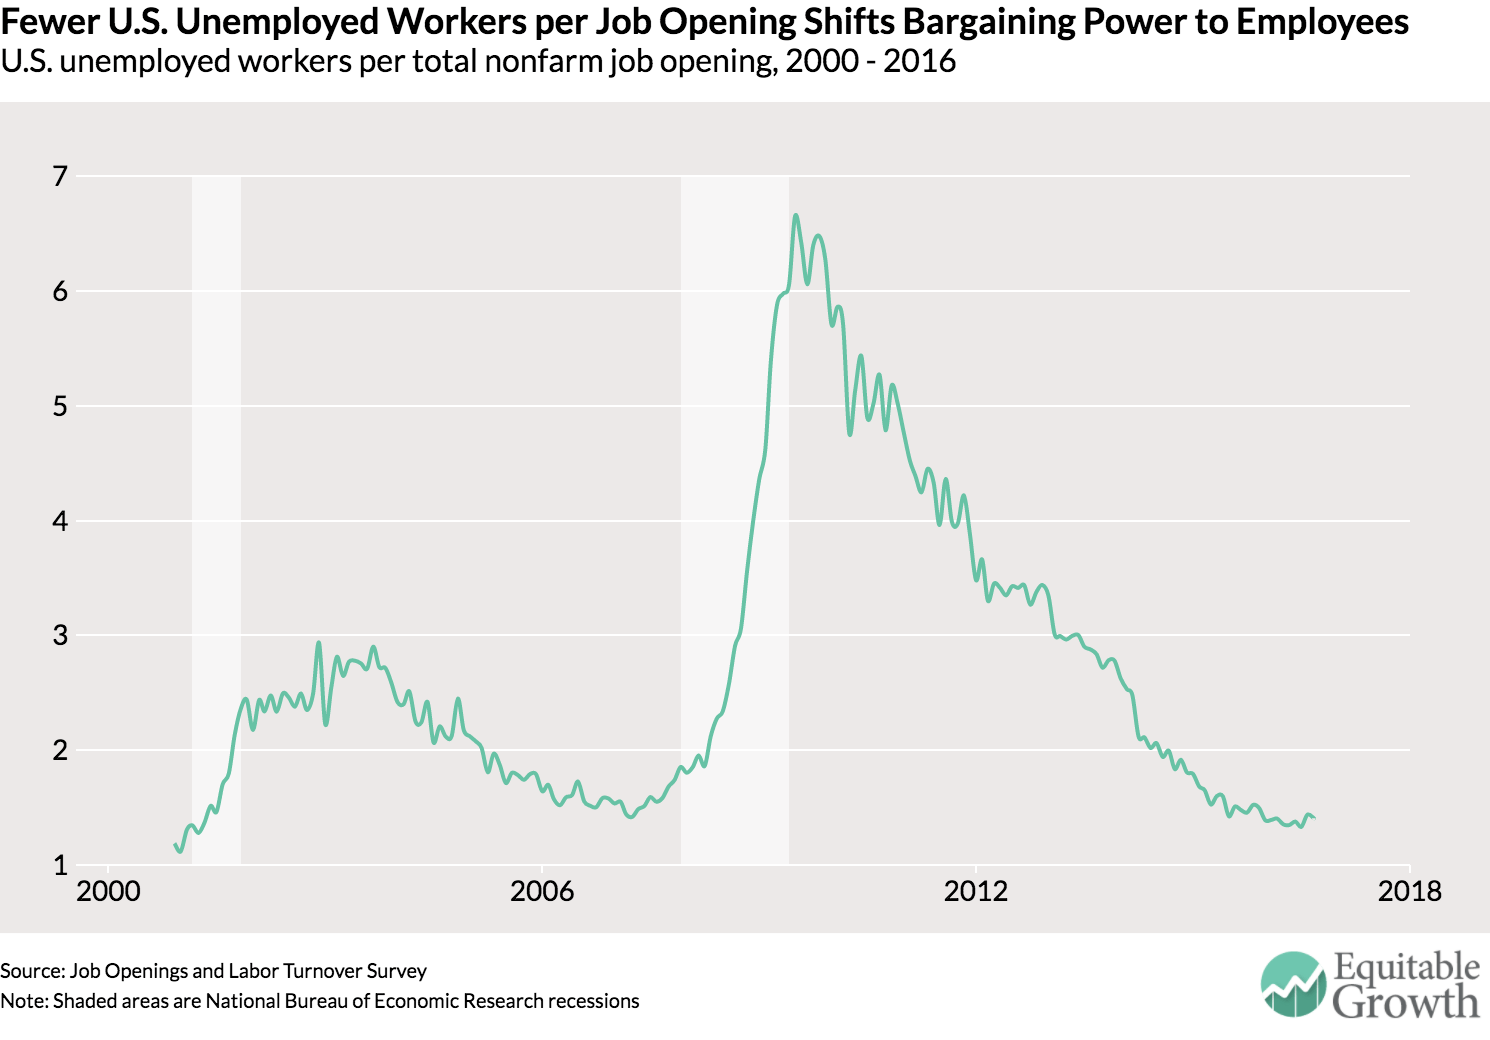
This metric also shows that the labor market is back at prerecession levels, but notice again that it was much lower in 2000 (a bit over 1) when the labor market has generally regarded at full employment. This ratio might be a good indicator of full employment—if by it we mean a situation where workers can easily find a job and have strong bargaining power. In his book “Full Employment in a Free Society,” the late British economist Sir William Beveridge wrote that full employment “means always more vacant jobs than unemployed men.” Updating this definition based on today’s JOLTS data, policymakers might want to shoot for an economy where the ratio of unemployed workers to job openings can be below 1 sustainably.

Overall these data show the U.S. labor market to be healthy and continuing its current trajectory toward full employment. How long it’ll take for the labor market to hit full employment is still up for debate.

Must-Reads: December 7, 2016


Interesting Reads:

Distributional National Accounts and measuring 21st century growth

In this June 1, 2016 photo, vacant buildings stand near the Pyramid which houses a Bass Pro Shops megastore that opened in 2015, in Memphis, Tenn. Statistics describe an America that is nearly recovered from the Great Recession, but the national averages don’t give a complete or accurate picture. Wealth is flowing disproportionately to the rich, skewing the data used to measure economic health.

The U.S. Bureau of Economic Analysis late last week released revised data showing that in the third quarter, the U.S. economy grew at an annual rate of 3.2 percent. This was deservedly celebrated as good news—growth was higher than previously reported, which means more economic activity and, with that, presumably, more jobs and better incomes. Yet that same data revealed nothing about how the economy is performing for people across the income spectrum.

New data released this week from economists Thomas Piketty, Emmanuel Saez, and Gabriel Zucman addresses this knowledge gap. Based on careful research that matches data on aggregate economic growth to individual incomes, the researchers show that between 1980 and 2014, on average, pre-tax income grew by 61 percent over that period, yet most of the U.S. population did not benefit from this growth. The bottom 50 percent of the population saw only a 1 percent growth in their pre-tax incomes (after adjusting for inflation) while those in the top 1 percent saw their incomes rise by 205 percent.

These Distributional National Accounts—developed by the three economists and co-collaborators working at the Paris School of Economics, the University of California-Berkeley, Oxford University, and Harvard University—provide policymakers and economists alike with a better way of understanding economic growth—one that directly connects the analysis of aggregate economic data with the real-life circumstances of individuals.

For generations, economists relied on very broad national income and product accounts to report on economic activity. These data—the National Income and Product Accounts—aggregate information from all the businesses, households, and governments across the economy to discern the total value of goods and services sold, the total incomes received, and what share comes from various sources, such as earnings, interest, rent, or government payments. The data also show how much the United States sells to other countries and buys from abroad.

This data is central to understanding how the U.S. economy works, but it is important to remember that policymakers more than a half-century ago made a choice about how to discern what was happening in the economy—one that did not take into consideration the consequences of economic growth on individuals but which suited the economic issues of the era. In the 1930s, in the wake of the Great Depression, the U.S. Commerce Department commissioned Nobel laureate Simon Kuznets to develop a set of national economic accounts. This was a time when promoting growth (and the jobs that come with it) was the nation’s priority. Prior to this, policymakers, business leaders, and families had to rely on a hodgepodge of data to infer what was going on in the economy.

Make no mistake, Kuznets’ National Income and Product Accounts have served their purpose over time and are among the most significant data developments of the 20th century. The data remain one of the most important tools that the Federal Reserve Board and other policymakers have to understand and manage the U.S. economy toward full employment. Historians credit the implementation of these accounts as one of the key reasons the United States so effectively marshaled economic resources to fight in World War II.

Today, there is a new data frontier—understanding what growth looks like for individuals and families throughout the U.S. economy amid growing income inequality. The data that underpins the new Distributional National Accounts can help policymakers understand why, even though the economy grew by 16 percent in the wake of the Great Recession, millions of Americans report that the economy is not working for them any better than it was amid the worst economic downturn since the Great Depression. Those millions of individual Americans and their families get it—most have not benefitted from more than seven years of growth. Distributional National Accounts enable policymakers to understand whether and how income inequality affects economic growth.