This essay is part of Boosting Wages for U.S. Workers in the New Economy, a compilation of 10 essays from leading economic thinkers who explore alternative policies for boosting wages and living standards, rooted in different structures that contribute to stagnant and unequal wages. The authors in the new book demonstrate that efforts to improve workers’ access to good jobs do not need to be limited to traditional labor policy. Policies relating to macroeconomics, to social services, and to market concentration also have direct relevance to wage levels and inequality, and can be useful tools for addressing them.
To read more about Boosting Wages for U.S. Workers in the New Economy 20 and download the full collection of essays, click here.
Overview
Allowing people to pursue their talents and interests is essential to individual well-being, but it also is a crucial part of any market economy. U.S. laws and society too often limit people from developing their potential, harming those individuals and the overall economy in the process. Policies that encourage more equal participation for women and African Americans could boost economic growth, reduce inequality, and power innovation.
The costs of misallocating talent in the U.S. economy are increasingly being identified in the economics literature. Four scholars at the University of Chicago’s Booth School of Business and Stanford University recently analyzed the gender and racial distribution of workers in highly skilled occupations over the past 50 years.1 They show that the change in the occupational distribution since 1960 suggests that a substantial pool of innately talented women and African Americans in 1960 were not pursuing their comparative advantage, and that this misallocation of talent affects aggregate productivity in the economy. They find that one-quarter of growth in aggregate output from 1960 to 2010 can be explained by an improved allocation of talent.
Other recent research finds that women’s underrepresentation in engineering and in jobs involving development and design explains much of the patent gap between men and women.2 Closing this divide could increase per capita U.S. Gross Domostic Product by 2.7 percent.3 And using data from the National Science Foundation’s Survey of Earned Doctorates, I and my co-author Yanyan Yang, now an economist at the University of Massachusetts Boston, estimate that GDP per capita could rise by 0.6 percent to 4.4 percent if more women and African Americans were included in the initial stages of the innovation process.4
Whatever their source, gender and racial disparities exist at each stage of the innovation process. From education and training to the practice of invention, and then onto the commercialization of invention, these disparities are costly to the U.S. economy. These disparities also can lead to increased income and wealth inequalities at each stage of the innovation process for those who are unable to participate fully. Reducing barriers to participation in the innovation process could affect productivity, as well as both the level and the distribution of income.
In this essay, I demonstrate why innovation and the commercialization of invention are both desirable and necessary in modern economies and why the benefits of doing so are not evenly distributed among those who are powering innovation today.5 Despite numerous initiatives to train and cultivate innovators, women and African Americans continue to participate at each stage of the innovation process at lower rates than their counterparts. I then propose four policies to close these race and gender innovation divides, particularly at the education and practice-of-invention stages:
- Improve mentoring programs with additional government policymaking and fiscal support
- Facilitate early education exposure to invention opportunities
- Engage in blind patent reviews by patent examiners
- Address the climate in high-tech workplaces to attract and retain women and African Americans in the places where invention and innovation happen
Women and African Americans have not enjoyed their proportionate share of innovation’s ample economic benefits.6 Fundamentally, innovation is critical for economic growth, wealth generation, and higher living standards. Innovation can substantially affect each component of economic growth—labor, capital, and total factor productivity.
Why the innovation process is important to U.S. economic growth and well-being
From a number of perspectives, innovation is a good thing. Economists have long recognized that the generation and implementation of ideas drives economic growth.7 Historians also have demonstrated the positive relationship between innovation, industrialization, and economic activity in studies of early U.S. inventors and entrepreneurs and in the creation of the patent system.8 Statisticians provide additional evidence of the importance of innovation to the U.S. economy: From 1960 to 2013, the number of workers in innovation jobs grew 3 percent annually, compared to 2 percent growth for the broader workforce.9
Economists measure innovation’s contribution to the economy with increasing precision, and it is clear that innovation’s importance is growing.10 In 2017, the National Science Foundation calculated that there were roughly 7 million to 25 million workers engaged in jobs related to the innovation process.11 These workers earn substantially more than the median income for all workers. In 2017, the median worker in innovation-related jobs earned $85,390, compared to $37,690 for all workers.
Innovation jobs also are growing faster than jobs in other sectors, and unemployment rates are lower in the sector, too. In 2017, the unemployment rate for scientists and engineers was 2.7 percent, compared to 3.1 percent for all college graduates and 4.9 percent for the United States overall.12 During the Great Recession of 2007–2009, moreover, when the U.S. workforce contracted, the innovation workforce was less affected by the overall economic contraction.13 Amid that recession, the income gap between innovation workers and the general labor force also widened. In 2012, median innovation economy earnings were double those of other workers. By 2014 the median innovation worker was earning 2.3 times more than the general labor force.14
Thus, across a number of measures, the science-based innovation workforce provides a tremendous boost to the overall economy, with better pay and job security going to those who work in the innovation sector.
Measuring the race and gender participation divide in U.S. innovation
Since the 1960s, both women and African Americans have obtained an increasing (though still not equal) share of bachelor’s degrees and advanced degrees in fields most associated with invention—the so-called STEM fields of science, technology, engineering, and mathematics. Despite this progress, I and my co-author Chaleampong Kongchareon at Michigan State University in a recent paper do not observe a similar increase in patenting activity among these groups.15
In general, women and African Americans remain underrepresented in the workplaces and boardrooms of high-tech firms in the United States. Today, both the lack of diversity in the venture capital industry and the paucity of women and African Americans who serve as executives and board members at high-tech companies receive regular attention.16 This innovation divide represents a lost opportunity and is a discriminatory drag on the U.S. economy. These distributional issues provide further evidence of the wide income and wealth gaps in the United States.
Economists draw on a wide range of metrics to define and measure participation in the innovation process.The National Science Foundation defines the science and engineering, or S&E, workforce in one of three ways:
- By the parts of the U.S. economy measured by workers in S&E occupations
- By the number of holders of S&E degrees
- By the use of technical expertise on the job17
The National Science Foundation collects data on science and engineering students, graduates, and workers using a variety of surveys and sources, including its Survey of Earned Doctorates and the National Center for Education Statistics’ Integrated Postsecondary Education Data System Completions Survey. Demographic data, such as gender, race, and ethnicity, are among the data collected. In addition to collecting data on fields of study, I have assembled NSF data on S&E doctoral degrees earned by women from 1966 to 2018 and African Americans from 1968 to 2019.
Another way to measure what I call the “pink and black” innovation divide between women and men and between Black Americans and White Americans is via patent data. Data on patents, recorded and disseminated by the U.S. Patent and Trademark Office, are available from 1790 to the present and thus provide a relatively consistent historical metric.18 Demographic data, such as gender, race, and ethnicity, are not explicitly recorded in patent data. To address this issue, my co-authors and I have developed sophisticated methods for inferring which historical and contemporary patents were granted to women and African Americans.19 I turn to this in the next section.
Understanding the reasons for these race and gender divides in innovation
Within the innovation process in the U.S. economy, both participation and salaries vary greatly by gender, race, and ethnicity. Importantly, these racial and gender gaps are manifested throughout different stages of the innovation process. In this section of my essay, I provide longitudinal, quantitative evidence to outline the nature and scope of these gaps over time.
I then complement this aggregate, statistical picture with historical and contemporary examples from individual women and African American innovators who were impacted by racial and gender discrimination during the innovation process. This analysis across different scales illuminates both the aggregate, macroeconomic impact and the intimate lived experience of the innovation gap in pink and black. And, consistent with the time frame of available NSF education data, I focus on patent data from 1966 to 2014.
An individual participates in the innovation economy by passing through three stages of the innovation process. First, innovation typically begins with formal education or training, such as an apprenticeship, in a chosen technical field, often but not exclusively in a STEM field. Second, workers in the innovation economy participate in actual invention in university or federal laboratories, corporate research facilities, government agencies, or less formal workspaces.
Finally, innovation, or the commercialization of invention, occurs when inventors sell or license their patents or launch a new start-up or business unit to profit directly from the development of the invention. Let’s now examine more closely these first two stages—the preparation and education divide and the invention divide—which lay the foundation for bridging the race and gender income divides in science and engineering jobs and the race and gender patent divides.
The preparation and education divides
Women and African Americans have enjoyed significantly improved access to technical training over the past few decades, but lingering education gaps remain. Women and African Americans have increasingly been involved at the beginning of the innovation process—for example, by getting doctorates in the sciences and doing basic research that undergirds changes in the stock, flow, and direction of knowledge.
In 1970, only 9 percent of all doctorates in the science and engineering fields were awarded to women. By 2014, the share going to women was nearly 42 percent. In 1970, only 1 percent of all S&E doctorates went to African Americans. By 2014, the share going to African Americans was roughly 4 percent. For context, African Americans represent just more than 13 percent of the population.20 The trends are similar for master’s and bachelor’s degrees, and are comparable through 2014.21 (See Figures 1 and 2.)
Figure 1
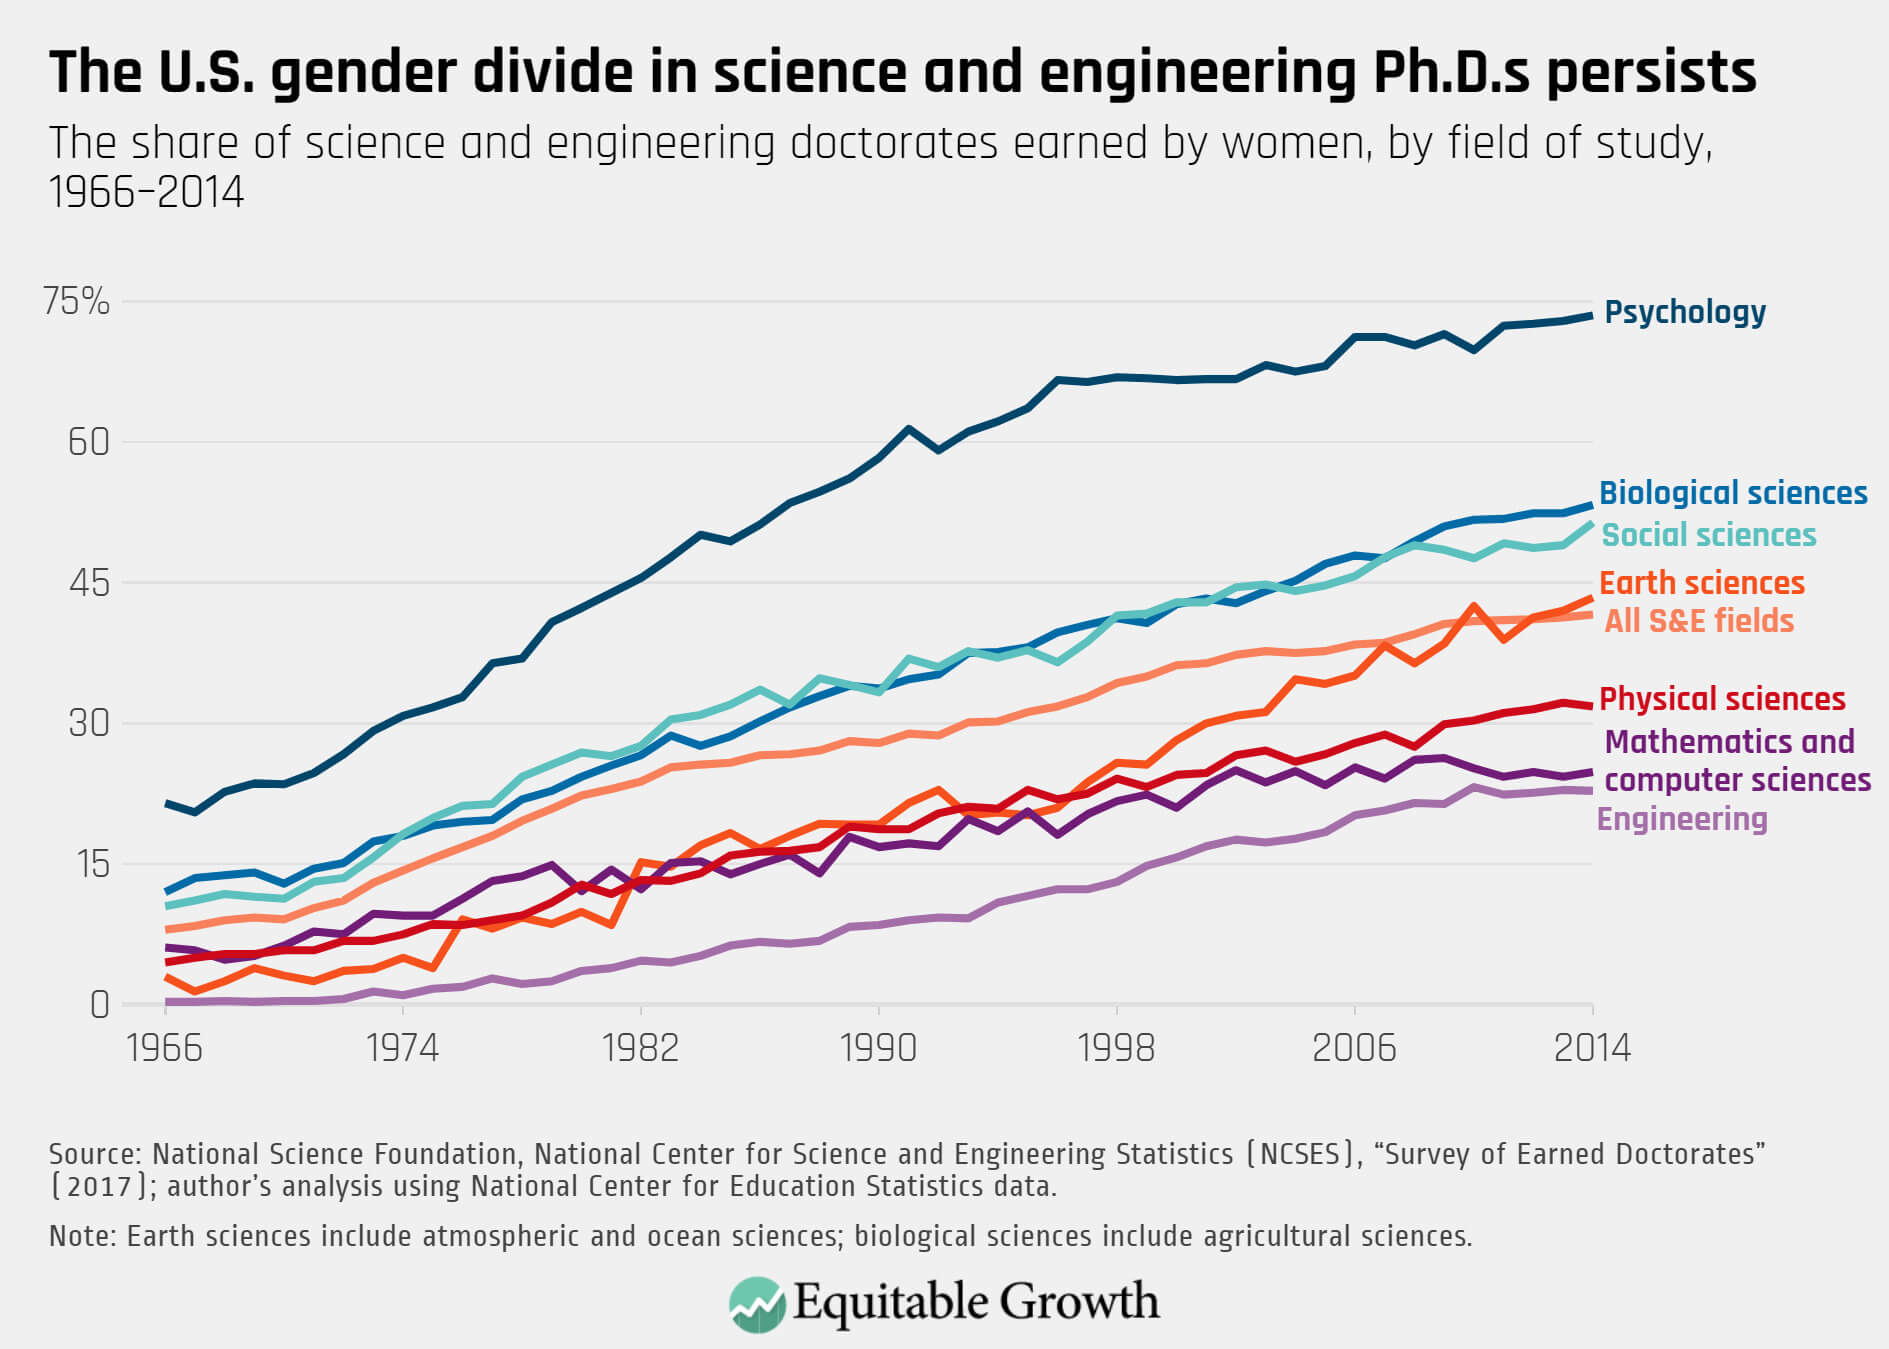
Figure 2

Increases among women and African Americans, however, have not been uniform across collegiate fields of study. Psychology starts off with the largest share of female science and engineering doctorate recipients in 1966 at 22 percent, and finishes with the largest share in 2016 at 75 percent, according to the most recent NSF data.22 Apart from the field of psychology, women have traditionally received the highest share of doctoral degrees in the life sciences (more than half of all degrees in biological sciences in 2016) and one of the lowest shares in engineering (24 percent in 2016).
This is important because engineering is the field most closely associated with patenting. There is a large literature that examines why few women enter the field of engineering, and how and why those few leave.23 Similarly, among STEM fields, the highest share of African American doctorates was in psychology (8 percent in 2014) and the lowest was in engineering (2 percent in 2014). African Americans also traditionally earned the highest share of doctorates in the life sciences and the lowest share in the physical sciences. In the 2000s, apart from psychology and the social sciences, the share of doctoral degrees going to African Americans has hovered between 2 percent and 3 percent.
With respect to education and training, women and African Americans are participating in increasing numbers over time. For both groups, a divide remains, however, and there is considerable heterogeneity of representation across fields. Examples of persistent barriers to women and African Americans pursuing degrees in STEM fields abound. Jennifer Selvidge, a former honors student in materials engineering at the Massachusetts Institute of Technology, captured the experiences of many women and African Americans. In her 2014 article, she reports that she was told “hundreds of times” that, as a woman, she did not deserve to be there, and that metallurgy was a “man’s field.”24
She also witnessed male professors attempting to publicly humiliate the small number of female professors, and sexual harassment by teaching assistants. In addition to observing people of color being actively advised to change majors and leave the department, she also was subject to a teaching assistant arguing that “Black Americans are genetically inferior due to slavery-era breeding practices.”25
The invention divides
The second stage in participating in the innovation process requires being involved in actual invention. Women and African Americans also have faced pervasive barriers to invention. For centuries, individual women and African Americans have had to battle the perception that they were mentally inferior and technically incompetent. Consequently, women and African Americans were not welcome in the White, male culture of corporate research and development labs. They were also barred from joining professional scientific and engineering societies until the mid-20th century, thus depriving them of the social capital and connections required to advance their careers and develop their inventions.26
Contemporary measures of invention activity among women and African Americans simultaneously reveal evidence of stifled dynamism in the U.S. labor market for inventors, despite their increased participation, due to lingering barriers to access and inclusion. Women’s participation in this invention stage is definitely on the rise. Between 1993 and 2010, the share of women working in a science and engineering field rose from 31 percent to 37 percent. Over the same period, women in science and engineering occupations rose from 23 percent to 28 percent.27 By 2017, women made up 29 percent of these workers, and the percent of African Americans working in these fields had increased to 13 percent.28
Yet both female and African American scientists and engineers are more likely to work in nonscience and engineering occupations than directly in these occupations. More than two-thirds of psychologists were women in 2015, and women are less concentrated in the computer and mathematical sciences and engineering, compared to men. In 2010, 25 percent of the workforce in computer and mathematical sciences were women, and in engineering, 13 percent were women; in 2017, these shares were 27 percent and 16 percent, respectively.29 Similar patterns are evident among African American scientists and engineers, though with several marked differences. (See Figure 3 and Figure 4.)
Figure 3
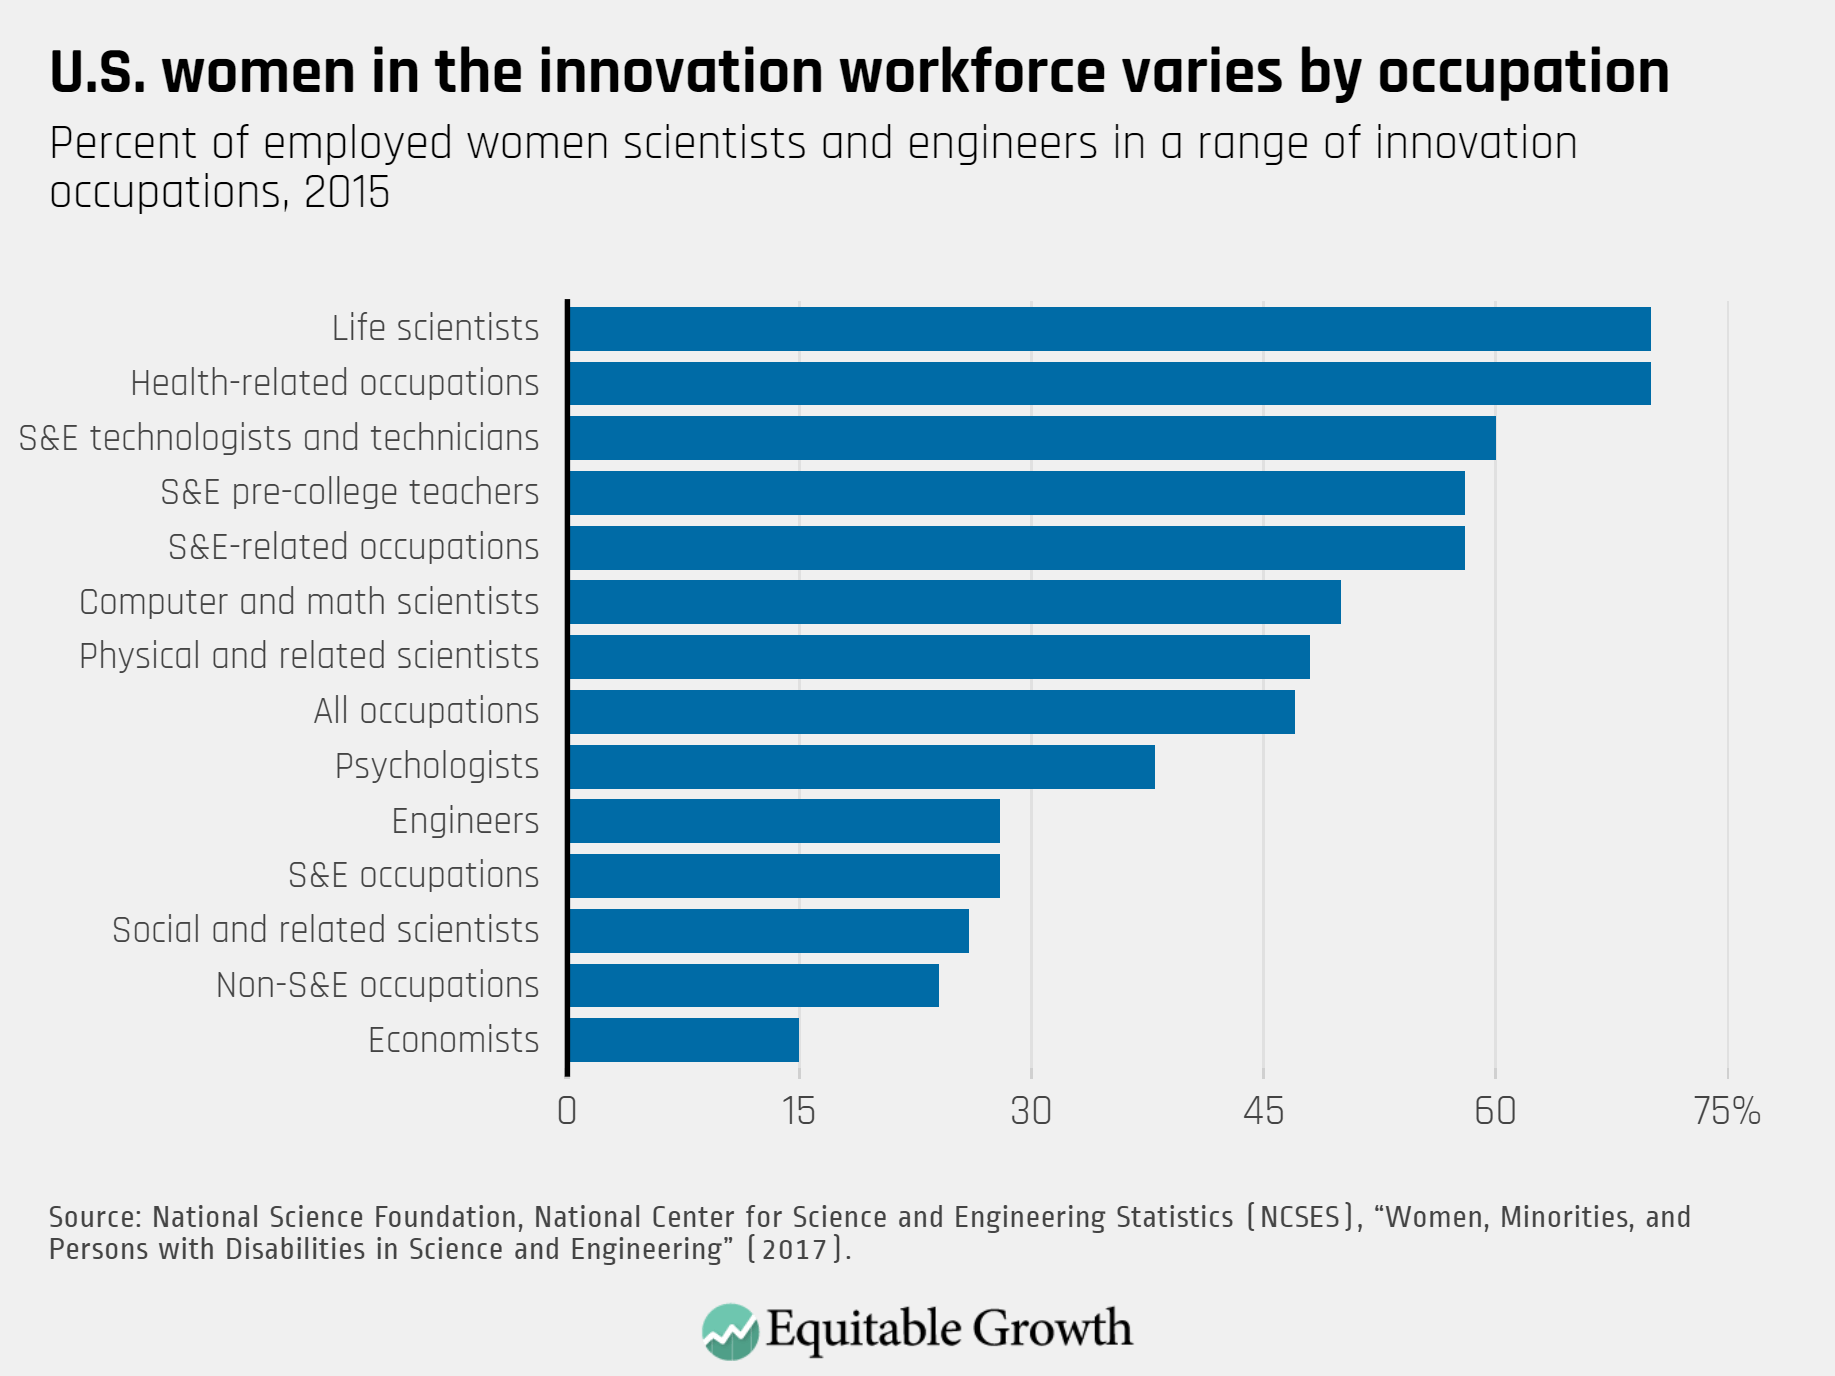
Figure 4
Concretely examining specific occupations within a field reveals even more telling data on these race and gender divides. More than half the people in S&E-related occupations are women. Among them, women constitute 71 percent of workers in health-related occupations, more than half of S&E precollege teachers, more than half of technologists and technicians in the life sciences, but just one-fifth of S&E technologists and technicians.
Female scientists and engineers constitute half of scientists and engineers in non-S&E occupations. Women often start their careers working in occupations that are part of the innovation process but then leave for various reasons, including the need to provide child care due to the lack of family-leave policies and because of intolerable workplace environments.30 Such departures have implications for the earnings of these scientists and engineers. For one thing, women’s wages will, on average, be lower in noninnovation occupations relative to wages within them. Furthermore, those lower wages will exacerbate inequality that exists between the innovation and noninnovation economies.
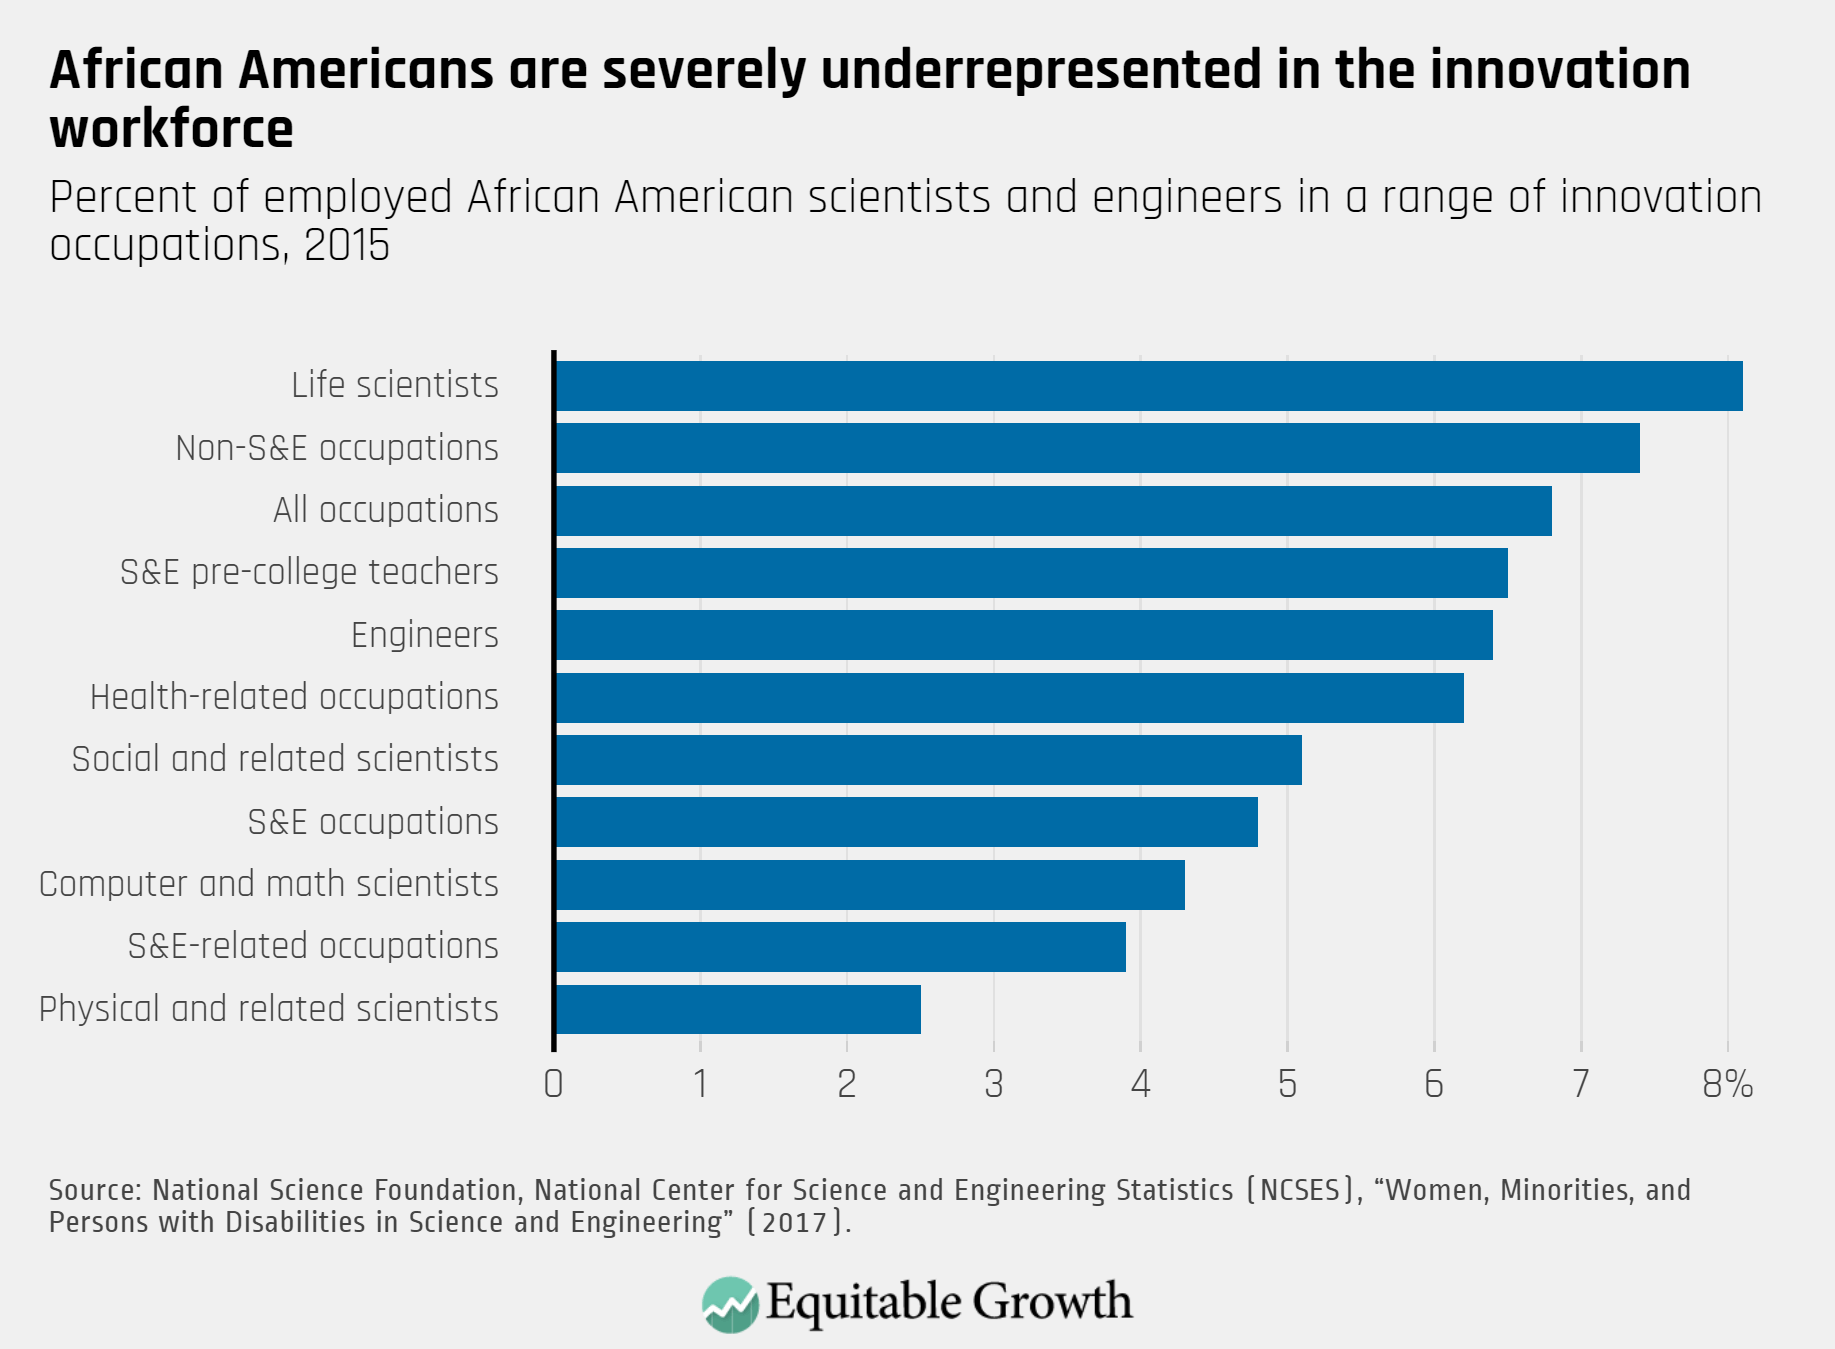
African American scientists and engineers make up just 4.8 percent of workers employed in S&E occupations. Among S&E occupations, African American scientists and engineers are more concentrated among social science-related occupations and among computer and math scientists and analysts than they are in other S&E occupations. Among S&E-related occupations, African American scientists and engineers, similar to the female scientists and engineers discussed above, are more concentrated in health-related occupations and in precollege teaching than in other S&E occupations. Almost twice as many African American scientists and engineers are in non-S&E occupations as are in S&E occupations.
Unemployment rates among scientists and engineers reveal discrimination in the innovation jobs in the U.S. labor market, too. Unemployment for African American and Hispanic men, at just more than 4 percent, is higher than for White and Asian men, and higher than the average for all scientists and engineers.31 (See Figure 5.)
Figure 5
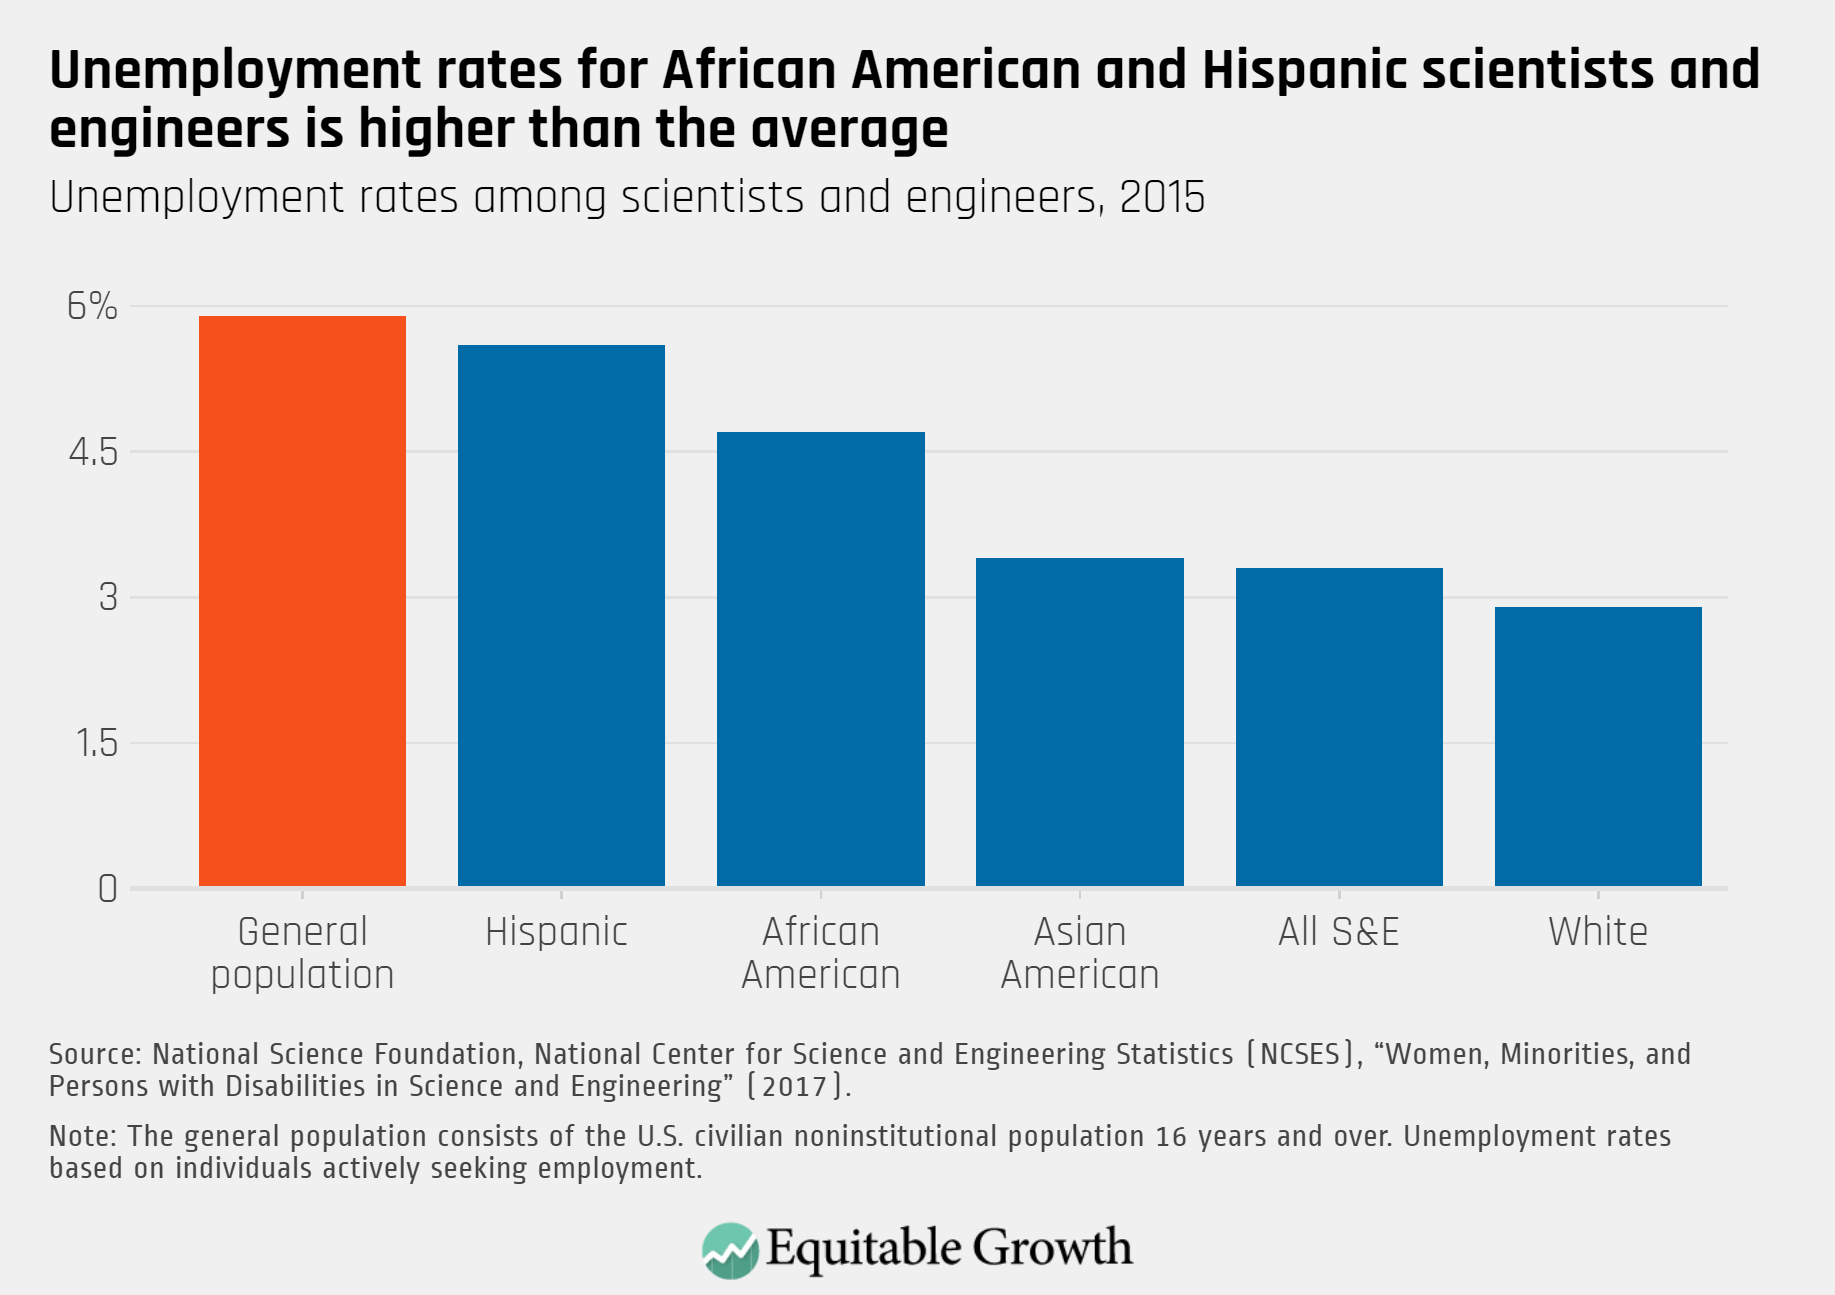
Although not illustrated above, the unemployment rate for African American women in science and engineering occupations is higher than the unemployment rate overall—nearly double that of all scientists and engineers, and more than double that of White female scientists and engineers. Similar to the data on occupations, the data on enemployment indicate that the consequences of discrimination within science and engineering occupations are higher income inequality within these sectors of the economy. Unemployed scientists and engineers will likely be poorer and less able to accumulate wealth, compared to their employed counterparts.
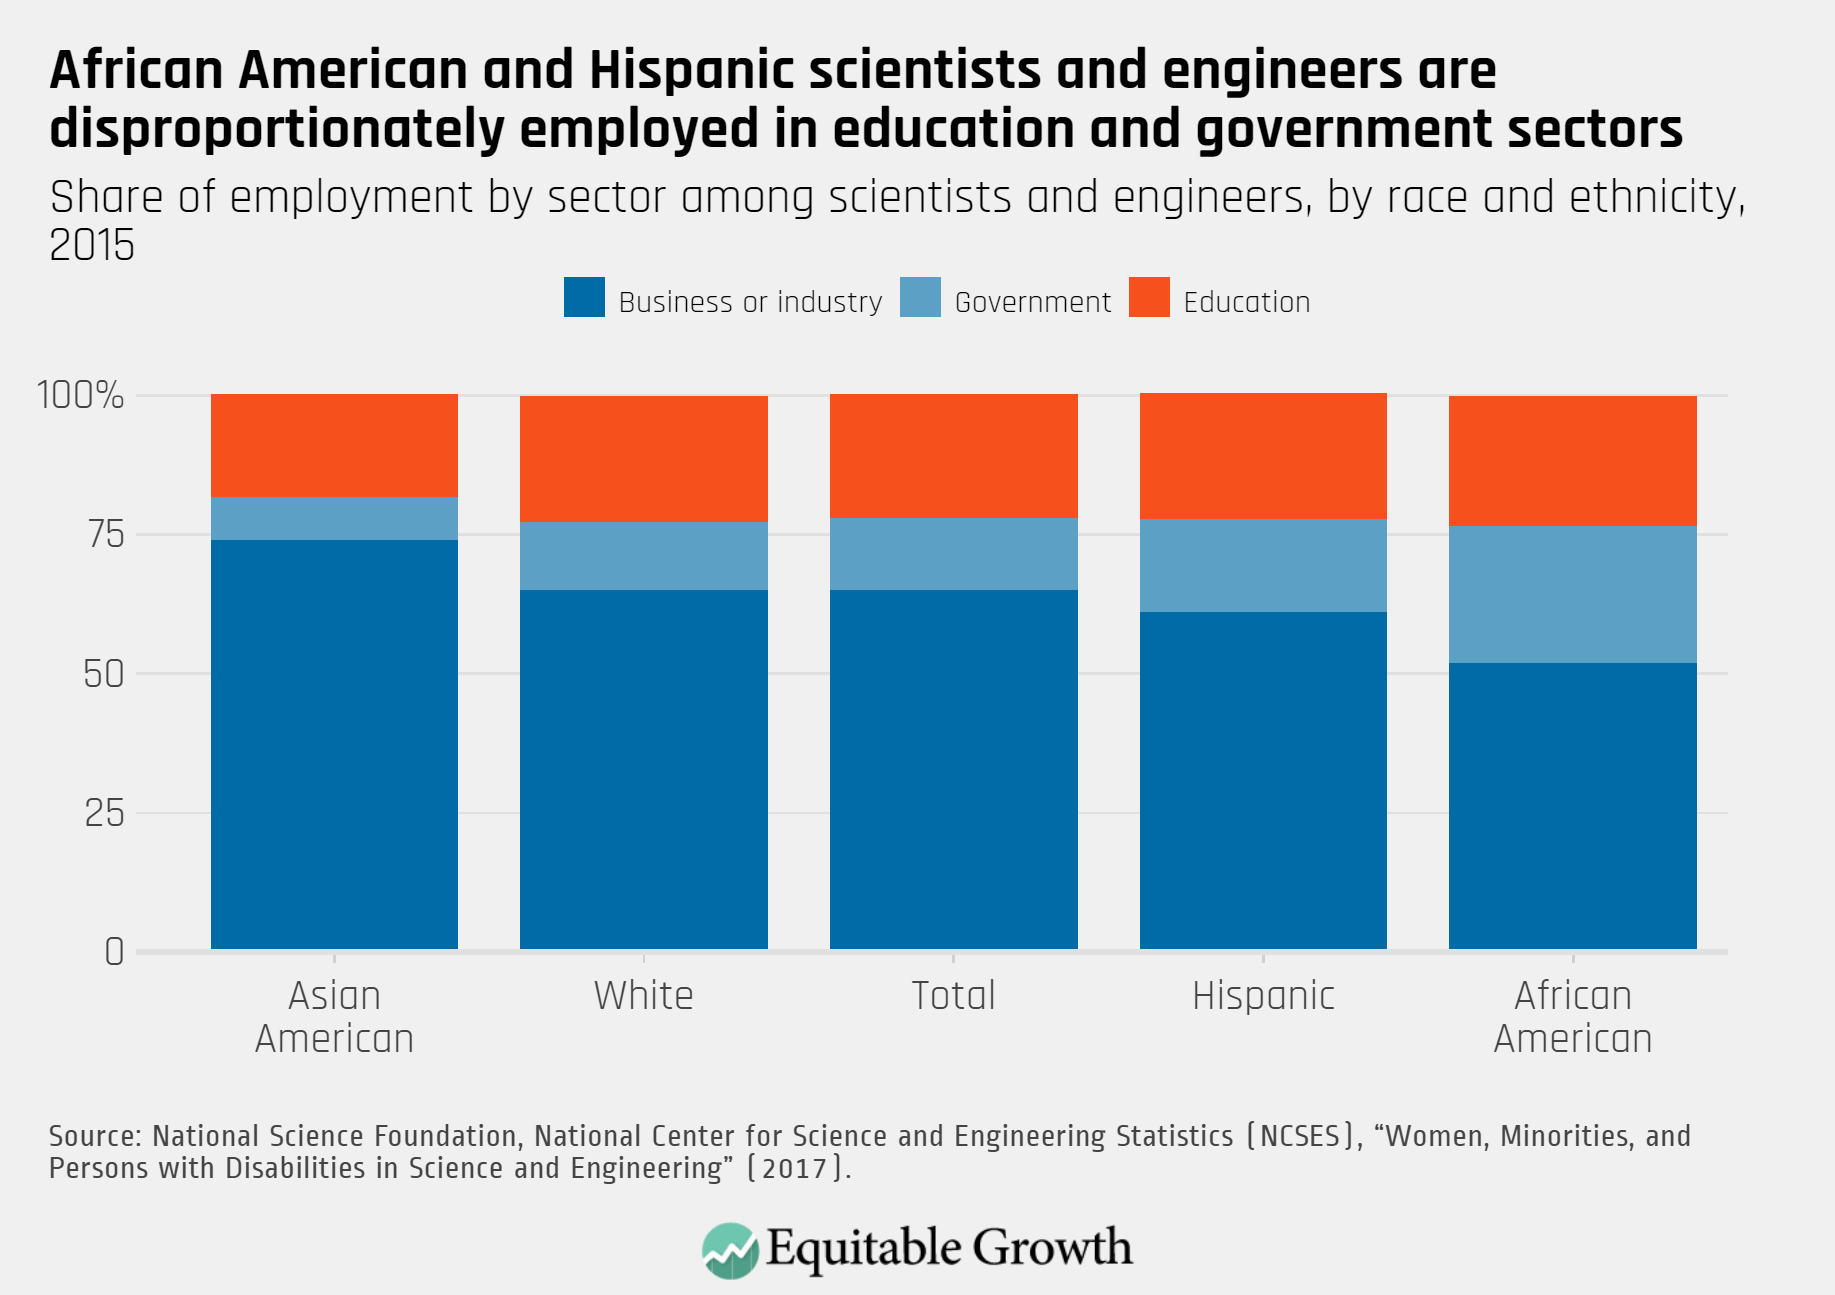
Digging deeper into the data on sectors of employment among scientists and engineers by race and ethnicity reveals further divides in participation in the innovation process. Most scientists and engineers are employed in business or industry. For African Americans and Hispanics, the second and third sectors of employment are education and government. On average, government and education salaries are lower than those in business or industry, further deepening the income inequality among S&E workers. (See Figure 6.)
Figure 6
Just as incomes vary between occupations in the innovation process and jobs in the rest of the economy, incomes also vary among those within innovation occupations themselves. Among other things, they differ by gender and race. The median salary for men in the innovation economy in 2010 was $80,000, but it was only $53,000 for women, or 66 percent of the median male salary.32 In 2017, the median salary for scientists and engineers was $90,000 for men, yet it was only $66,000 for women, or 73 percent of the median male salary.33
Some of this wage divide is attributable to the different occupations people perform across race and gender lines, with more White men in S&E occupations, which tend to be higher-paid. If considering only S&E occupations, the share of female-to-male median salary narrows to 81 percent and ranges from 77 percent for ages 29 and younger to 85 percent for ages 50 to 75. The share of female-to-male median salary is slightly higher in S&E-related occupations, 73 percent, and slightly lower for non-S&E occupations, 69 percent. “Mathematical scientist” is the only occupation in which the median female salary exceeds the median male salary, and the ratio of female-to-male median salary is 1.13.34
Indeed, the earnings or income divide between workers engaged in the innovation process and those employed across the overall economy is substantial. Innovation workers earned 63 percent more than the average U.S. worker in 2014, the most recent year for which complete data are available.35 Yet the gender and racial earnings divides among innovation workers and the overall economy is telling. The salaries of African American female scientists and engineers, for example, are 87 percent of what White women earn in all occupations, yet there is salary parity in science and engineering occupations for African American and White women.
Similarly, the median salary for African American women in S&E-related occupations also is at parity with White women, yet the median salary for African American women in non-S&E occupations is 83 percent of the median salary for White women. The largest gaps within S&E occupations are among psychologists (83 percent) and computer scientists (87 percent). Among mathematical scientists, the ratio of the median salary of African American women-to-White women is 1.21.36
The gap between the median salary for African American and White workers is not as large as it is between men and women. In 2010, the median salary for White full-time workers with the highest degree in an S&E field was $72,000, and for their African Americans counterparts, it was $56,000, or 78 percent of the median salary for White workers.37 In 2015, this share had moved only slightly, to 79 percent. For S&E occupations, this share narrows to 92 percent. Among S&E occupations, the gap is widest among psychologists (65 percent) and physical scientists (67 percent). There is parity in engineering, and, like women, mathematical scientists’ median salary for African Americans is higher than the median salary for White workers, with a ratio of 1.13.38
In 2015, the share of median African American salary-to-White salary for S&E-related occupations is also 92 percent. As is the case for women, this share is lowest in non-S&E occupations, at 70 percent.39 With respect to employment and salary data, the gaps in participation that existed even 7 years ago are closing. Yet gaps remain with respect to gender and race.
The patent divides
Legal access to the U.S. patent system offered greater, but still limited, opportunities for women and African Americans. There was no language in the original Patent Act of 1790 limiting patentees based on gender, race, age, or religion. Consequently, in the decades before emancipation and universal suffrage, women and (free) African Americans could—and did—invent and earn U.S. patents.40
Still, women and African Americans did not have equal protection under the patent laws. While free African Americans were allowed to obtain patents, the U.S. Patent and Trademark Office refused to grant patents to enslaved African Americans. Moreover, laws in many states assigned all marital property rights to husbands, which effectively prohibited married women from owning or controlling patents in their own names. These draconian social norms and policies deterred many women and African Americans from even becoming inventors.41
Patent data provide another, albeit imperfect, means of measuring invention activity.42 In earlier research, my colleagues and I demonstrated that women and African Americans lag far behind other U.S. inventors with respect to patent activity. Using USPTO data from 1970 to 2006, we calculated that patent output for all U.S. inventors is 235 patents per million. But for women, the number is 40 patents per million. And for African Americans, it is 6 patents per million.43
Moreover, researchers find that a propensity to patent is correlated with prior exposure to invention activity, and multigenerational income and wealth disparities. Children from high-income families who grow up around other inventors are more likely to patent, while children from low-income families with limited exposure to emerging technology are less likely to patent.44
Taken together, these findings and others suggest a misallocation of resources that could lead to suboptimal levels and rates of economic growth that could persist across generations. For example, patent teams made up of both men and women are more productive than single-sex teams with respect to the most valuable patents. Patent teams, firms, and the economy will continue to perform at suboptimal levels without diverse teams and inclusion more generally.45
The potential for discrimination to contribute to the invention divides was on public display in the summer and fall of 2017. A Google engineer, James Damore, wrote a memo that leaked and went viral. This memo, directed at diversity initiatives at the company, argued that women were underrepresented in technology careers because of “inherent psychological differences” between the genders.46 Google dismissed Damore for “perpetuating gender stereotypes.”47
A few weeks later, a former Google software engineer, Kelly Ellis, and two other women sued Google, alleging discrimination in both the pay and promotion of women. Coincidentally, the U.S. Department of Labor, in an ongoing investigation of Google’s gender gap in salaries, reported its finding of systemic discrimination of women at Google in the spring of 2017.48
There is a large literature that suggests that unequal salaries and promotions could depress women’s interest in pursuing S&E degrees and careers, resulting in underrepresentation of women. The number of complaints and lawsuits against tech firms related to discrimination related to pay and promotions based on gender and race is increasing, which suggests both of these issues are being taken more seriously—why incur the costs associated with filing a complaint or lawsuit otherwise?—and that there is a role for policymaking in addressing these race and gender hurdles to stronger economic growth.
Policies to increase participation and wages in the innovation economy
The U.S. economy and society will never fully realize its scientific potential and ever-higher economic growth and living standards without including more women, African Americans, and others who are still actively or passively discouraged from earning degrees in STEM fields and training for STEM careers. There are four areas in which policymakers can make changes to resolve this problem in our society and our economy:
- Mentoring
- Early education about inventing
- Blind patent reviews
- High-tech workplace climates
Lets examine each policy idea in turn.
Mentoring
Mentoring is one broadly suggested tool to address the gender and race divides in STEM careers.
As detailed in the analysis above, the income, race, and gender gaps in invention are primarily due to barriers in acquiring human capital—the lack of mentoring and exposure to careers in science and innovation in childhood—and not due to differences in ability.49 What’s more, the effectiveness of mentoring is recognized beyond academic papers and university programs, with programs designed to make a difference.
One such program is the Makers + Mentors Network (formerly US2020), an organization focused on programming that supports underserved and underrepresented students. Its mission is to change the trajectory of STEM education in the United States by dramatically scaling the number of STEM professionals engaged in high-quality STEM mentoring with youth. The Makers + Mentors Network is building a community of companies, organizations, schools, government agencies, and cities to participate in mentoring. It seeks to encourage 1 million science, technology, engineering, and math professionals to mentor students in Kindergarten through graduate school.50
The Makers + Mentors Network currently operates in 21 communities across the country, serving more than 150,000 students and 20,000 mentors annually.51 The program also places AmeriCorps VISTA members within the organization and with its local community efforts, and is launching a Maker Fellows program in partnership with local community colleges and historically black colleges and universities. The Makers + Mentors Network connects students with STEM professionals within their communities through official mentorship programs, hands-on learning experiences, and afterschool and summer programs. More public investment and partnerships with these and other mentorship efforts can further strengthen the foundation of innovation and design for students at key moments in their education and career choices.
Early education about invention
Exposing children to invention and innovation is becoming a more recognized method of increasing participation. Doing so could foster more representation for women and African Americans early in the education pipeline and eventually at high levels in STEM fields.
An example of this kind of public-private engagement in early eduation and invention is the Spark Lab at the Lemelson Center for Invention and Innovation at the Smithsonian Institution. This is an activity space that allows children to create an invention and to help them think about making the invention useful. We recommend targeting low-income children, children of color from underrepresented groups, and female children for such activities, with more fiscal resources deployed to take this kind of program national to science museums around the nation.
Blind patent reviews
As detailed above, inequality in patent applications is a legacy of historic racial and gender discrimination that persists to this day. A recent paper in Nature finds that, all else being equal, patent applications with women as lead inventors are rejected more often than those with men as lead inventors.52
An easy fix would be for the U.S. Patent and Trademark Office to engage in the blind review of patent applications by patent examiners, so that names of patent applicants are not visible to reviewers, as this allows for the possibility of discrimination by race and gender.
High-tech workplace climates
Workplace issues for women and African Americans go beyond the opportunity to participate in invention and innovation. Other issues now stand in stark relief due to recent events related to workplace climate, such as recent activities, protests, and discussions at Google and Microsoft. Among the issues identified are ones that have been reported on about the climate in similar workplaces, such as lack of transparency (including forced arbitration for sexual harassment claims), workplace culture, and pay and opportunity inequality.
Most patented inventions occur at firms. Therefore, at public companies, shareholders need to hold CEOs more accountable for workplace climate, and, for private companies, boards and CEOs should do the same. Congress also could play a role in bolstering the U.S. Equal Employment Opportunity Commission to investigate such complaints and help to minimize the frequency and intensity of hostile workplaces for women and African Americans.
As is the case for the rest of the U.S. economy, greater representation for workers in the innovation process seems warranted to effectively and sustainably address workplace-related issues. The recent unionization of Google workers is a promising step in helping address discrimination, harassment, and other workplace climate issues, as well as creating more inclusive organizations more broadly.
Conclusion
In a recent paper, I outline proposals to address the commercialization phase of the innovation process, including collecting demographic data on inventors, enhancing the Small Business Administration’s programs related to innovation to promote diversity and inclusion, and improving the climate in the fields and workspaces where these innovations take place.53 Creating a more inclusive innovation ecosystem will increase the participation of women, African Americans, and other underrepresented demographic groups at every stage of the innovation and commercialization process, from early education and training to the practice of invention and the later economic gains from those breakthroughs.
Taken together, these proposals could augment the participation of women and African Americans in the innovation process and boost wages for them across the innovation sector. Doing so would boost innovation and thus the productivity of the U.S. economy, and ensure the fruits of economic growth are more broadly shared—thus reinforcing more sustainable economic growth.
—Lisa D. Cook is a member of the Washington Center for Equitable Growth’s Steering Committee and professor of economics and international relations at Michigan State University.
Acknowledgments