Economic growth in the United States: A tale of two countries

Overview
The rise of economic inequality is one of the most hotly debated issues today in the United States and indeed in the world. Yet economists and policymakers alike face important limitations when trying to measure and understand the rise of inequality.
One major problem is the disconnect between macroeconomics and the study of economic inequality. Macroeconomics relies on national accounts data to study the growth of national income while the study of inequality relies on individual or household income, survey and tax data. Ideally all three sets of data should be consistent, but they are not. The total flow of income reported by households in survey or tax data adds up to barely 60 percent of the national income recorded in the national accounts, with this gap increasing over the past several decades.1
This disconnect between the different data sets makes it hard to address important economic and policy questions, such as:
- What fraction of economic growth accrues to those in the bottom 50 percent, the middle 40 percent, and the top 10 percent of the income distribution?
- What part of the rise in inequality is due to to changes in the share of national income that goes to workers (labor income) and owners (capital income) versus changes in how these labor and capital incomes are distributed among individuals?
A second major issue is that economists and policymakers do not have a comprehensive view of how government programs designed to ameliorate the worst effects of economic inequality actually affect inequality. Americans share almost one-third of the fruits of economic output (via taxes that help pay for an array of social services) through their federal, state, and local governments. These taxes collectively add up to about 30 percent of national income, and are used to fund transfers and public goods that ultimately benefit all U.S. families. Yet we do not have a clear measure of how the distribution of pre-tax income differs from the distribution of income after taxes are levied and after government spending is taken into account. This makes it hard to assess the extent to which governments make income growth more equal.2
In a recent paper, the three authors of this issue brief attempt to create inequality statistics for the United States that overcome the limitations of existing data by creating distributional national accounts.3 We combine tax, survey, and national accounts data to build a new series on the distribution of national income. National income is the broadest measure of income published in the national accounts and is conceptually close to gross domestic product, the broadest measure of economic growth.4 Our distributional national accounts enable us to provide decompositions of growth by income groups consistent with macroeconomic growth.
How to deliver equitable growth: 14 strategies for the next administration
In our paper, we calculate the distribution of both pre-tax and post-tax income. The post-tax series deducts all taxes and then adds back all transfers and public spending so that both pre-tax and post-tax incomes add up to national income. This allows us to provide the first comprehensive view of how government redistribution in the United States affects inequality. Our benchmark series use the adult individual as the unit of observation and split income equally among spouses in married couples. But we also produce series where each spouse is assigned their own labor income, allowing us to study gender inequality and its impact on overall income inequality. In this short summary, we would like to highlight three striking findings.
Our first finding—a surge in income inequality
First, our data show that the bottom half of the income distribution in the United States has been completely shut off from economic growth since the 1970s. From 1980 to 2014, average national income per adult grew by 61 percent in the United States, yet the average pre-tax income of the bottom 50 percent of individual income earners stagnated at about $16,000 per adult after adjusting for inflation.5 In contrast, income skyrocketed at the top of the income distribution, rising 121 percent for the top 10 percent, 205 percent for the top 1 percent, and 636 percent for the top 0.001 percent. (See Figures 1 and 2.)
Figure 1
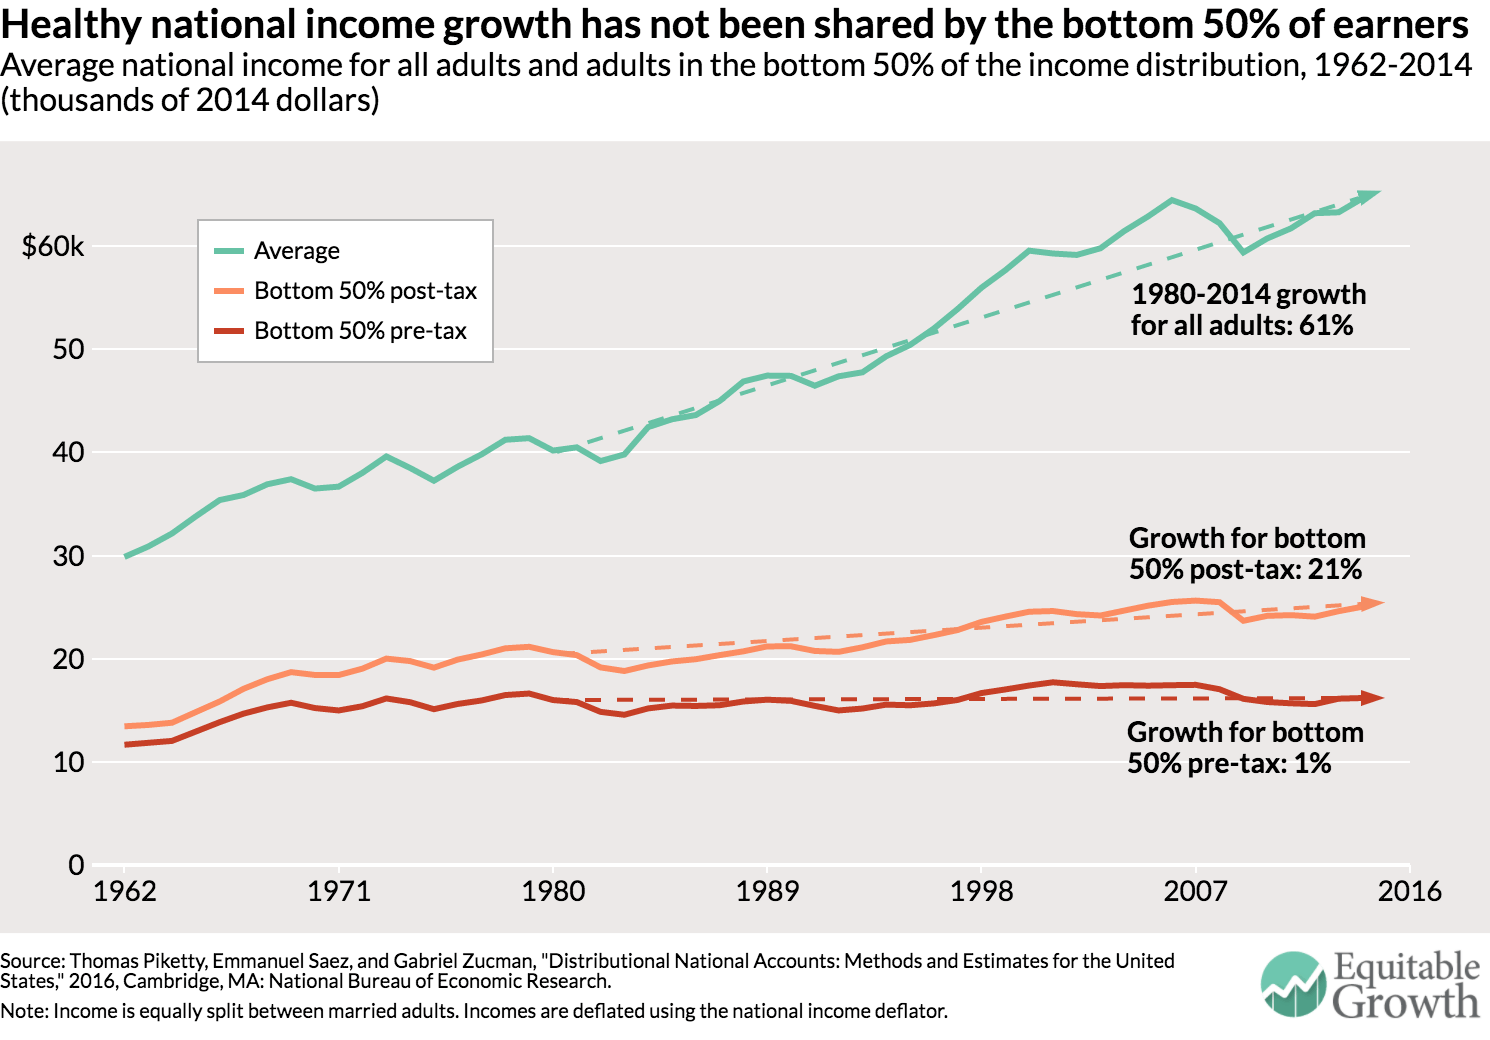
Figure 2
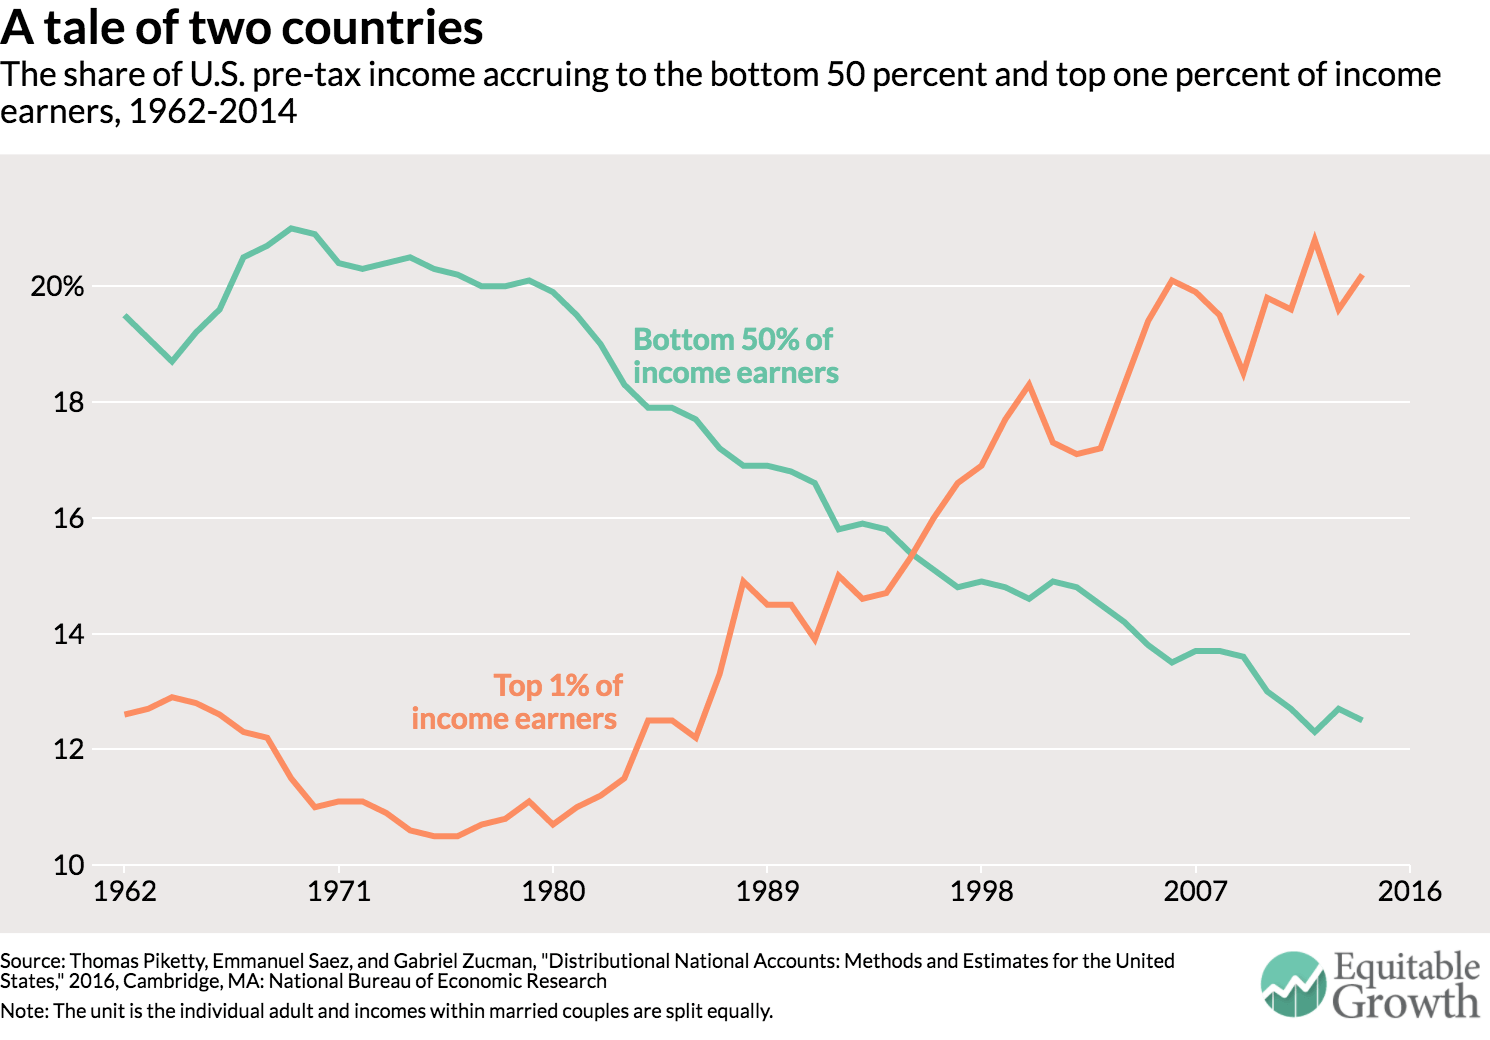
It’s a tale of two countries. For the 117 million U.S. adults in the bottom half of the income distribution, growth has been non-existent for a generation while at the top of the ladder it has been extraordinarily strong. And this stagnation of national income accruing at the bottom is not due to population aging. Quite the contrary: For the bottom half of the working-age population (adults below 65), income has actually fallen. In the bottom half of the distribution, only the income of the elderly is rising.6 From 1980 to 2014, for example, none of the growth in per-adult national income went to the bottom 50 percent, while 32 percent went to the middle class (defined as adults between the median and the 90th percentile), 68 percent to the top 10 percent, and 36 percent to the top 1 percent. An economy that fails to deliver growth for half of its people for an entire generation is bound to generate discontent with the status quo and a rejection of establishment politics.
Because the pre-tax incomes of the bottom 50 percent stagnated while average national income per adult grew, the share of national income earned by the bottom 50 percent collapsed from 20 percent in 1980 to 12.5 percent in 2014. Over the same period, the share of incomes going to the top 1 percent surged from 10.7 percent in 1980 to 20.2 percent in 2014.7 As shown in Figure 2, these two income groups basically switched their income shares, with about 8 points of national income transferred from the bottom 50 percent to the top 1 percent. The gains made by the 1 percent would be large enough to fully compensate for the loss of the bottom 50 percent, a group 50 times larger.
To understand how unequal the United States is today, consider the following fact. In 1980, adults in the top 1 percent earned on average 27 times more than bottom 50 percent of adults. Today they earn 81 times more. This ratio of 1 to 81 is similar to the gap between the average income in the United States and the average income in the world’s poorest countries, among them the war-torn Democratic Republic of Congo, Central African Republic, and Burundi. Another alarming trend evident in this data is that the increase in income concentration at the top in the United States over the past 15 years is due to a boom in capital income. It looks like the working rich who drove the upsurge in income concentration in the 1980s and 1990s are either retiring to live off their capital income or passing their fortunes onto heirs.
Our second finding—policies to ameliorate income inequality fall woefully short
Our second main finding is that government redistribution has offset only a small fraction of the increase in pre-tax inequality. As shown in Figure 1, the average post-tax income of the bottom 50 percent of adults increased by only 21 percent between 1980 and 2014, much less than average national income. This meager increase comes with two important limits.
First, there was almost no growth in real (inflation-adjusted) incomes after taxes and transfers for the bottom 50 percent of working-age adults over this period because even as government transfers increased overall, they went largely to the elderly and the middle class. Second, the small rise of the average post-tax income of the bottom 50 percent of income earners comes entirely from in-kind health transfers and public goods spending. The disposable post-tax income—including only cash transfers—of the bottom 50 percent stagnated at about $16,000. For the bottom 50 percent, post-tax disposable income and pre-tax income are similar—this group pays roughly as much in taxes as it receives in cash transfers.
Our third finding—comparing income inequality among countries is enlightening
Third, an advantage of our new series is that it allows us to directly compare income across countries. Our long-term goal is to create distributional national accounts for as many countries as possible; all the results will be made available online on the World Wealth and Income Database. One example of the value of these efforts is to compare the average bottom 50 percent pre-tax incomes in the United States and France.8 In sharp contrast with the United States, in France the bottom 50 percent of real (inflation-adjusted) pre-tax incomes grew by 32 percent from 1980 to 2014, at approximately the same rate as national income per adult. While the bottom 50 percent of incomes were 11 percent lower in France than in the United States in 1980, they are now 16 percent higher. (See Figure 3.)
Figure 3
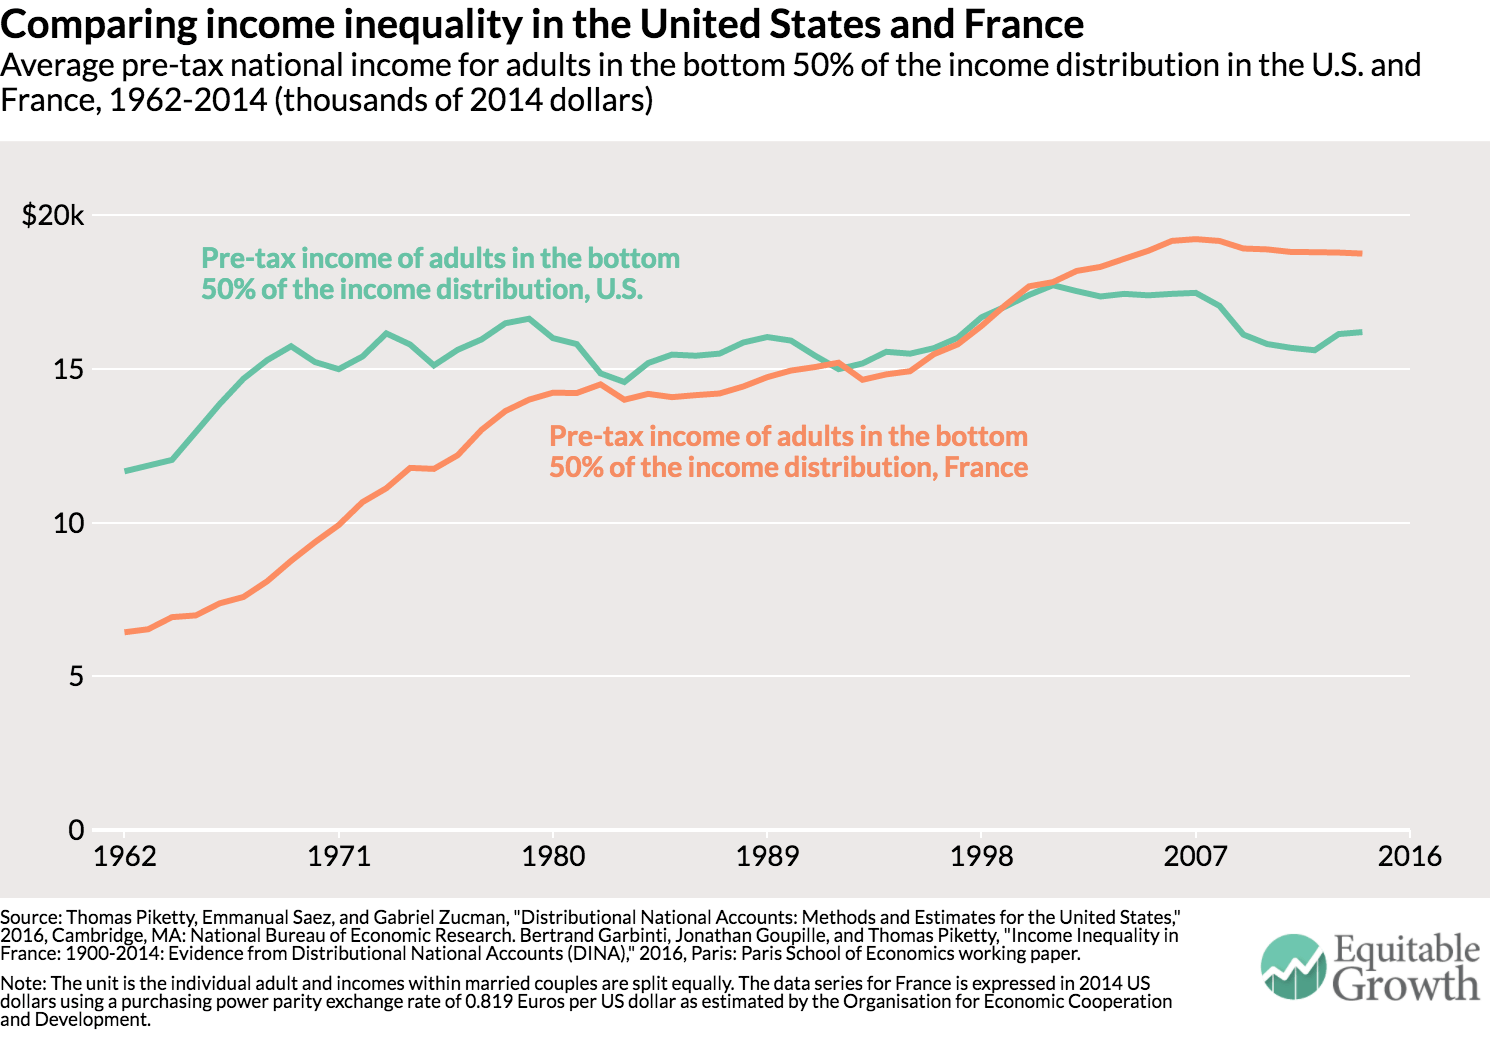
The bottom 50 percent of income earners makes more in France than in the United States even though average income per adult is still 35 percent lower in France than in the United States (partly due to differences in standard working hours in the two countries).9 Since the welfare state is more generous in France, the gap between the bottom 50 percent of income earners in France and the United States would be even greater after taxes and transfers.
The diverging trends in the distribution of pre-tax income across France and the United States—two advanced economies subject to the same forces of technological progress and globalization—show that working-class incomes are not bound to stagnate in Western countries. In the United States, the stagnation of bottom 50 percent of incomes and the upsurge in the top 1 percent coincided with drastically reduced progressive taxation, widespread deregulation of industries and services, particularly the financial services industry, weakened unions, and an eroding minimum wage.
Conclusion
Given the generation-long stagnation of the pre-tax incomes among the bottom 50 percent of wage earners in the United States, we feel that the policy discussion at the federal, state, and local levels should focus on how to equalize the distribution of human capital, financial capital, and bargaining power rather than merely the redistribution of national income after taxes. Policies that could raise the pre-tax incomes of the bottom 50 percent of income earners could include:
- Improved education and access to skills, which may require major changes in the system of education finance and admission
- Reforms of labor market institutions to boost workers’ bargaining power and including a higher minimum wage
- Corporate governance reforms and worker co-determination of the distribution of profits
- Steeply progressive taxation that affects the determination of pay and salaries and the pre-tax distribution of income, particularly at the top end
The different levels of government in the United States today obviously have the power to make income distribution more unequal, but they also have the power to make economic growth in America more equitable again. Potentially pro-growth economic policies should always be discussed alongside their consequences for the distribution of national income and concrete ways to mitigate their unequalizing effects. We hope that the distributional national accounts we present today can prove to be useful for such policy evaluations.
We will post online our complete distributional national accounts micro-data. These micro-files make it possible for researchers, journalists, policymakers, and any interested user to compute a wide array of distributional statistics—income, wealth, taxes paid and transfers received by age, gender, marital status, and other measures—and to simulate the distributional consequences of tax and transfer reforms in the United States.
—Thomas Piketty is a professor of economics at the Paris School of Economics. Emmanuel Saez is a professor of economics and director of the Center for Equitable Growth at the University of California-Berkeley. Gabriel Zucman is an assistant professor of economics at the University of California-Berkeley. They are co-directors of the World Wealth and Income Database, together with economists Facundo Alvaredo at the Paris School of Economics and Anthony Atkinson at Oxford University.
End Notes
1. Many important forms of income, such as fringe benefits of employees, retained profits and taxes paid by corporations, or imputed rent of homeowners, are part of U.S. national income but are not included in individual survey or tax data.
2. Official U.S. Census Bureau household income statistics are based on money income. Money income does not subtract individual taxes but adds back cash (but not in-kind) transfers. Hence, it is a mixed concept in between pre-tax and post-tax. It is conceptually sounder to focus separately on pre-tax and post-tax income. The U.S. Congressional Budget Office evaluates the federal tax burden by income groups but does not factor in state and local taxes (U.S. Congressional Budget Office, “The Distribution of Household Income and Federal Taxes, 2013”, 2016, Washington DC: U.S. Congressional Budget Office) and does not try to assign the benefits of federal government spending back to individuals.
3. Thomas Piketty, Emmanuel Saez, and Gabriel Zucman, “Distributional National Accounts: Methods and Estimates for the United States”, Cambridge MA: NBER Working Paper, December 2016, http://gabriel-zucman.eu/files/PSZ2016.pdf.
4. National income is gross domestic product minus capital depreciation plus net income received from abroad. Capital depreciation is not income and income from abroad is important, particularly among top earners.
5. All our data are expressed in constant 2014 dollars, using the national income deflator.
6. Our pre-tax income series are based on income after the operation of private and public pensions so that pension and social security income is included in pre-tax income (and the corresponding contributions are deducted). We also estimate series for factor income (before the operation of pension systems). Factor income series also display stagnation of bottom 50 percent of incomes since 1980. We prefer using pre-tax income series which give the elderly reasonable incomes so that aging has little impact on our inequality series.
7. This 9.5 points increase in the top 1 percent of the pre-tax U.S. national income share is similar in magnitude to the increase estimated in the Piketty-Saez series, where the top 1 percent income share (when including realized capital gains) increases by 11.4 points from 10 percent in 1980 to 21.4 percent in 2014. The Piketty-Saez series are based on a fiscal income concept, which captures only about two-thirds of total national income, and they use the family tax unit instead of the adult unit (see Thomas Piketty and Emmanuel Saez “Income Inequality in the United States, 1913-1998,” Quarterly Journal of Economics, 118(1), 2003, 1-39.)
8. The results for France are presented in Bertrand Garbinti, Jonathan Goupille, and Thomas Piketty, “Inequality Dynamics in France, 1900-2014: Evidence from Distributional National Accounts (DINA),” 2016, Paris: Paris School of Economics working paper.
9. In these calculations, we apply the 2014 Purchasing Power Parity exchange rate of 0.819 Euros per US dollar estimated by the Organisation of Economic Cooperation and Development.