Income inequality and aggregate demand in the United States

Income inequality has been on the rise for decades in the United States, but a new working paper looks at how that might be affecting macroeconomic activity through the aggregate demand channel.

Income inequality has been rising for decades in the United States. While there are many reasons why this trend may be concerning, one particular worry for economists and policymakers is the effect that it might have on macroeconomic activity through what is sometimes called the aggregate demand channel. The argument is as follows: There is some evidence that the rich save more than the poor. A rise in income inequality implies more income accruing to the rich, a trend that may be depressing overall consumption and in turn lowering aggregate output and employment.

A competing argument, however, focuses on the resulting increase in savings, which could be expected to translate into an increase in investment, raising the capital stock and economic output in the future. In this view, higher income inequality creates some losers, but it leads to an increase in aggregate Gross Domestic Product. Whether the first or the second effect dominates depends on what macroeconomists call general equilibrium considerations, and in particular, on our presumptions about the response of monetary policy to rising income inequality. This column examines those two effects, based on our newly released working paper.

A model of the effect of income inequality on aggregate demand

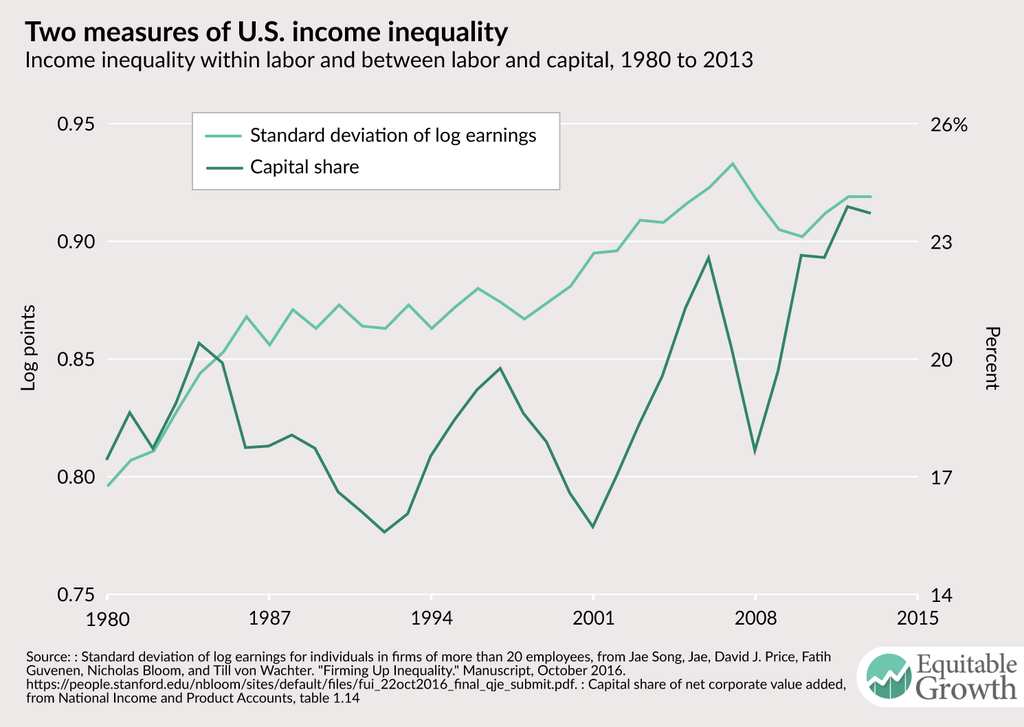
Before turning to that analysis, let us first briefly establish the basis of our inquiry-rising income inequality. Two common measures of inequality in the United States are the standard deviation of log earnings (a measure of inequality within labor income) and the capital share (a measure of inequality between labor and capital). As has been widely documented, both measures have risen since the 1980s.1 (See Figure 1.)

Figure 1

Up until now, most general equilibrium macroeconomic models that were used to evaluate the effects of rising inequality were built under the assumption that the U.S. Federal Reserve would immediately accommodate increases in income inequality by lowering interest rates. Those models accord with the second view-that inequality leads the Fed to lower the cost of capital, encouraging investment, which can lead to an economic boom. In our paper, we show that if we assume that monetary policy has limited willingness or ability to respond to the rise in inequality, then the outcome for GDP looks more concerning.2 Lower consumption lowers employment and individual incomes, feeding back into even lower consumption. Firms disinvest because they anticipate lower employment in the future, and this lowers incomes even further.

Our new model fits known facts about individuals’ marginal propensities to consume and their saving behavior. We use the model to predict the potential effect of an increase in inequality on economic output, assuming that monetary policy is at the zero lower bound for nominal interest rates, so that it is constrained not to respond to increases in inequality. We show that the key determinant of the effect of inequality on GDP is its effect on asset demand. This is the answer to the question: How much would aggregate wealth increase if we were to artificially hold all other macroeconomic factors such as interest rates and incomes constant? For illustration, we consider two scenarios: one in which inequality rises temporarily-as in the year-to-year fluctuations in the 1990s-and one in which it increases permanently. (See Figure 2.)

Figure 2

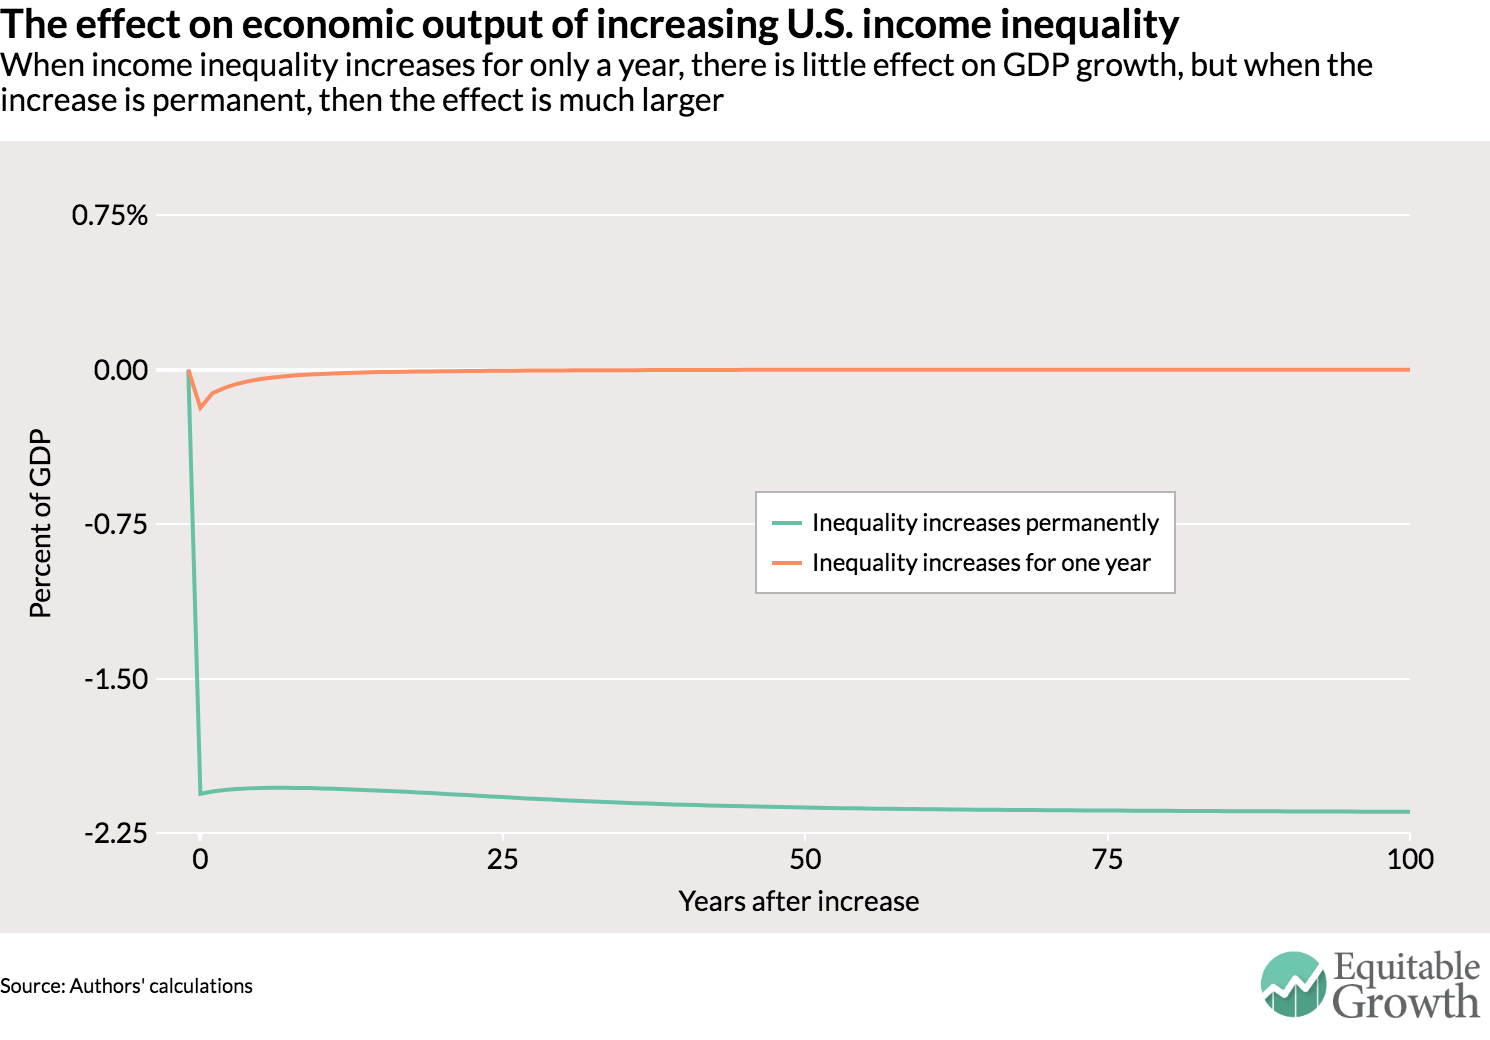
In each case, we assume an increase in inequality of four log standard deviation points (the extent to which the light green line in Figure 1 rose since the 2000s). The orange line in Figure 2 shows that if this increase lasts for only a year, then the effect on output is negative but small-less than two-tenths of a percentage point of GDP. The reason is that marginal propensities to consume are negatively correlated with individual incomes, but this correlation is small-a fact that holds not only in our model but also in datasets that have information about individuals’ incomes and marginal propensities to consume. Hence there is a small effect on asset demand, and a small effect on output.

Our more provocative result is the red line in Figure 2-the case of a permanent increase in inequality. There, our model predicts that the level of output could fall permanently by around 2 percentage points as a result. The reason is that inequality causes individuals’ asset demand to rise permanently by a large amount. In our model, this is because inequality leads individuals to face more risk and volatility in their incomes-and that of their offspring-going forward, leading them to increase savings for precautionary and income smoothing purposes.3 In general equilibrium, employment has to fall by a substantial amount to restore equality between the demand and the supply of assets.

Asset demand, asset supply, and equilibrium interest rates

While this is a stark outcome, our new paper suggests ways in which policy can mitigate the effect of income inequality on aggregate demand. The first is fiscal policy, including government spending and budget deficits. In our model, increases in budget deficits help mitigate the fall in economic output because more government debt increases asset supply.

Similarly, monetary policy can respond by lowering interest rates. In fact, the decline in U.S. interest rates that we have observed since the 1980s could have been a response, in part, to rising inequality. Our model predicts what might have been the effect of rising inequality (as in the light green line of Figure 1) on the “equilibrium” or natural interest rate-the interest rate that the Fed needs to set in order to maintain full employment without generating inflation. (See Figure 3.)

Figure 3

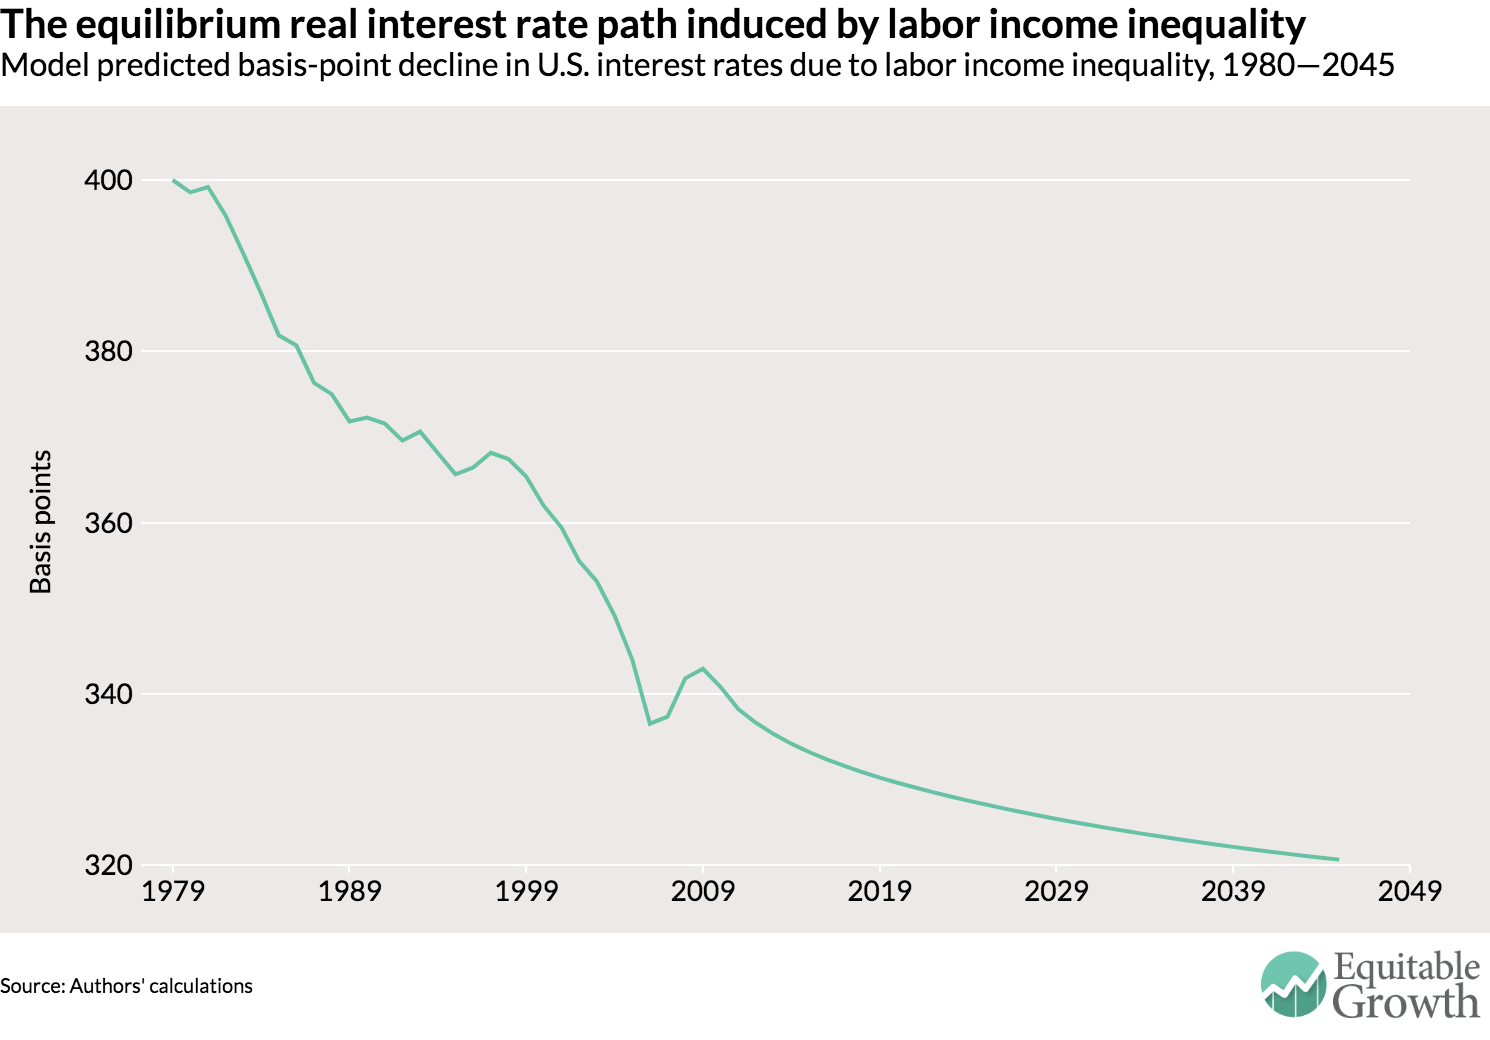
Our model suggests a decline of 80 basis points in that equilibrium rate due to rising income inequality, about one-fifth of the 4 percentage point decline documented by Federal Reserve economists Thomas Laubach and John C Williams between 1980 and 2013.4 One implication of our finding is that inequality might have been one of the factors bringing the Fed closer to the zero lower bound of interest rates in the aftermath of the financial crisis beginning in 2008.

Another implication of our demand-supply framework is that of the effect of a rising capital share on equilibrium interest rates and aggregate demand. The dashed red line in Figure 1 shows an increase in that share over the past 30 years. Economists Paul Krugman and Lawrence Summers have argued that this might have contributed to depressing the equilibrium interest rate-or that further increases in market concentration today would be detrimental to aggregate demand.5 In our model, these claims are incorrect. We find that an increase in the capital share always leads to an increase in asset supply because more profits get capitalized into assets that households can trade. This increase in the supply of tradable assets has the exact opposite effect from the increase in asset demand due to higher income inequality: It raises equilibrium interest rates and raises output in liquidity traps.

Policy implications

Our work has a number of important policy implications. First, it suggests that the Federal Reserve and other central banks should keep track of income inequality over time because it influences the decisions that central banks ought to take. Second, our work suggests that not all forms of income inequality have the same effect on equilibrium interest rates: Inequality that raises future risk depresses the natural rate of interest, but technological advances that raise the capital share raise can have the opposite effect. Our model also suggests a more benign view of fiscal deficits than is often assumed in policy discussions because of their beneficial effects on asset supply. A combination of detailed data work narrowing in on the causes of rising income inequality, combined with a model that teases out its aggregate implications, can help the Fed conduct better monetary policy.

Adrien Auclert is an assistant professor of economics at Stanford University and Matthew Rognlie is an assistant professor of economics at Northwestern University. Auclert is a Washington Center for Equitable growth 2015 grantee.

Care work as a team sport

Many workers in care industries, such as health, education, and social services, are motivated by a genuine concern for those they tend to, creating what social scientists refer to as large “social externalities, ” increasing the capabilities of the workers, citizens, and consumers they care for in ways that evade easy measurement. Team work is another important feature of the provision of care. Doctors, nurses, and other medical personnel collaborate with patients and their families to improve health in the same way that school administrators, teachers, and teachers’ aides work with students and their families to improve learning.


New Working Paper
The wages of care: Bargaining power, earnings and inequality


All these factors make it hard to identify the contribution that an individual care worker makes to total output, which limits these workers’ ability to bargain for a wage that accurately reflects their true value added to the broader economy. In most workplaces—as in most team sports—complex synergies such as team spirit come into play. But some jobs are like baseball, where individual performance and contribution to team wins can be measured fairly easily, while others are more like football, where it is especially difficult to estimate the contribution of those who play defense.

Workers in care occupations tend to earn less than similar workers elsewhere in the U.S. economy. This finding, reported in a paper I coauthored in 2002 entitled “The Wages of Virtue,” is confirmed in an updated version presented by sociologists Michelle Budig of the University of Massachusetts-Amherst, Melissa Hodges of Villanova University, and Paula England of New York University at the Work-Family Research Network Meetings last June in Washington, DC. The “care penalty” represents the inverse of a “pay premium” that has been observed among workers in the financial sector, who earn wages higher than would be predicted from their individual characteristics.

The interdependence that results from “teaminess” has particularly specific implications for the distribution of earnings in care industries, which employ about 25 percent of all workers in the United States. Because health and education are widely considered public goods, both government and non-profit organizations play a particularly important part in their provision. Unfortunately, most previous analyses of earnings inequality in the United States focus on dynamics in the private sector alone.

In our new working paper, University of New Hampshire sociologist Kristin Smith and I present data from the 2015 U.S. Current Population Survey showing that the distribution of earnings in care industries is more compressed than in other industries. The ratio of earnings at the top 90th percentile to the 50th percentile is lower, as is the ratio of the 50th to the 10th lower percentile. Although women are disproportionately represented in care industries, this pattern holds for men as well.

Our multivariate analysis—controlling for gender, type of employment (public, private non-profit, and private for-profit) and years of education—shows that managers and professionals pay a particularly significant penalty for working in either a care industry or a care occupation. The resulting reduction in earnings in the top half of the earnings distribution, where managers and professionals are disproportionately located, has an equalizing effect. Many factors could contribute to this outcome, including the particular distribution of skill requirements in health and education.

Yet the rarity of significant performance-based pay incentives in care industries suggests that teamwork also plays a role. It seems telling that both top and average salaries in 2014-15 were lower in the National Football League than in Major League Baseball, as were the ratios of top-to-minimum salaries. Keep in mind, however, that the average salary in the NFL in that year was $2 million, despite team revenue sharing rules and regulated bidding. Care workers are in a very different league when it comes to average pay.

—Nancy Folbre is economics professor emerita at the University of Massachusetts Amherst

U.S. homeownership tax policies are expensive and inequitable

The analysis “U.S. homeownership tax policies are expensive and inequitable,” contained errors that had been identified by Equitable Growth. Before the errors could be corrected, Congress enacted major tax legislation that substantially changed the policies discussed in the piece. As a result, Equitable Growth no longer plans to post a corrected version of the analysis and has removed the original.

Expand Social Security

AP Images

About the author: Jesse Rothstein is a professor of public policy and economics and Director of the Institute for Research on Labor and Employment at the University of California-Berkeley.

The economic security of the broad middle class in the United States has eroded in recent decades, with stagnating wages, vanishing job security, and necessities such as child care, higher education, and healthcare becoming less and less affordable. Restoring economic security should be the center of the next Administration’s domestic agenda.

One area that needs to be rethought is retirement. This was traditionally seen as a three-legged stool, with retirees relying in roughly equal parts on Social Security benefits, employer-provided pensions, and private savings. This was never the universal reality—even 30 years ago, barely half of workers nearing retirement participated in employer-based plans.6 But today, all three legs of the stool have been whittled away to almost nothing:

  • Defined-benefit pensions have largely disappeared. In 2010, only 22 percent of full-time, private-sector employees had a defined-benefit retirement plan,7 and public-sector pension funds (along with remaining private-sector funds) face serious financing shortfalls.
  • Less than 60 percent of near-retirement-age households have any retirement savings,8 and among those the median balance is only $91,000.9 This would purchase an annuity (at age 65) of only $5,000 per year.
  • Fewer and fewer Americans—about half in recent Gallup polling10—believe that Social Security will be there for them in retirement.

In this environment, only the wealthiest Americans can feel any sense of confidence about their retirement. Policy changes that strengthen the retirement system have tremendous promise to improve people’s feelings of security—not just retirees but also people in the prime of their lives.

Fortunately, the solution is simple. Our efforts should focus on strengthening and growing the part of the system that works well: Social Security. Fixing the financing shortfall and growing the system to provide real economic security in retirement, on its own, are affordable and feasible, and should be an important part of the middle class security agenda.

The problem:
Inadequate retirement security

Nearly every retiree receives Social Security benefits—about 40 million retired workers, plus millions more of their spouses, their other dependents, and survivors of those who die early.11 These benefits average under $1,350 per month,12 with 30 percent of retirees receiving less than $1,000 per month.13 This is not enough on its own to finance a decent standard of living.

Delivering equitable growth

Previous article: Early childhood development, Ariel Kalil
Next article: Unemployment insurance reform, Till von Wachter

Unfortunately, the other two legs of the three-legged stool, pensions and private savings, are no longer reliable. Half or less of workers nearing retirement age participate in employer-based retirement plans,14 and among full-time, private-sector workers with plans, most have only a defined-contribution plan, such as a 401(k); only about one-third have a defined-benefit plan (a traditional pension).15 As for private saving, less than 60 percent of near-retirement-age households have any savings in retirement accounts (including employer-based accounts).16 For those that do have savings, the median balance is only $91,000.17 If this were all converted to an annuity at age 65, it would provide less than $5,000 per year in retirement income. While a very small number of high-income retirees have substantial savings, this is very much not the norm.

Accordingly, Social Security makes up a very large share of most retirees’ incomes. For nearly half of married retirees and nearly three-quarters of unmarried retirees, Social Security benefits provide more than half of the household’s income.18 Over one-fifth of married retirees and nearly half of unmarried retirees rely on the program for fully 90 percent of their income.19 These benefits are not enough to support a comfortable retirement. Nine percent of seniors live in poverty.20 Using the U.S. Census Bureau’s new supplemental poverty measure that accounts for medical costs, geographic differences, and transfer payments, the proportion in poverty grows to 15.8 percent.21

No real prospect of restoring security
via pensions or private savings

Traditional, employer-provided pensions fit poorly with today’s labor market, where few workers can expect to remain at a single employer their whole careers. Moreover, in today’s financialized world employers find it too easy to renege on commitments to their past workers, leaving the government holding the bag and retirees without the pensions they were promised. Many private pension funds have gone broke; others have been closed to new enrollees. In the public sector, where it is harder for governments to slip out of past commitments, many public pension funds face serious gaps between promised benefits and funds with which to pay them, putting severe stress on state and local budgets.

Efforts to shore up the old pension system have had little success. Coverage rates, especially in the private sector, have plummeted. Recent efforts have focused on designing portable pensions that are not tied to specific employers. These efforts, while worthy, face fundamental challenges of financial viability, administrative complexity, and legal constraints. They are unlikely to reach many workers in the short run.

Efforts to promote retirement savings in defined-contribution plans, including IRAs and 401(k)s, have by and large been unsuccessful. Tax subsidies for retirement saving largely serve to induce households that would have saved anyway to shift from unsubsidized to subsidized accounts, with little impact on overall savings.22 While some “nudge” programs have been found to have larger effects,23 decades of policy and research work have failed to dent the problems of low participation rates and low balances among those who save.

For those who do manage to save, private accounts are a poor solution. Savers pay high fees on their investments, and often make bad investment decisions (in many cases under instruction from advisors facing serious conflicts of interest). Even wise investment plans expose savers to substantial market risk, as many Baby Boomers discovered in 2008.

Moreover, private savings plans have not solved the fundamental challenge of retirement savings—the need to insure the individual against uncertainty over the length of the retirement period and over investment returns. While retirees are often advised to buy annuities, these are very expensive and few retirees purchase them. Absent annuities, the only way individuals can be confident that they will not outlive their savings is to save much more than they will likely need, and to limit their drawdown, to preserve money that they will likely never spend. While some wealthy individuals may want to leave substantial bequests for their heirs, most would be better off under a retirement system that allowed them to spend down their savings during their lives, confident that they would be protected if they lived longer than expected.

The solution is simple:
Expand Social Security

Fortunately, it is possible to dramatically expand retirement security without fixing the problems with employer-provided pensions and private savings. Social Security has worked for decades and can easily be scaled up to fill in the holes in the retirement puzzle.

As a social insurance program, Social Security builds in protection against longevity and earnings risk, and shields retirees—most of whom have no interest in or capacity to participate in financial markets—from bad markets and unscrupulous or incompetent investment advisers. Its funding is not tied to the continued viability of any single employer, and while occasional adjustments are needed as demographic and economic realities diverge from earlier projections, these are small relative to the volatility faced by pension funds or private savings.

Policymakers should therefore pursue a major expansion of Social Security. There are a number of attractive ways to do this. I articulate three principles that should guide such an expansion, then describe three options that would satisfy the following principles:

  • Social Security benefits should be enough for retirees to live on, on their own
  • The features that have made the program such a success to date, including its universality and its dedicated, untouchable financing stream, should be preserved
  • The existing program’s long-term financing shortfall should be closed via new revenues rather than benefit cuts, with the pain of this offset by real, visible benefits in the form of higher payments to retirees

The following three policy options are consistent with these principles

Three policy changes
to expand Social Security

Expand the program via proportionate increases to tax rates and to all recipients’ benefits

A modest increase in the payroll tax rate of less than one percentage point—from 6.2 percent to 7.2 percent, respecting the current taxable earnings cap—on both workers and employers would finance a 15 percent benefit increase for all current and future retirees as well as survivors and disabled workers. This could (and should) be scaled to provide larger increases—for example, a 2 percentage point increase in the tax rate would finance a 30 percent increase. If disabled workers’ benefits were excluded from the expansion, the benefit increase would be larger, 18 percent per percentage point on the tax rate.

Eliminate the current taxable earnings cap, and split the revenues among increasing benefits for those who pay higher taxes, closing the financing gap, and increasing benefits for the lowest earners

Earnings above $118,500 per year are exempt from Social Security taxes, specifically the Federal Insurance Contributions Act, or FICA, taxes. Only 6 percent of workers earn more than this amount, but the share of wages above the threshold has grown as these income earners have pulled away from the rest of the workforce.24 Eliminating the cap, without increasing benefits, would yield more than enough revenues to close the 75-year projected finance shortfall for Social Security and Social Security Disability Insurance.25

More consistent with the principles above would be to use some of the revenues to increase benefits for high earners in order to preserve the program’s universality while imposing a reasonable cap on the size of the individual benefit. Another portion should go toward increasing benefits for lower-earning recipients. This would help promote retirement security and would create a constituency to support the cap elimination. The remainder could still make a substantial down-payment toward eliminating the financing gap.

If earnings were subject to taxes without a cap but non-wage income remained exempt, many high earners might reclassify their earnings as capital gains or business income. To prevent evasion while being consistent with the overall structure of the program, the FICA tax might be applied to all personal income above the taxable earnings cap, regardless of whether that income comes as earnings or in another form. This would raise dramatically more money, more than enough to close the entire financing gap and support larger benefit increases for low-income retirees. While a few very high-income individuals would face sharply increased tax bills under this proposal, dedicating the revenues to the Social Security trust fund, just as FICA taxes are today, would promote the tax increase’s political viability and protect it from attack.

Create an optional extra tier of Social Security, into which workers could contribute in order to purchase extra benefits when they retire

Some higher-income workers may want more retirement consumption than even an expanded Social Security benefit can support. As discussed above, pervasive market failures make private retirement saving very inefficient. The government can solve this problem by allowing savers to use the existing Social Security infrastructure, with its built-in mechanisms, to pool and share risks at much lower “load” than any private savings vehicle.

Pricing of optional add-on benefits would need to account for a modest degree of adverse selection, as those with longer life expectancies would be somewhat more likely to participate. It would also be more expensive to administer than the current system, though likely much less so than existing private annuity products given the existing infrastructure to track contributions and benefit eligibility. But even with pricing that accounts for these extra costs—set to ensure that the new tier of optional add-on benefits is entirely self-financing—this would be a very attractive option relative to the private annuity market. Participants would contribute throughout their careers, with no need to make investment decisions, pay fees, or face market risk. In return, they or their survivors would receive higher benefits when they retired, became disabled, or died.

Other proposed changes that are similarly consistent with the principles enumerated above are also worthy of consideration. It is noteworthy, however, that recent discussions have moved away from the ideas of pre-funding Social Security benefits and investing trust funds in equities. These do nothing to address the above principles, and only expose the program (and the retirees it supports) to political and market risk.

Countering the objections
to expanding Social Security

There are three primary objections to the above proposals. None are compelling.

The first is that Social Security would be too expensive. It is undeniable that larger Social Security benefits would require correspondingly more revenue. But there is no way to support higher consumption for retirees—no way to address the retirement security problem—without in some way directing additional resources to these retirees. Any alternative would impose equal or higher costs, if not as higher payroll taxes than as higher diversion of before- or after-tax income into private savings or pension funds. It is much more efficient to route the needed resources through Social Security. Moreover, taxpayers see Social Security taxes as worth paying, tied as they are to eventual benefits.

The second objection is that higher tax rates would reduce the incentive to work. Again, Social Security expansions would not dramatically change the effective “wedge” between earnings and consumption—the money that would be collected through higher payroll taxes either represents new additions to the taxpayer’s consumption possibilities in retirement or merely displaces private savings with, if anything, a positive impact on retirement consumption. Thus any labor supply impacts would be very small.

The above proposals to uncap income subject to FICA taxes, while capping benefits, would expand the wedge for the highest-income workers. There is little evidence that these workers’ labor supply is very responsive to taxes, and the scope for evasion (which is more responsive) could be minimized by assuming that tax increases apply to a broad income base. In any case, this objection applies equally to any proposal to increase top income tax rates, a move that is likely inevitable as the share of national income accruing to the top 1 percent continues to grow.

The third objection is that expanding Social Security would crowd out private saving and reduce national savings. This is a prediction of standard economic models. But these models do not reflect reality. In fact, most workers have very little savings to be crowded out, and those who do save are not primarily saving for retirement (though they may store their savings in retirement accounts in order to obtain tax benefits).

Regardless, the national savings rate is simply not a first-order policy concern today. Finance is increasingly global, and profitable U.S. investments can be financed by savers elsewhere. Moreover, concerns about promoting saving are yesterday’s problem. Today, the evidence indicates that the nation and the world face a serious savings glut, not a shortfall. In today’s world, there is little if any reason to prefer prepaid to pay-as-you-go retirement systems.

Is Tax Increment Financing the pathway to rebuilding blighted U.S. infrastructure?

Urban blight in Baltimore, Maryland.

It’s no secret that the infrastructure in the United States is underfunded, under-maintained, and, consequently, crumbling in many communities across the country, as it has been over the course of the past five decades. In fact, our infrastructure, which includes everything from transit and roads to energy and drinking water, has deteriorated so much that the American Society of Civil Engineering recently awarded a D+ rating to describe its overall health.

The good news is that we already know that investments in infrastructure can go a long way toward not only improving the condition of infrastructure across the country but also bolstering the broader economy. In the near term, infrastructure projects can spur local economic activity, and increase employment. And in the long run, according to Josh Bivens of the Economic Policy Institute, different levels of investment—be it stopping scheduled funding cuts, focusing on green strategies, or closing the “infrastructure deficit”—will provide better paying jobs for those will less education and help improve overall U.S. economic growth and productivity.

Yet how exactly do policymakers jumpstart these efforts? Over the years, as federal funds and grants have decreased, most of the responsibilities for urban renewal and infrastructure development now fall upon local governments. Municipalities or local development authorities are then left to figure out how to raise the money to make it happen. Although there are many innovative methods of financing local development, more often than not municipalities today rely on a tool called Tax Increment Financing, or TIF—a highly efficient closed-loop funding mechanism that functions a bit like a credit card, enabling local governments to borrow from future tax revenue to pay for improvements now.

To best explain how it works, let’s say there are a several dilapidated buildings and roads across a few blocks within a city. In its current state, developers are apprehensive about investing in real estate there. So, the property is stuck in limbo, with great potential but still blighted. In this case, a municipality or its local development authority may propose making it a TIF district in order to finance its renewal and attract development.

Once an ordinance is passed, the TIF authority will draw a boundary around the site and declare it a TIF district for a certain time period, say 10 years. At the start of this designation, the TIF authority will calculate the site’s initial assessed value—essentially the estimate of a property’s dollar worth, from which property taxes can be calculated. They will hold this “base value” constant throughout the lifetime of the TIF. Then, in order to start treating or improving the structures and streets, the TIF authority will sell bonds secured against the TIF district or reach some other agreement with the vendor or developer handling the clean-up efforts.

As the site’s quality improves, the assessed value of the district increases over the 10-year span.

The TIF mechanism allows the TIF authority to earmark the project’s new property tax revenue (minus the property revenue they calculated earlier based on the initial assessed value) to finance the development, such as paying off the bonds. Basically, all of the newly generated property tax revenue during the lifespan of the TIF district goes back to the TIF authority while only the base-value revenues are distributed among the usual taxing bodies within the TIF district.

In other words, over 10 years, if a TIF district has other overlapping jurisdictions, such as counties, school districts, or park districts, these entities will only receive the property tax revenues based on the initial assessed value. At the end of the 10 years, the site is officially improved, and the TIF district is closed. At this point, all of the property tax revenues, expected to be much higher than before since the assessed value of the area has increased, are funneled to the original taxing bodies.

Tax Increment Financing is not necessarily a new tool. The idea for it began percolating in the 1950s, when California used it to secure matching funds from the federal government for redevelopment projects. But widespread uptake of this financing tool did not begin until the 1970s, when federal funding for urban renewal shrank, compelling cities to take matters into their own hands. Since then, 49 states and the District of Columbia have adopted appropriations for TIF districts, with the only holdout being Arizona. Chicago, for example, is famous for their use of Tax Increment Financing: The city opened its first TIF district in 1984, and they now have more than 160 TIF districts covering 30 percent of the city’s land area. Today, it is probably the most widely used development method in the urban planning toolbox.

On paper, Tax Increment Financing sounds like the miraculous (and popular) pathway to improving infrastructure, especially considering that it doesn’t add new taxes or alter existing tax rates. Basically, it’s self-sustaining. But in practice, it has some serious implications, one of which is gentrification. In recent years, urban planners have increasingly misused Tax Increment Financing for economic development instead of urban renewal. If city policymakers want to incentivize retail businesses to set up shop in a new area, for example, they can establish a TIF district to help assist developers and private businesses with development. While publicly subsidized private development may increase tax revenues and even boost downtown economic growth, these practices can hasten the process of gentrification and the consequent displacement of vulnerable groups.

A report by the Front Range Economic Strategy Center finds that in Denver’s downtown, areas that historically are home to low-income, minority residents, TIF districts are associated with rising property values, shrinking affordable housing stock, and an increasing share of white residents. To make matters worse, TIF investments often already occur in rapidly-gentrifying places, as seen in Chicago, because they offer the greatest yield of property tax revenues. But this means that places that can benefit from urban renewal don’t necessarily receive the equitable attention or TIF money they deserve.

All this is not to say that Tax Increment Financing cannot be a viable way for local policymakers to improve infrastructure and neighborhoods while simultaneously increasing local economic growth. Whether this means using alternate tax revenue other than property taxes to pay back bonds or mandating more affordable housing units in a TIF district, policymakers need to pay attention to the equitable deployment of Tax Increment Financing.

Must-Read: Jan Mohlmann and Wim Suyker: Blanchard and Leigh’s Fiscal Multipliers Revisited

Must-Read: Naughty, naughty!

Jan Mohlmann and Wim Suyker: Blanchard and Leigh’s Fiscal Multipliers Revisited: “[We] do not find convincing evidence for stronger-than-expected fiscal multipliers for EU countries…

…during the sovereign debt crisis (2012-2013) or during the tepid recovery thereafter…. As Blanchard and Leigh did, we find a negative and statistically significant coefficient for 2009-2010 and 2010-2011 but not for 2011-2012…. For 2012-2013 we find a larger estimate than Blanchard and Leigh, but due to the higher standard error the estimated coefficient is no longer significant at the 5% level…. In the two periods we added, our estimated coefficients are close to zero…. As Blanchard and Leigh did, we find a statistically significant negative coefficient in the panel forecast for 2009-2013. This result holds for the prolonged period 2009-2015. However, we do not find a statistically significant coefficient when we perform the panel analysis for the period 2011-2015.

Nowhere in their piece do Mohlmann and Suyker report their estimated coefficient and its standard error for the entire period 2009-2015.

Repeat: nowhere in their piece do they report estimates for their entire sample.

Trying to back out estimates from the information they do give, if they had reported it they would have reported a number like -0.60 with a standard error near 0.23. Compare that to the Blanchard-Leigh estimates for 2009-2013 of a number of -0.67 with a standard error of 0.16.

See that a good and true lead is not “[There is no] convincing evidence for stronger-than-expected fiscal multipliers… during… 2012-13 or thereafter…”

See that a good and true lead would be: “There is no statistical power at all over 2012-13, 2013-14, and 2014-15 to test whether excess fiscal multipliers in those years are different than the strong excess fiscal multipliers found by Blanchard and Leigh…”

Seizing the high ground of the null hypothesis for one’s favored position, and then running tests with no power, is undignified…

Blanchard leigh Google Search

Must-Read: Simon Wren-Lewis: Politically Impossible

Must-Read: The writer, BTW, is Chris Giles. In light of this, does the almost-always excellent Financial Times have a significant quality-control problem here?

Simon Wren-Lewis: Politically Impossible: “An article in the Financial Times recently said of me…

…‘He has opposed deficit reduction when the economy was weak and when it was strong.’ Ah yes, this would be the same economist who has suggested the left aims to reduce the current deficit (all current spending less revenue) to zero, that pre-crisis fiscal policy in the Euro periphery should have been much more contractionary, and has championed fiscal councils as a way of eliminating deficit bias.

Should I have demanded a retraction? I didn’t: life is short, maybe it was a kind of joke, or even a misprint, and if not perhaps it said more about the writer than it did about me…. Equally it makes no sense obsessing about the need to reduce deficits in a recession and then turning a blind eye when surpluses are spent in a boom. Unfortunately just that kind of inconsistent thinking became hard-wired in the form of the Stability and Growth Pact (SGP), with its focus on a limit of 3% for deficits. Those who say that all that was wrong with the SGP is that it was not enforced have learnt nothing. This is why we need to move influence away from the Commission and towards independent national fiscal councils.