Overview
Economic analysis that does not account for political power—who has it and how it is wielded—will inevitably fail to fully capture what keeps the United States from achieving equitable economic growth. Those who enjoy market power are, not coincidentally, often the same citizens who enjoy outsized political influence, creating a feedback loop that perpetuates economic inequality, instability, and slow growth. Stated simply, a healthy economy requires a healthy democracy.
In both economic and political spheres, flowery rhetoric around equality and individual agency is belied by systemic obstructions—the result of biased and crumbling institutions that have failed to set and enforce adequate rules of the road. For our economy, this has meant an overreliance on the market to solve public problems, an underinvestment in public goods that would empower and protect working families, and an underprosecution of economic crimes such as anti-competitive behavior by corporations and tax dodging by wealthy individuals.
Download FileThe consequences of political inequality and voter suppression for U.S. economic inequality and growth
For the republican form of government in the United States, the result today is sustained underinvestment in election administration, a “pay to play” campaign finance system, a difficult-to-navigate patchwork of voting rules across the states, and, most concerning, a resurgence of Jim Crow-era voter suppression tactics. One result of these electoral trends is a huge divide in voter registration and turnout rates between high- and low-income Americans, as well as serious access disparities between races. These baleful outcomes call into question the U.S. electorate’s representation in, and thus undermine the legitimacy of, the nation’s federal system of government.
What’s worse, there is growing evidence that economic inequality is itself depressing democratic participation, underscoring the urgency for countering the dual concentration of political and economic power.
The battle over voting rights intensified in the 2020 election cycle. In many states, there was unprecedented confusion over voting deadlines and procedures as court orders, the coronavirus pandemic, and new legislation collided. Ballot counting was similarly contested, with partisans quarreling over when ballots could be counted and what constituted a valid ballot. Election administration should not be the primary topic of news in the week leading up to an election. Election administrators caught in the crossfire struggled to keep up. The confusion of the 2020 election cycle underscores the necessity of revisiting our electoral system to protect the voting rights of Americans.
This report examines cutting-edge research on how economic and racial inequality interact around the country among those Americans who vote, those who try to vote but face obstacles in doing so, and those who do not vote altogether. Political and economic disparities exist along other channels as well, such as gender identity, disability, and sexual orientation, but this report focuses on income and race.
Indeed, the evidence-based research we explore pinpoints the myriad ways that economic and racial inequality together subvert our democracy by aiding and abetting political inequality and voter suppression, creating a dangerous feedback loop for the perpetuation of economic policymaking that does not fully represent U.S. communities. While there are, of course, other ways that inequality is manifested in our politics—for example, the outsized influence of monied interests in the legislative and regulatory processes and the aforementioned broken campaign finance system—this report will focus exclusively on voting.
The first section of the report describes the divide in electoral participation between lower- and higher-income Americans and identifies the key factors driving this result. The second section describes voting gaps between racial and ethnic groups, linking modern-day voter suppression tactics with race-based differences in registration and voting rates. The third section explores the link between electoral participation and economic policymaking, demonstrating that voter suppression and resulting differences in voting rates have real-world consequences for how our country combats economic inequality and other pressing economic problems—and is likely partially fueling some of the country’s Black-White economic disparities. This section also explores the potential link between economic inequality itself and voting behavior.
Recommendations in the fourth and final section of the report examine how policymakers can begin to correct for the self-perpetuating problem of grossly unequal political power between economic haves and have-nots, and between White Americans and Black Americans, Latinx Americans, Indigenous Americans, and other Americans of color. These policy proposals could serve as a first step to addressing the electoral inequalities that underpin and perpetuate economic inequality and are inimical to economic growth that is more broadly shared and sustainable.
Income-based voting divides and barriers

Higher-income citizens of the United States are more likely to vote than their lower-income counterparts. Between 1978 and 2008, wealthier Americans were 65 percent more likely to vote than those with low incomes.1 In 2016, a presidential election year, eligible voters with annual incomes of less than $50,000 voted at a rate of 55 percent, while 80 percent of those with incomes of more than $150,000 voted that year.2 Households earning less than $15,000 made up 13 percent of all households in 2009 but comprised just 6 percent of the electorate in the 2008 election.3
A 2020 survey found that 44 percent of chronic nonvoters earned less than $50,000 in annual, pretax household income, compared to 26 percent for active voters.4 Just 13 percent of nonvoters earn more than $100,000, whereas 29 percent of active voters do.5 See Figure 1 for a snapshot of voter turnout by income between 2012 and 2018 (these figures, collected in the voter supplement survey to the Current Population Survey, are released in the spring and are not yet available for 2020).
Figure 1
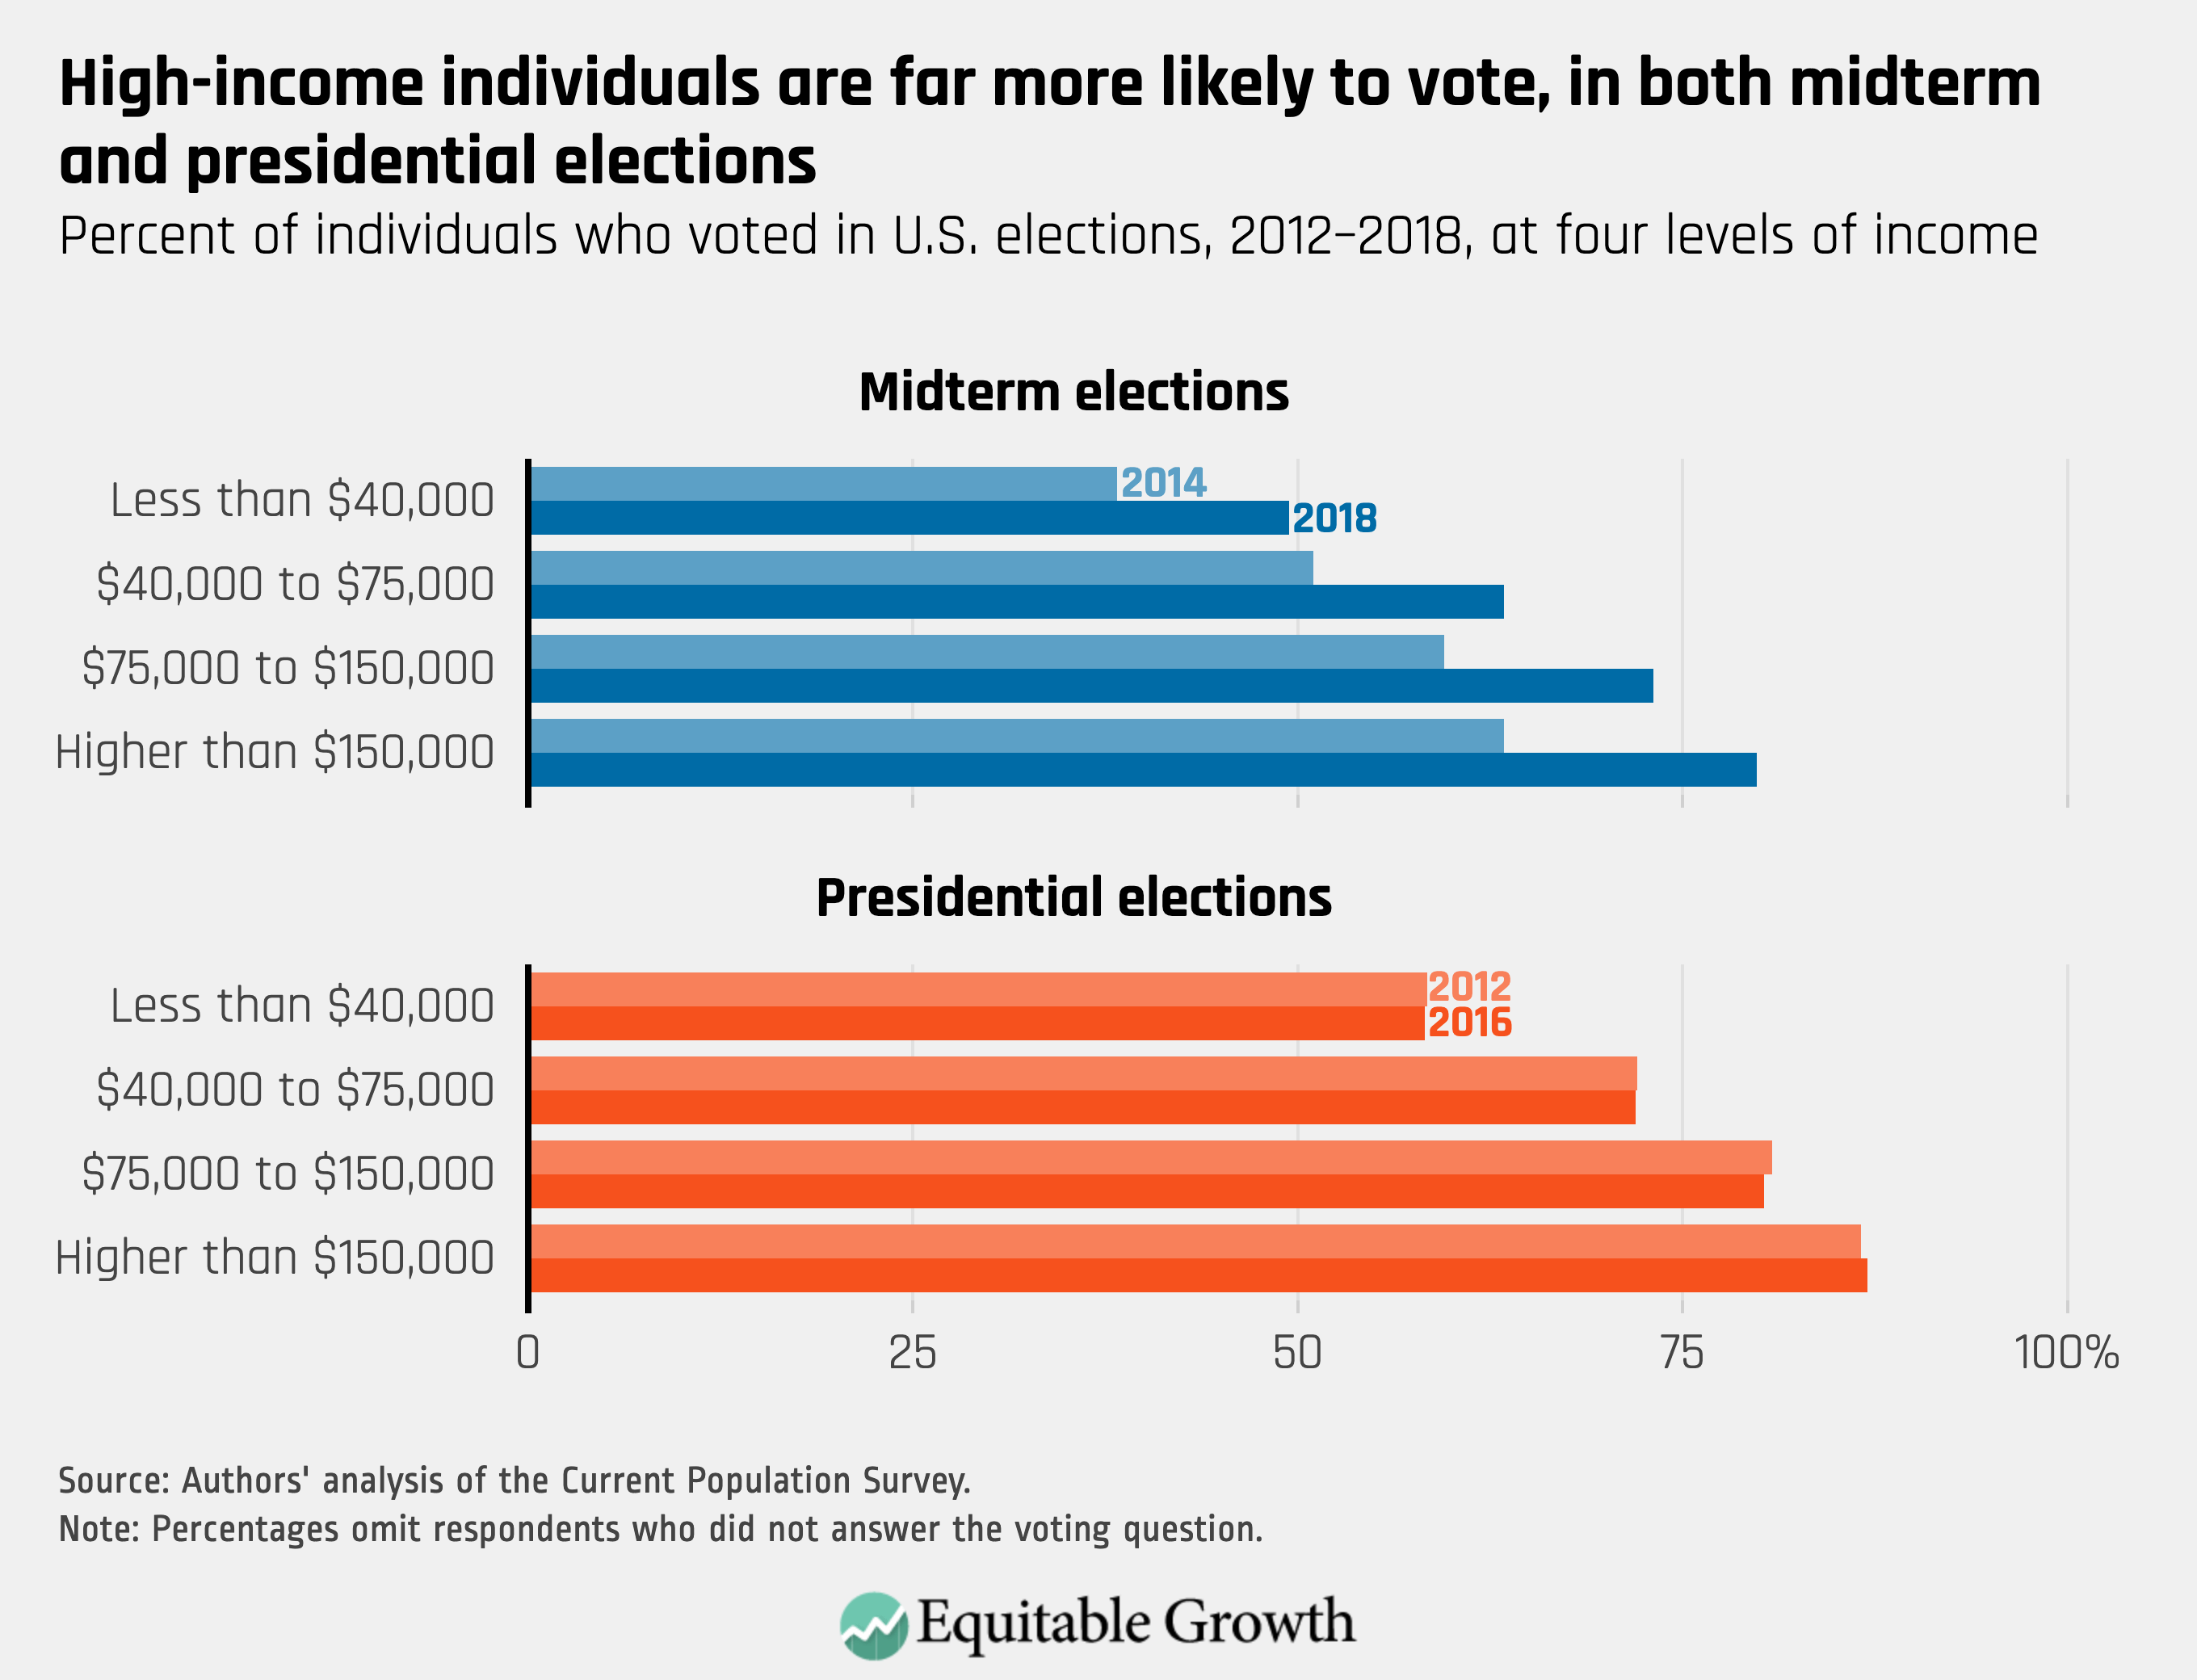
Voting rates are lower across the board during U.S. midterm elections, but the income divide doesn’t close among those who vote. In the 2018 midterms, for example, eligible voters earning $50,000 or less voted at a rate of 46 percent while those with incomes higher than $150,000 voted at a rate of 72 percent.
There are many potential reasons why the rich vote at higher rates than their lower-income counterparts. One major driver is structural racism—the rules, practices, and customs that, either by design or effect, discriminate against Black Americans, Latinx Americans, Indigenous Americans, and other Americans of color, many of whom are overrepresented among the country’s low-income families. Given the importance of this dynamic in the U.S. electoral system, the report’s next section focuses exclusively on race.
Low income in and of itself does not seem to directly cause disenfranchisement.6 One quasi-experiment conducted by economist (and Equitable Growth grantee) Randall Akee at the University of California, Los Angeles and his co-authors testing the effect of cash windfalls on voting finds that more income does not immediately result in higher voting rates, even among low-income Americans (though children of low-income families who received the payments did vote at a higher rate once they reached 18 years of age).7 Specifically, the researchers find that improved education and social ties in childhood result in higher voting propensity in adulthood. That said, a separate study suggests that permanent income increases via minimum wage boosts may more durably increase voter turnout.8
Even if income itself is not determinative, low-income families tend to face challenges that can indirectly depress voter turnout. Those challenges include lack of paid time off from work,9 higher rates of moving residences,10 higher rates of incarceration,11 unreliable transportation,12 and unstable child care arrangements.13 These factors run up against the many barriers to voting that have been erected in the United States—barriers that we discuss in more detail in the section below.
Income-based voting barriers
Voter registration
The first hurdle facing potential voters is registration. Although U.S. citizens take registering to vote as a fact of life, registration is not strictly necessary, and our two-step process for voting, though not unique, is far from the global standard. In Canada, for example, a national register of voters is kept, and voters can be automatically added after interacting with virtually any government service (some U.S. states already pursue a comparable policy). Many northern European countries have similar systems. In some cases, citizens are added to a national register at birth and no further action is ever required. Even here in the United States, one state recognizes that registration is not absolutely necessary: North Dakota has no voter registration at all. If residents have voted before, they are already on the voter roll. If they have not, they only need to furnish proof of citizenship and residency at the polling location.
Research shows low- and moderate-income Americans are less likely to register to vote. Among registered voters, turnout rates average in the high 80 percent range.14 But nearly 20 percent of all eligible voters are unregistered.15 (See Figure 2.)
Figure 2
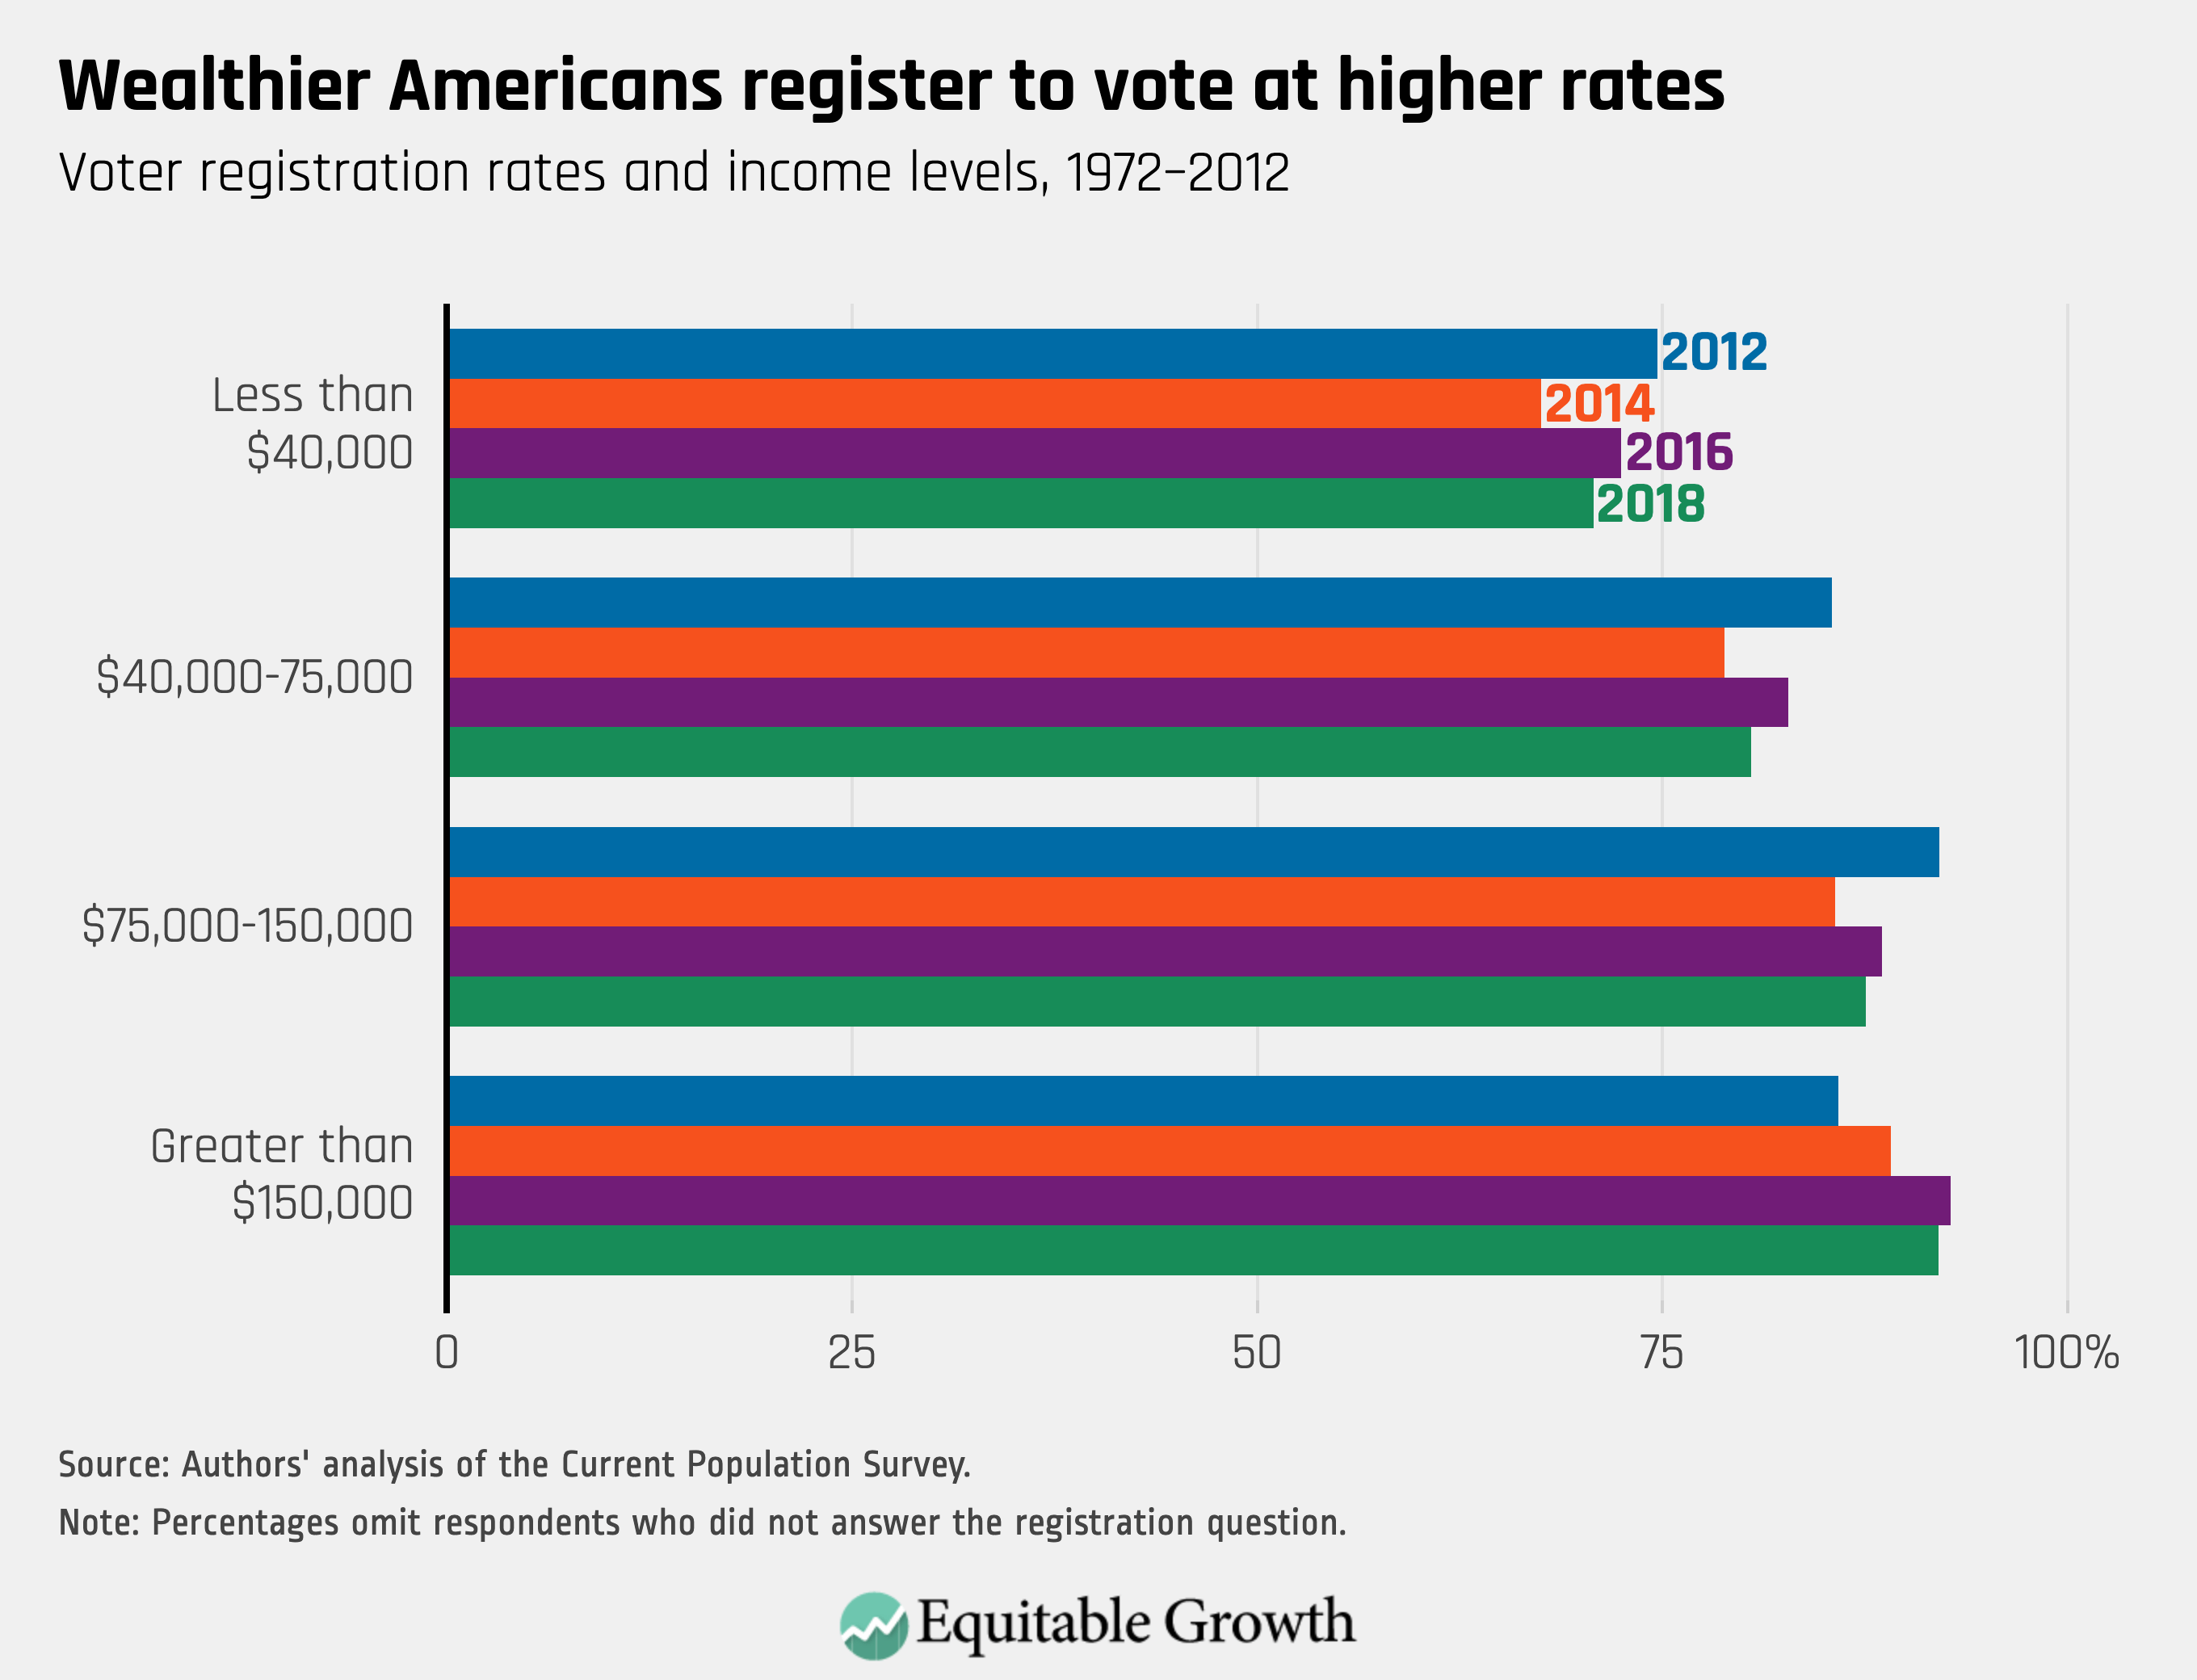
U.S. citizens who move frequently face the further complication of needing to re-register in new jurisdictions, which can be a formidable bureaucratic process. Americans who move across state lines may need to obtain new state identification, and this process can take weeks. Research shows that frequent movers are less likely to vote and that low-income Americans move more than twice as often as others.16
Getting to the polls
Those who do get registered still face obstacles to voting. There is anecdotal evidence that eligible voters with young children may forgo voting because of difficulty finding child care.17 Women as a group vote at a higher rate than men,18 but it is likely that unstable child care arrangements disproportionately affects would-be female voters, who are eight times more likely than fathers to be the primary caretakers of their children and are also more likely to head single-parent households.19 In the 2000 election, for example, parents were less likely to vote than those without children, when keeping marital status constant.20
What’s more, according to an analysis of all U.S. elections between 1992 and 2018, women with an infant were 3.5 percentage points less likely to vote than women without children, while men with an infant were 2.3 percentage points less likely vote vote than their childless counterparts.21 More academic research is needed to determine the precise effect of income-based challenges inherent to raising a family in the United States—a function, in part, of a broken child care system—on voting.22
In many states, hourly workers have no guarantee of time off from work to vote.23 This means, even if they are able to take leave for the time necessary to vote, they may have to take the time unpaid, a trade-off that some workers can ill-afford. And for contract employees, including the many gig workers earning money off of smartphone apps, time spent voting is time when no money can be earned.
Low- and moderate-income workers may find it more difficult to find time in the day to vote, especially in states that do not offer extended voting hours on Election Day. In public opinion polls, more than 10 percent of registered nonvoters consistently say that the reason they did not vote is because they did not have time or because their work or school schedule conflicted with voting.24 One study finds that in states with longer voting days, mandatory time off for voting, and where election information is mailed to voters, people who did not complete high school voted at a rate 11 percentage points higher than states without these features.25
Finally, low-income voters are far more likely to say that the main reason they did not vote is because they did not have adequate transportation. About 5 percent of voters with incomes lower than $30,000 in 2016 said transportation problems were the main reason they did not vote. For those with higher incomes, just half of 1 percent cited transportation.26
The decline of unions
The dramatic decline in union membership since the 1960s, itself a politically motivated policy choice, likewise depresses turnout among middle- and low-income voters.27 Union-led voter mobilization campaigns were once responsible for increasing turnout among both union members and nonunion members. Unions often provided potential voters with information about the election, which is linked to higher turnout. According to one estimate, turnout in 2000 might have been 10 percent higher if union concentration remained at its 1964 levels, and this effect would have been concentrated in the bottom two-thirds of the income distribution, thus pushing more low- and middle-income citizens to vote.28
Race-based voting divides and barriers

Many Black Americans, Latinx Americans, Asian Americans, and Indigenous Americans also face serious barriers to voting. For one thing, almost all of the income-based barriers to voting listed above especially disenfranchise communities of color, often by design. This is due to the ingrained structural racism in all U.S. laws, policies, and institutions, not just those related to voting, including racial oppression in the criminal justice system and discrimination and stratification in the labor market.
Take, for example, the discussion presented in the prior section of this report of declining union membership. Research suggests that the impact of falling union membership on voting is more pronounced in communities of color.29
Other barriers abound and often lie at the intersection of low income and structural racism. Unregistered Black Americans are more likely than White Americans to cite a permanent illness or disability for not registering, while Asian Americans are much more likely than White Americans to cite difficulty with English when explaining why they are not registered to vote.30 Black and Hispanic Americans are overrepresented among lower-income communities, accounting for 24 percent and 28 percent of people living below the poverty line, respectively, in 2019.31 All of the factors that depress turnout for low-income people will likely also depress turnout for American communities of color.
Voter suppression
These interactions between income, race, and barriers to voting are far from incidental. The United States has a long history of blocking people of color from the ballot booth. While de jure racial discrimination at the polls is no longer tolerated, thanks in part to the 1965 Voting Rights Act, de facto discrimination, including facially neutral policies with disparate racial impacts, remain rampant.32
Felon disenfranchisement
Take, for example, the widespread practice of states disenfranchising convicted felons. Only two states—Vermont and Maine, both with largely White populations33—never take away felons’ right to vote, even while they are incarcerated.34 In the other 48 states, felons are subject to at least some voting restrictions, which has a profoundly disproportionate impact on Black Americans and Latinx Americans, who are targeted by the biased enforcement of drug laws and the country’s racist criminal justice system.35 Ineligibility to vote was the third most-cited reason Black Americans gave for not registering to vote in the 2016 election, with 11.2 percent of Black survey respondents answering as such—more than twice the rate that White Americans give this reason.36
Until 2018, one of the more restrictive states was Florida, which permanently disenfranchised millions of citizens with criminal convictions. In 2018, however, Florida voters passed a statewide constitutional amendment restoring voting rights to 1.4 million individuals with prior felony convictions. What happened next is sadly representative of the “two steps forward, one step back” nature of the fight for expanded voting rights, especially for Black Americans: In response to the state constitutional amendment, the majority-White Florida legislature passed a law, signed by the White governor, that conditioned felons’ voting eligibility on their payment of outstanding court fees and costs.37
Given how many formerly incarcerated Floridians are financially insecure, finding the funds to pay the exorbitant fines and fees that they may have accumulated is a significant barrier to voting. Political scientist Daniel A. Smith from the University of Florida, an expert witness in one of the lawsuits challenging the new law, estimated that the law will block access to voting for 770,000 Floridians, 43 percent of whom are Black Americans.38 For context, just 16 percent of the state’s overall population is Black.39 The new law, having withstood multiple legal challenges in a court system that, due to structural racism, is predisposed to not rule in favor of Black plaintiffs, was in effect for the 2020 election.40
Voter purges
Other states have used overzealous and partisan purges of voter rolls to disenfranchise Black Americans and Latinx Americans.41 In Georgia, for example, a conservative estimate finds 198,351 voters were wrongfully deleted from the state’s voter rolls in a series of purges leading up to the 2018 elections, disproportionately disenfranchising young voters and voters of color on the erroneous grounds that they had moved residences.42 A similar effort was undertaken in Wisconsin in 2019, where a conservative advocacy group brought a lawsuit asking for 130,000 registrants to be purged. Though the effort was blocked until after the 2020 election,43 the purge was targeting counties where three-quarters of Wisconsin’s Black residents live.44
Polling place resources and locations
How polling places are resourced and where they are located also have clear racial ramifications. According to an analysis by The Guardian, a new policy in Texas that allowed for widespread closure of polling locations disproportionately reduced access for Black and Latinx communities.45 Investigative journalists discovered a similar phenomenon in Georgia, where polling places were cut by almost 10 percent over the past 7 years, despite voter rolls growing by almost 2 million people.46 The result, during the June 2020 primary, was much longer waits in non-White areas of the state, where the number of voters per polling place has skyrocketed in recent years.47 Last month, a federal judge dismissed a lawsuit that argued the lack of additional voting locations in Texas, among other state policies, would disenfranchise Black and Latinx voters.48
Texas also reduced the number of authorized ballot drop boxes to one per county in the lead-up to 2020 election, triggering outcries and lawsuits from voting rights advocates. Ballot drop boxes are an innovation to handle the surge in voting by mail as a result of the coronavirus pandemic and COVID-19, the disease caused by the virus that is disproportionally ravaging communities of color.49 And, once again, the courts sided with the state, despite evidence that the changes disproportionately hurt Black and low-income voters.50
These race-based voter suppression maneuvers matter. A 2020 paper finds that a 0.25-mile increase in distance to a polling place reduces ballots cast by 2 percent to 5 percent. This effect is especially pronounced in neighborhoods of color during nonpresidential elections.51
In addition to long commute times to the polls, communities of color also often face long lines once they get there. A 2019 paper by M. Keith Chen at the University of California, Los Angeles and his co-authors finds that residents of Black neighborhoods waited in line at the polls 29 percent longer than those residing in White neighborhoods, and Black Americans were 74 percent more likely to spend more than 30 minutes at their polling place.52 Survey data document that Black Americans and other Americans of color tend to wait longer, but the research approach taken by Chen and his colleagues, using cell phone data to trace individuals’ locations on Election Day, definitively corroborates the finding.
Though these researchers couldn’t pinpoint a single dominant cause for this divide in waiting times at the polls, some evidence suggests that polling places in jurisdictions with high Black American populations are systematically underresourced—budgeted less money, assigned fewer poll workers, and provided with fewer election machines—leading to wait time differences, especially in high-volume polling places.53
Of course, long commutes and long lines are more than just serious inconveniences. They also serve as a deterrent and thus depress turnout. When asked why they did not vote, nonvoting Black Americans disproportionately cite transportation problems or inconvenient polling places.54
Early voting
As more and more jurisdictions made early voting available amid the coronavirus pandemic, wait times on Election Day may have diminished. But early reports indicate that early voting did not eliminate the problem. Many states experienced long lines at early voting sites during the 2020 presidential election, including, for example, high-volume sites that cater to large Black and Latinx voter populations in cities across Texas.55
Indeed, how early voting is organized in a particular jurisdiction can make a big difference. One paper looking at early voting in Florida in the 2008 and 2012 elections finds that reducing the early voting period from 14 days to 8 days and eliminating the early voting option on the final Sunday before Election Day depressed turnout among racial and ethnic minorities, registered Democrats, and those without party affiliation.56
Vote by mail
Voting by mail also increased as a result of the coronavirus pandemic. In 2016, the most recent year for which complete data are available, more than 40 percent of all votes nationwide were cast by mail or in-person before Election Day.57 Preliminary reports from the 2020 election indicate much higher early voting and voting by mail percentages, largely attributed to the pandemic, though it remains to be seen how this spike might have affected race-based voting disparities and if the trend will continue after the coronavirus pandemic passes.58
Historically, Black, Latinx, and White Americans have used absentee or vote-by-mail ballots at roughly an equal clip, with White Americans slightly more likely to avail themselves of the option in certain states with certain vote-by-mail rules.59 In 2016, for example, 30 percent of White voters in Florida voted absentee, compared with 20 percent of Black voters and 27 percent of Latinx voters.60 But in Wisconsin, 29 percent of Black voters voted by mail, compared with 28 percent of White voters and 24 percent of Latinx voters.61
Yet mail-in ballots from historically disadvantaged communities are rejected at higher rates and are more likely to arrive late than those from White voters. According to a voter file study of Florida’s 2018 general election, ballots from Black Americans, Latinx Americans, and other racial and ethnic voters were more than two times as likely to be rejected as ballots cast by White voters.62 The common cause is mismatched or missing signatures, as well as inconsistencies in how voters are notified of the rejection and the chance to cure, or fix any mistakes on, the ballot.63 A similar study of Georgia’s 2018 election found that a disproportionate number of ballots from young voters, first-time voters, and Black voters were rejected due to an error on the return envelope or late arrival.64
Some of these errors could be attributed to a lack of voter education programs and less-reliable mail service in underserved communities with higher populations of non-White and younger voters.65 Additionally, Black, Latinx, and Indigenous voters are more transient, may have more difficulty affording or finding postage, and often experience homelessness at higher rates than White voters.66 For them, acquiring and maintaining a valid mailing address could prove to be a major barrier to mail-in voting.
Legacy of violence against Black Americans
Not all race-based voter suppression is the function of current racial animus, partisan fervor, or legalistic rules and regulations. There is also evidence that historical racial violence—itself a voter suppression tactic—still echoes in the voting behavior of Black Americans today. Economic Policy Institute economist Jhacova Williams found that Black Americans living in counties that had more lynchings between 1882 and 1930 are less likely to be registered to vote and less likely to actually vote, compared to similarly situated White Americans.67
Turnout rates
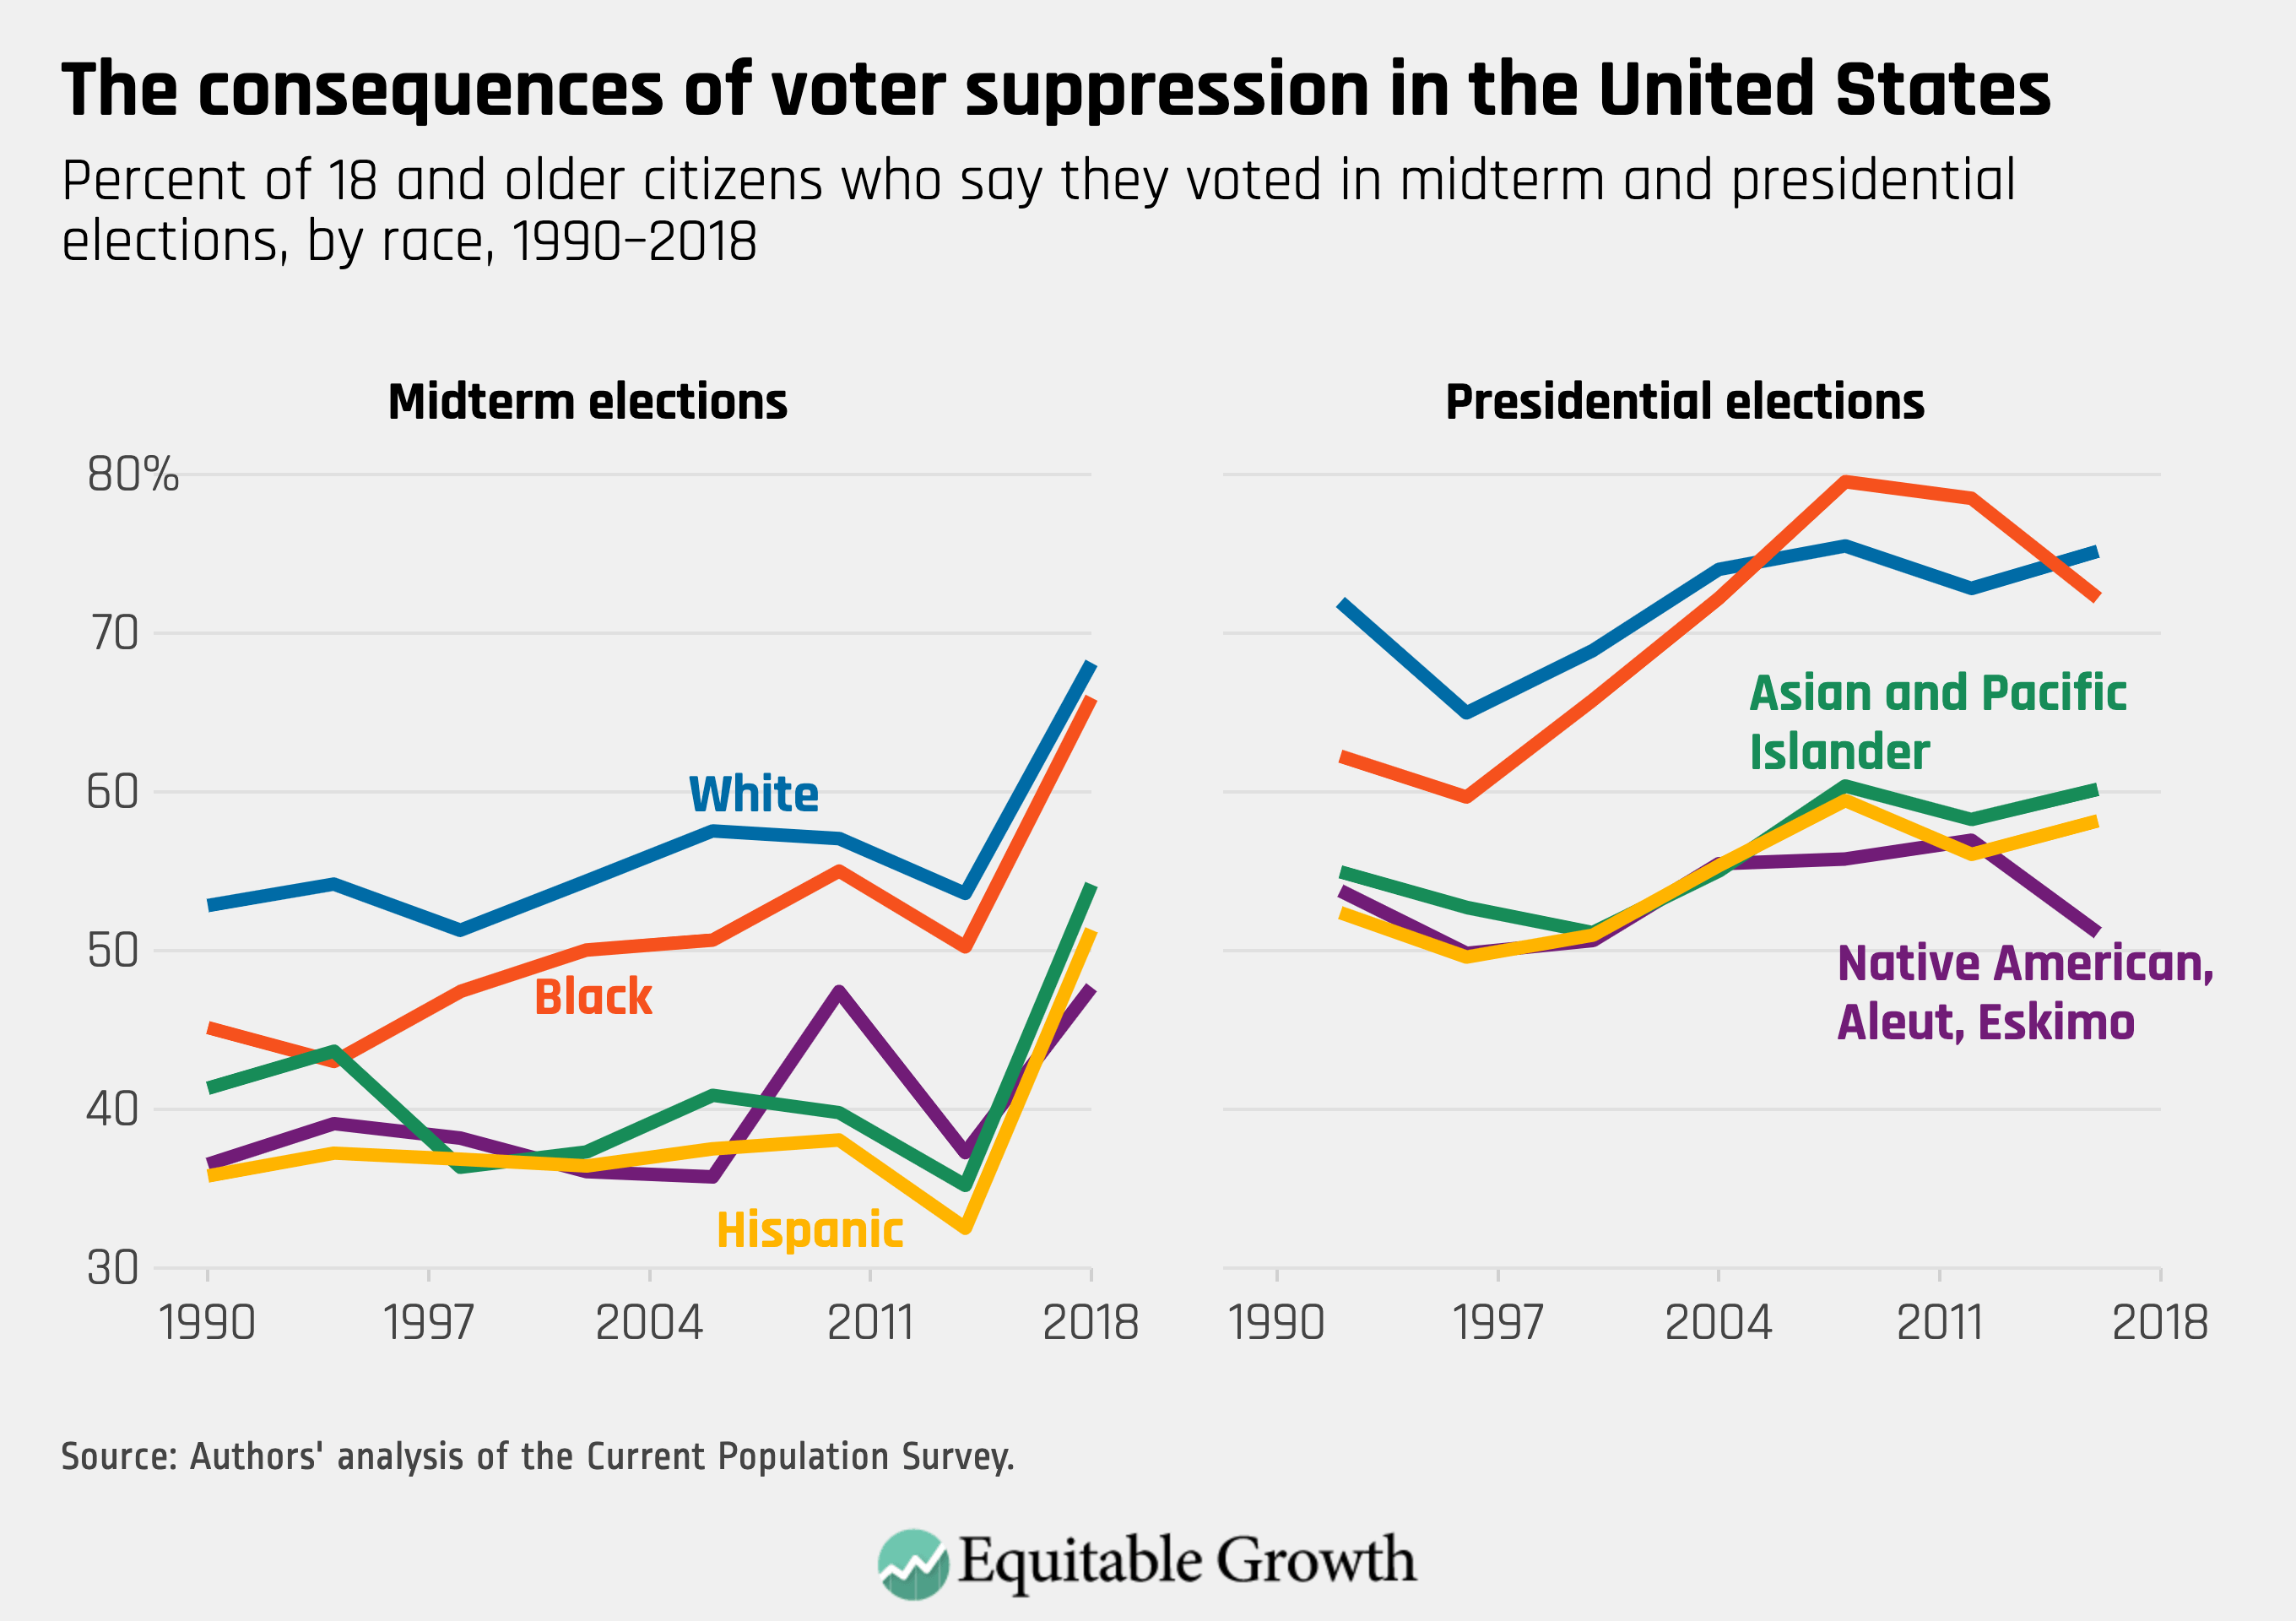
Despite all these voter suppression barriers, turnout among Black Americans, Asian Americans, and Latinx Americans is relatively high, though often still below that of White Americans. In the presidential election in 2016, for example, Black voter turnout was just shy of 60 percent, whereas more than 65 percent of White Americans voted.68 Just less than 50 percent of Asian Americans and Latinx Americans turned out to vote that year.69 In 2012, by contrast, Black Americans voted at a higher rate than White Americans—66.6 percent, compared to 64.1 percent, the first time that had ever happened.70 Voting in 2018 was very high by midterm standards, but the voting divide between White, Black, Asian, and Latinx Americans remained.71 (See Figure 3.)
Figure 3
While research into the voting behaviors of American Indians and Alaska Natives is scant, these groups also are subject to voting barriers, as well as to outright discrimination. Native Americans were not granted citizenship until 1924 and even then were denied access to the polls in many states.72 Utah, New Mexico, and South Dakota, for example, all explicitly denied certain American Indians from voting well into the middle of the 20th century.73
Still today, registration rules that require traditional street addresses, voter identification laws that do not accept tribal identification cards, and limited polling sites in or near reservations disproportionately disenfranchise Native Americans.74 As a result, 34 percent of Native Americans and Alaska Natives—more than 1 million people—are of voting age and are U.S. citizens but are not registered to vote.75 In 2008, turnout of Native Americans and Alaska Natives was lower than all other racial and ethnic groups, at 47.5 percent.76
Interactions between U.S. voting divides and economic policymaking

All of this matters, of course, because in our republic, elected officials are ultimately accountable to the people, and, in this way, popular opinion influences government economic policymaking, albeit often slowly and indirectly. But elected officials are only truly accountable to those Americans who vote. So, an electorate that skews richer and Whiter than the country overall will likely result in policymakers who are more responsive to the concerns and interests of already-privileged citizens, making it more difficult to escape what some observers have dubbed an “inequality trap.”77
The effects of electoral inequality on economic inequality
Political scientists once believed that more fulsome political participation wouldn’t change much about the U.S. policymaking landscape, believing that the ideological views and policy preferences of nonvoters closely mirrors that of voters.78 But the political landscape changed over the past two decades, and there is now consensus that voters and nonvoters differ ideologically.79 Nonvoters tend to believe that the federal government should be bigger, that more money should be redistributed from the rich to the poor, that unions should be easier to join, and that education should be funded more generously, among other liberal policy preferences.80
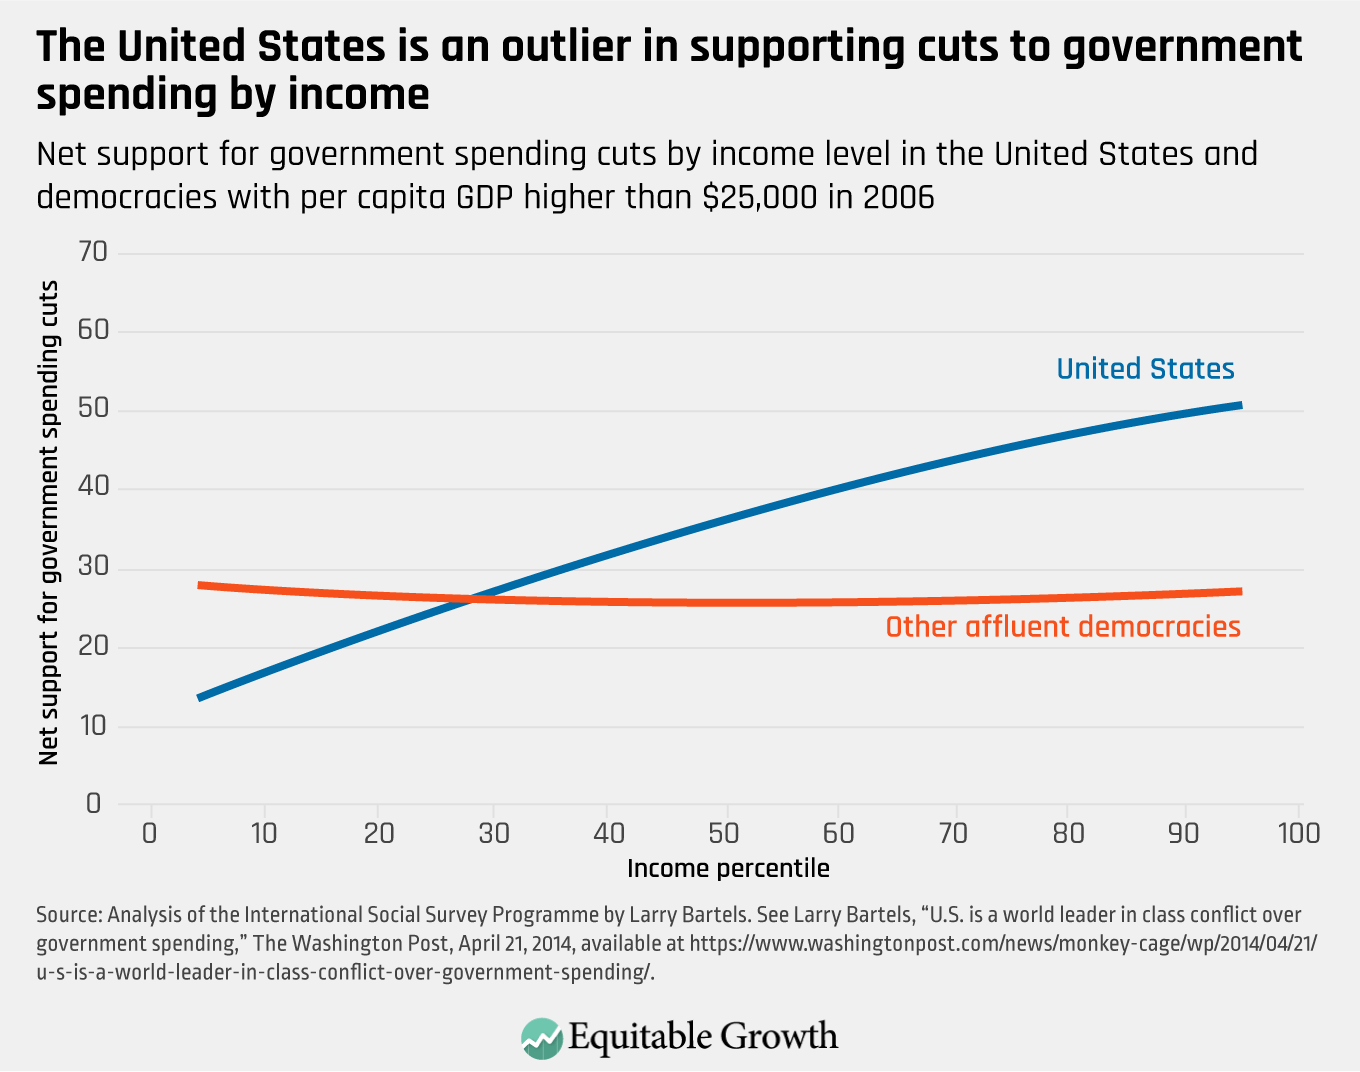
In contrast, Benjamin Page at Northwestern University, Larry Bartels at Vanderbilt University, and Jason Seawright at Northwestern University conclude that the top 1 percent of wealth holders have more conservative views than the general public.81 This income-based difference in policy preference is particularly stark when it comes to support for government spending. The United States is an outlier among its peer nations in this regard, a fact that Bartels attributes to our nation’s structural racism and its use of “hidden” tax expenditures, rather than direct spending, to subsidize affluent people.82 (See Figure 4.)
Figure 4
Responsiveness of economic policymaking to voters
For these differences in economic policy preferences between voters and nonvoters to matter, elected officials must actually be attuned and responsive to the economic policy preferences of their voters. And indeed, there is a growing evidence base that links voting behavior with economic policy outcomes.
Take, for example, three studies that look at the re-enfranchisement of Black Americans as a result of the Voting Rights Act of 1965. Giovanni Facchini and Cecilia Testa at the University of Nottingham and Brian Knight at Brown University find that the law reduced the rate of Black arrests in jurisdictions where the chief law enforcement officer is elected, not appointed.83 When Black Americans have the ability to vote for their sheriff, they are more likely to get fairer treatment by the criminal justice system, an important factor in shaping labor market outcomes.84
Similarly, economists Elisabeth Cascio at Dartmouth College and Ebonya Washington at Yale University find that Southern counties with higher shares of Black Americans as residents experienced greater increases in both voter turnout and state investments in institutions and government programs important to Black citizens, compared to otherwise-similar counties, in the 20 years after the Voting Rights Act banned literacy tests, the predominant way local election officials in the South disenfranchised would-be Black voters.85
Then, there are the recent findings of Abhay Aneja, a law professor at the University of California, Berkeley, and finance professor Carlos Fernando Avenancio-León at Indiana University Bloomington (both Equitable Growth grantees). They used variation around enforcement of the Voting Rights Act to conclude that counties where voting rights were more strongly protected experienced larger reductions in the wage divide among Black workers and White workers between 1950 and 1980 as a result of increased public employment,86 fiscal redistribution, affirmative action, and anti-discrimination laws.87
This last paper is especially relevant for our purposes because it definitively links access to the polls with inequality-fighting economic policy.88 In a follow-up article, Aneja and Avenancio-León test whether the removal of some protections under the Voting Rights Act as a result of the 2013 Supreme Court decision in Shelby County v. Holder is supercharging economic inequality.89 The answer, sadly, is yes. The authors first cite a separate study that shows that in the wake of the Shelby County decision, voter turnout fell in counties that were previously subject to stringent voter suppression oversight, likely as a result of newly enacted restrictive voter identification laws, voter roll purges, reductions in early voting, and polling place closures.90 Aneja and Avenancio-León then demonstrate that removal of voting protections under the Voting Rights Act significantly increased the racial wage divide.
Scholars also have looked at the economic effects of Black political power prior to the Voting Rights Act. Equitable Growth grantee Trevon Logan, an economist at The Ohio State University, studies the policy impacts of Black politicians in the Reconstruction-era South, during which newly-freed Black Americans participated in politics in record numbers. He finds that the election of Black politicians had significant economic impacts on the size and function of government.91 In counties with elected Black officials, collected tax revenue was significantly higher, often due to taxes imposed on wealthy White landowners, suggesting that Black politicians brought a redistributive outlook to the office. Consequently, Black citizens in those counties saw real benefits, with literacy among Black Americans increasing and the White-Black divide in literacy narrowing. These changes were generally undone by the end of Reconstruction and the imposition of Jim Crow segregation laws.
In a complementary finding, economist Suresh Naidu at Columbia University (also an Equitable Growth grantee) calculated that Black disenfranchisement after the short-lived Reconstruction era reduced the teacher-child ratio in Black schools because politicians had no incentive to properly fund Black schools. It also reduced Back workers’ wages, as these workers had little recourse to legal or political institutions and fewer opportunities in the public sector.92
We also see economic policy effects when lower-income citizens go to the polls in larger numbers. Political scientists Kim Quaile Hill and Jan Leighley at Texas A&M University and Angela Hinton-Anderson at Loyola University Chicago found that higher voting rates by lower-income citizens were associated with more generous state income-support programs between 1978 and 1990.93 Economists Thomas Husted at American University and the late Lawrence Kenny at the University of Florida reached a similar conclusion after showing that the elimination of poll taxes and literacy tests after the enactment of the Voting Rights Act in 1965 led to higher turnout by low-income citizens and more income-support spending by state governments.94
Research by political scientists William Franko at West Virginia University, Nathan Kelly at the University of Tennessee, and Christopher Witko at Pennsylvania State University takes another tact. They look at state variations in income-based differences in voting and conclude that “states with higher levels of class bias in voting [divergence in turnout between higher- and lower-income voters] have been less likely to enact minimum wage increases,” among other inequality-fighting policies. They also find an association between class bias in voting and increased income inequality.95
In a separate but similar paper, Franko finds that housing, healthcare, and wage equity policies are more generous the more egalitarian political participation is in each state.96 The author hypothesizes that this is caused by a more representative electorate having more direct experience with anti-poverty programs and thus less bias against such policies. Finally, political scientists James M. Avery at Stockton University and Mark Peffley at the University of Kentucky find that restrictive state voter registration laws exacerbate income-biased turnout, which, in turn, makes it more likely that policymakers pass restrictive eligibility rules for the Temporary Assistance for Needy Families program.97
The effect of economic inequality on voting inequality
If lower turnout among low- and middle-income Americans means policymakers are less responsive to the concerns of the working class and to fighting economic inequality, then what about causation in the other direction? In other words, does economic inequality itself, and the idea that the U.S. economic system is rigged, depress turnout? Distressingly, the answer seems to be yes.
In their comprehensive paper, titled “‘Don’t play if you can’t win’: Does economic inequality undermine political equality?,” political scientists Armin Schäfer at the University of Münster and Hanna Schwander at Humboldt-University, Berlin look at a number of datasets in various countries to conclude that “economic inequality exacerbates participatory inequality.”101 The countries with the least egalitarian economies have turnout rates 7 percentage points to 15 percentage points lower than their more-equal counterparts.102 Depressed turnout is particularly pronounced among citizens in lowest income group. (See Figure 5.)
Figure 5
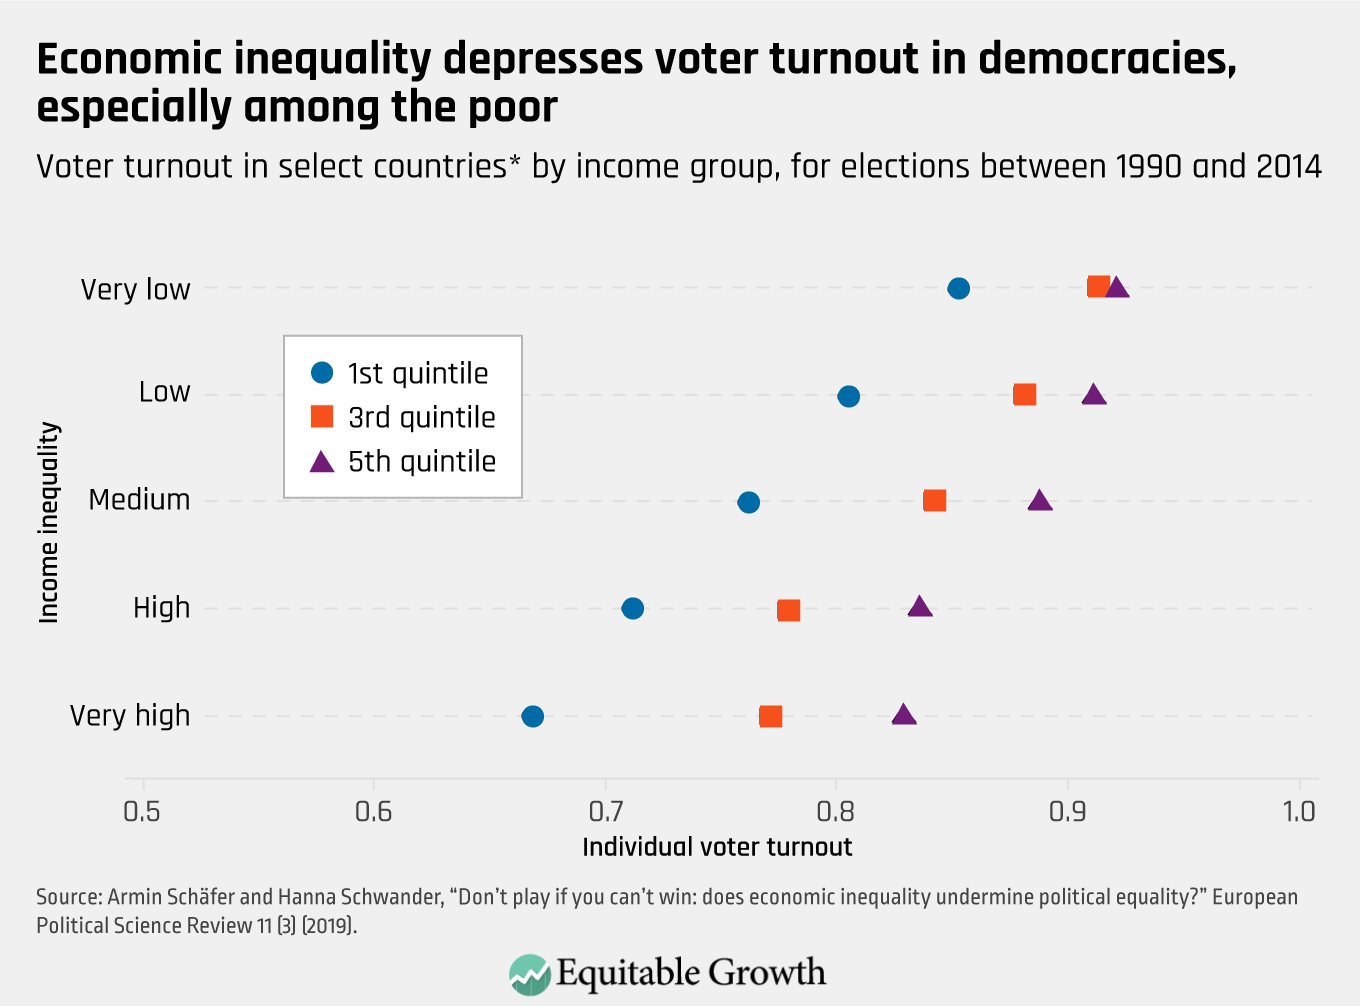
This finding helps explain recent trends in the United States, where inequality has worsened and, simultaneously, policymakers have weakened protections for workers’ rights, expanded corporate power, and cut taxes for the well-off. Political inequality begets economic inequality, which begets further political inequality. Unless the cycle can be reversed, the country will continue to wait in vain for key inequality-fighting policies such as a more progressive tax code, a higher minimum wage, and a more robust social insurance system. Our next section looks at some policy proposals that could help break this dangerous feedback loop.
Policy solutions to the problems of income- and race-based voting barriers in the United States

How can state, local, and federal policymakers across the country begin to reverse these troubling trends? Policymakers should consider the following evidence-based ideas to ensure the electorate is truly representative of our country’s economic and racial diversity.
Ease registration requirements
The research is clear that registering to vote is the single biggest obstacle blocking low-income, Black, Latinx, Indigenous, and other would-be voters from exercising their right to vote. But voting does not have to be a two-step process. There are a variety of reforms that could be undertaken. Four possible reforms are:
- Make voter registration automatic
- Allow for universal same-day voter registration
- Expand motor voter registration and allow voters to easily register while filing their taxes
- Allow 16- and 17-year-olds to pre-register to vote
Let’s briefly examine each of these recommendations in turn.
Make voter registration automatic
While it is unlikely that all states will follow North Dakota’s lead and simply eliminate the registration requirement, the next-best option is for states to achieve near-universal registration by automatically registering citizens as soon as they interact with any government agency, making voter registration “opt-out” instead of “opt-in.”103
Seventeen states and the District of Columbia now follow a version of this approach, automatically registering, without any paper application, residents who interact with their motor vehicle bureaus or apply for public assistance.104 The For the People Act, which passed the House of Representatives in 2019 and was recently reintroduced in the 117th Congress, includes automatic voter registration.105
Allow for universal same-day voter registration
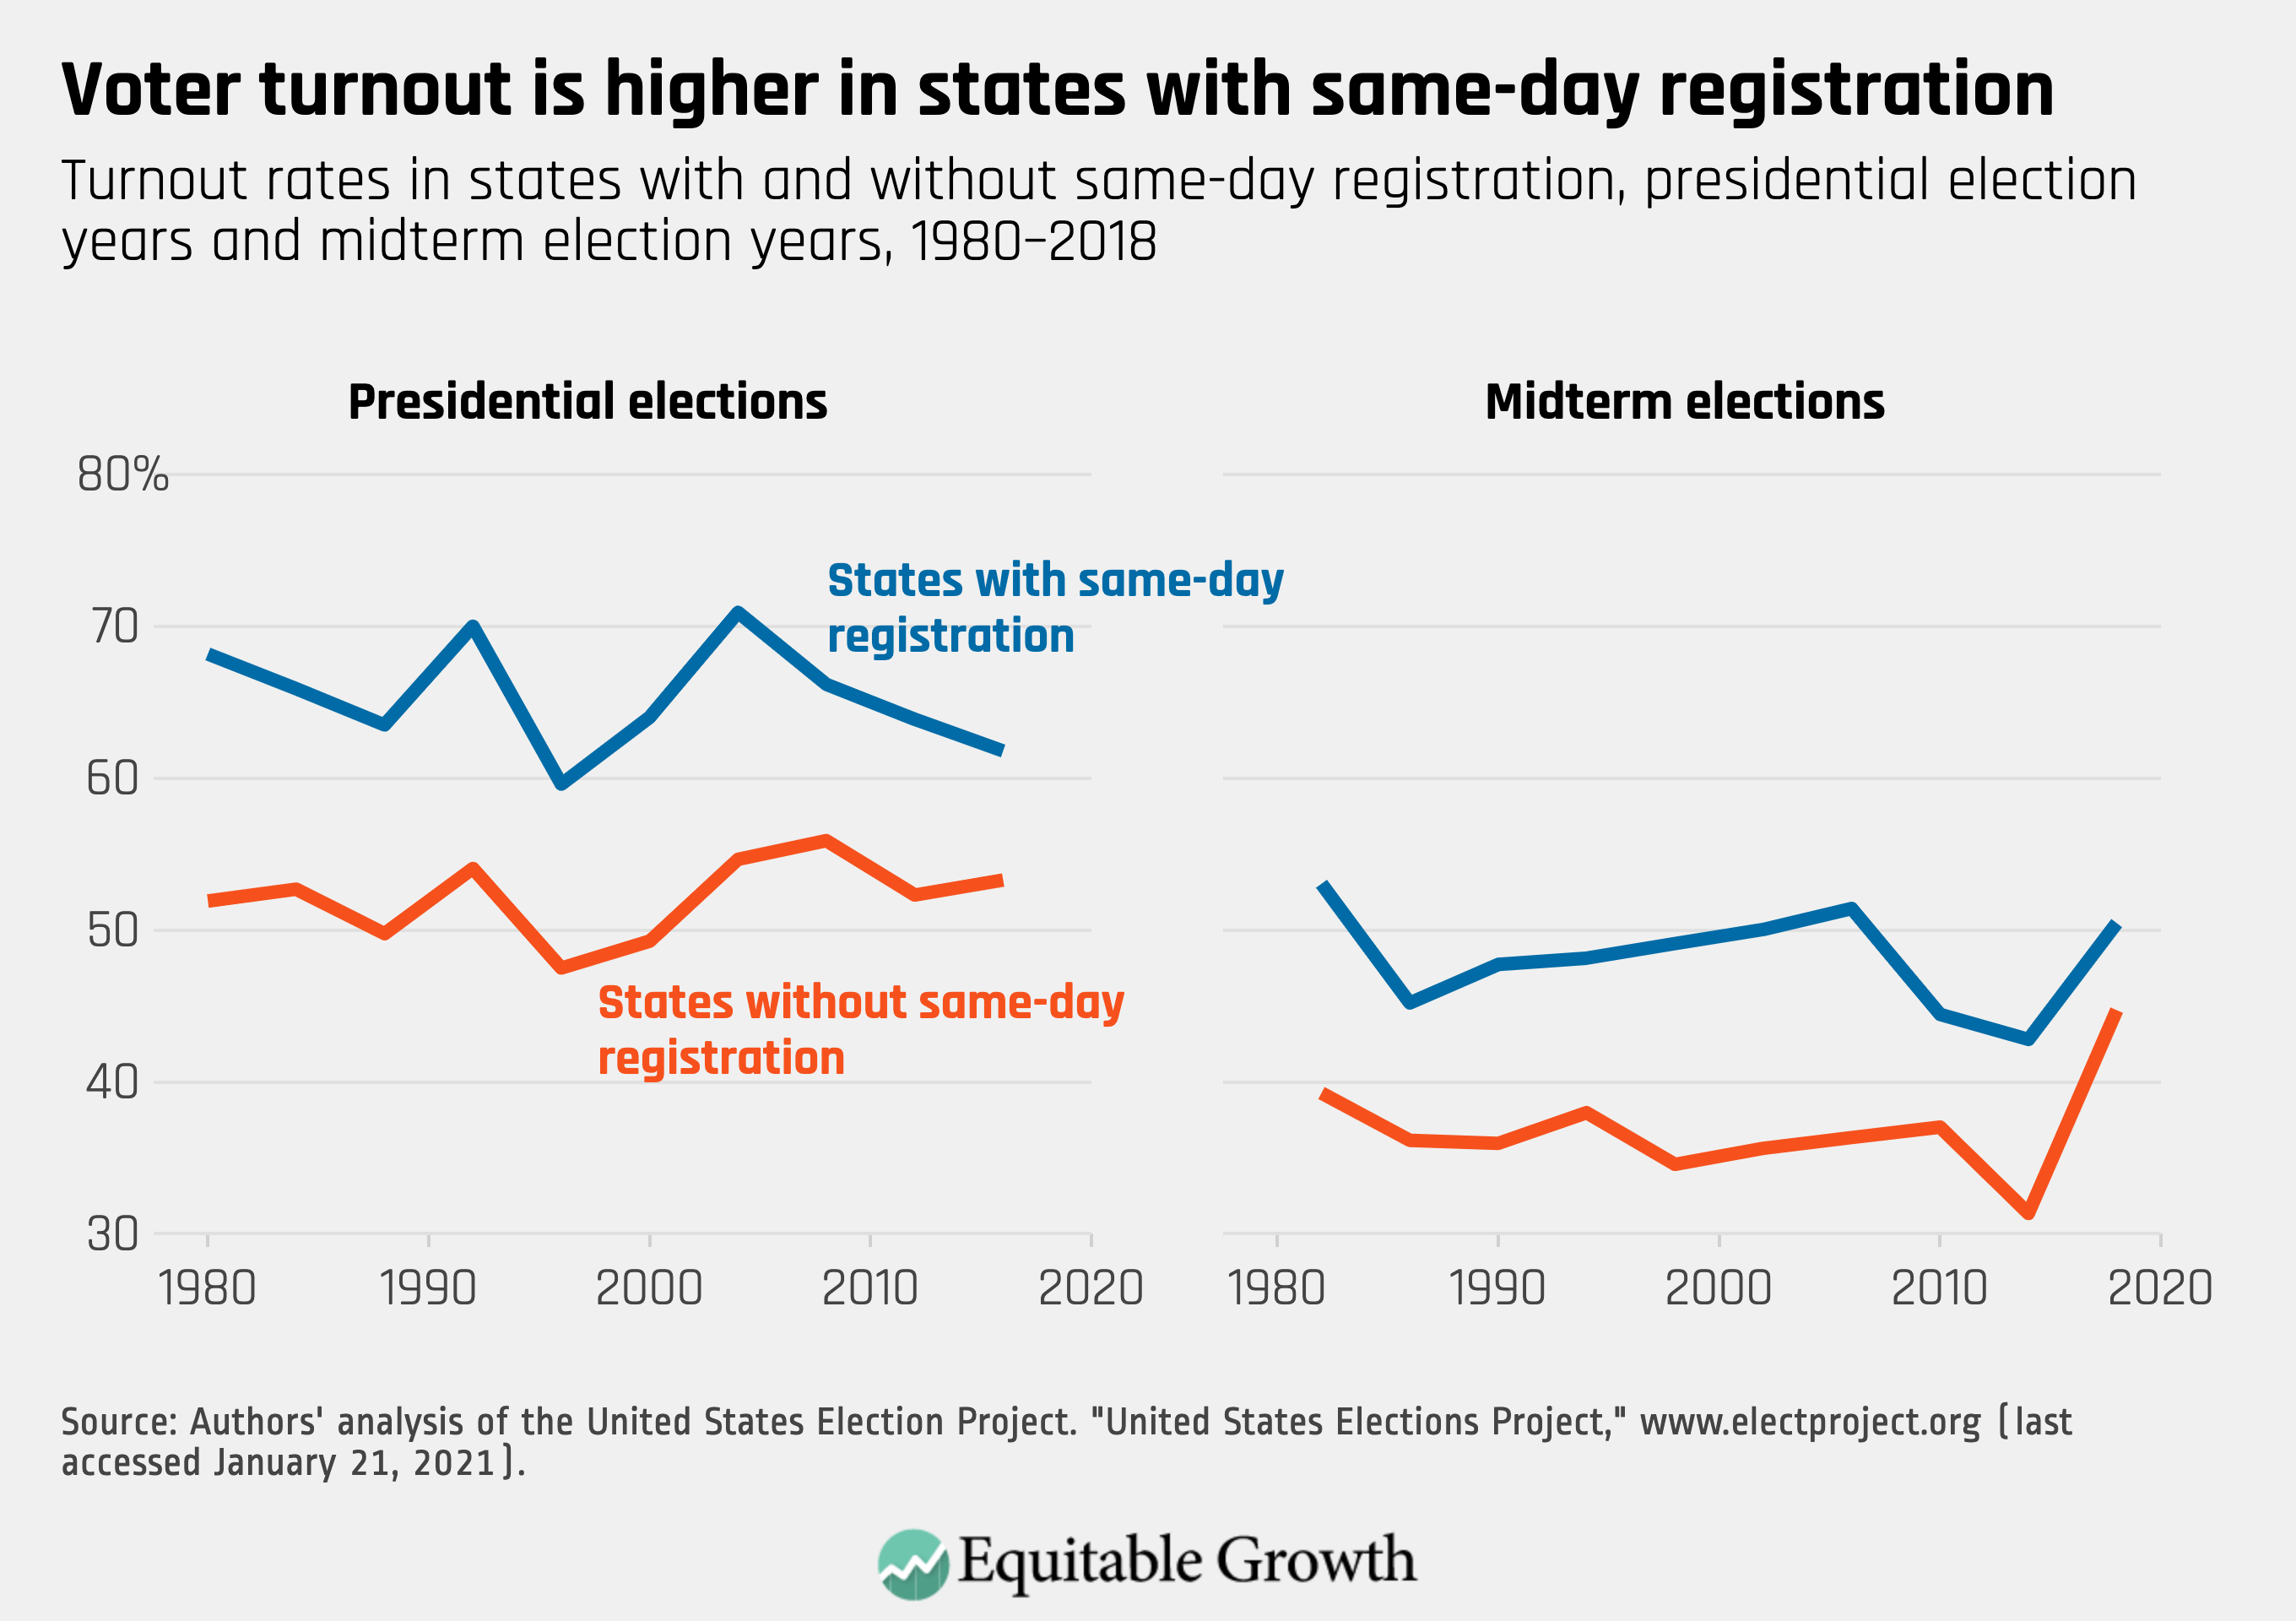
Even if individuals remain on the hook for registering to vote, placing arbitrary registration deadlines weeks or days ahead of the election needlessly suppresses turnout. Indeed, allowing voters to register and vote at the same time is one of the best ways to equalize access to the polls.106 This policy is particularly helpful for those who have recently moved.
Both the Voter Empowerment Act, authored by the late Rep. John Lewis (D-GA), and the Same Day Registration Act would require states to make same-day voter registration available. States with same-day registration consistently lead the nation in voter participation, with average turnout more than 10 percentage points higher than in other states in 2012.107 (See Figure 6.)
Figure 6
Expand motor voter registration and allow voters to easily register while filing their taxes
Section 7 of the National Voter Registration Act (often referred to as “motor voter”) required various government agencies, including states’ Department of Motor Vehicles, to give citizens the option to register to vote while conducting other government business, such as applying for a driver’s license. The law is credited with decreasing income-based bias in voter turnout in states where there had previously been big registration divides between the rich and poor.108
Yet states with large Black populations are less likely to fully comply with the law.109 And compliance overall is uneven.110 What’s more, many government agencies are left out, including Indian Health Service facilities, U.S. Citizenship and Immigration Services, and the health benefit exchanges under the Affordable Care Act (those run both by the federal government and by the states).111 Section 7 should be expanded to cover these institutions.
Along these same lines, citizens also should be able to register when they complete their state or federal taxes, through a new “Schedule VR,” an idea proposed by Jeremy Bearer-Friend at The George Washington University and Vanessa Williamson at The Brookings Institution.112 Canada has done something similar, to good effect.113
Allow 16- and 17-year-olds to pre-register to vote
More than 20 states allow teenagers (usually between 16 and 17 years of age) to pre-register to vote. In addition to ensuring they are ready to vote at 18, this also adds their name and information to the state’s voter file, making them more likely to be contacted by campaigns and grassroots efforts, which will likely increase their engagement and eventual participation.
The For the People Act would require states to accept voter registration applications made by would-be voters 16 years of age and older, and would provide grants to states to help fund implementation.114 Younger Americans are more racially diverse than older Americans and, because they are still early in their careers, also have lower incomes than older Americans, so this reform would be a small step toward a more representative electorate.
Restore voting rights to people with felony convictions
As seen in Florida, leaving this policy to the states is a recipe for abuse, with huge implications on voting access for low-income, Black, and Latinx Americans. A national mandate that felons who are no longer serving time in prison must become eligible to vote, no matter the state in which they live (and how much in court fees and fines have accrued on their account), as proposed in the For the People Act, would be a major step forward.115 An even bolder and more consequential step would be to follow the model of Maine and Vermont and end disenfranchisement altogether, allowing prisoners to vote.
Reduce wait times for voting
No American should have to wait hours to fulfill their right to vote. Congress should require that states take steps to ensure no voter waits longer than an hour. This is especially important for parents of young children and low-income workers, who already struggle to make it to the polls, likely due to a lack of child care or paid leave from work. The Voting Access Act is one notable proposal in this area.116
Guarantee workers get paid time off for voting
In many states, workers have no right to leave work to go vote, and even in states with protections, employers can often refuse workers’ requests to take time off to vote. To ensure that workers do not have to choose between fulfilling their civic duty and putting food on the table, the federal government could set a national floor requiring four hours of paid leave on Election Day for all workers who average above a certain number of hours at their employer per week.117 Another way to achieve a similar end would be to turn Election Day into a national holiday, an idea included in the For the People Act.118
Reestablish federal oversight
The Voting Rights Act of 1965 was a game-changer for both Black representation and Black economic empowerment. There is even evidence that the Voting Rights Act reduced political violence in the South, as both pro- and anti-segregationist groups increasingly saw elections as the way to solve political disputes.119 Unfortunately, the Supreme Court rolled back many of the protections in that law in their 2013 decision in Shelby County v. Holder, effectively terminating the federal government’s power to supervise elections and pre-approve election administration changes in states and counties with a history of voter suppression.
Predictably, many jurisdictions once governed by the Voting Right Act have responded to the relaxed standards by passing restrictive laws that suppress voting rights, especially among low-income Americans and Americans of color.120 Congress should restore the federal government’s power under the Voting Rights Act so that discriminatory voter identification laws and other policies that block or purge Black voters face heightened scrutiny.121 Since the Shelby decision, federal lawmakers have introduced legislation in every Congress to do just that, but those bills have never made it to the president’s desk to be signed.122
Native Americans also deserve special federal protections. Voting laws need to ensure, for example, that tribal identification cards can be used for voting and that polling locations and mail-in voting options are readily accessible to those living on reservations. The Native American Voting Rights Act, currently pending in Congress, would deliver these safeguards.123
Congress also should consider going further, so that every voter in the United States, not just those in certain states or from certain groups, is protected by a federal watchdog. This could take the form of a new federal elections agency to help oversee and adjudicate the countless legal claims, counterclaims, suppression tactics, and procedural changes swirling around each election cycle, as well as collecting more and better data on who is being turned away from each polling place and why.124
Learn from the unique 2020 election experience, especially the increase in voting by mail
The coronavirus pandemic and Postal Service crisis tested state and county election officials in unique ways in 2020.125 Some jurisdictions took extraordinary measures to ensure a smooth election, such as eliminating the need to request an absentee or vote-by-mail ballot; employing creative tactics to address the poll worker shortage and recruit new volunteers; utilizing large, open-air polling places such as sport stadiums but reducing the overall number of polling locations; expanding the number of days of early voting; changing vote-by-mail deadlines from “received by Election Day” to “postmarked by Election Day”; and installing ballot drop boxes to reduce the burden on the Postal Service altogether.126 The results of these innovations seem to have helped boost turnout and ensure a smooth election, but we are hopeful that researchers will soon be able to definitively analyze how these tactics reduced, or perhaps exacerbated, income and racial bias in election participation.
Historically, expanded voting by mail or “no excuse” absentee voting and other so-called convenience reforms have been found to help those already registered vote more easily—an undeniably good thing—but are not measures that, on their own, would increase voting by historically disenfranchised Americans.127 That said, streamlining the vote-by-mail process, as many jurisdictions did in 2020, could enable low- and moderate-income workers or those workers caring for family to vote more easily without missing work. In Colorado, for example, the move to all-mail elections in 2014 resulted in a large increase in turnout and a reduction in turnout inequality, with substantial increases among blue-collar workers and Americans of color.128
Wherever the research leads, policymakers should apply the lessons from 2020’s unique experience to future elections. If voting by mail were to be expanded permanently, then the system must be structured so that all eligible Americans—especially those who face significant barriers due to systemic racism and economic inequality, as described earlier in this report—can take advantage.129
Conclusion
The U.S. electorate is whiter and richer than the country overall, which subverts democratic accountability and likely short-circuits inequality-fighting economic policymaking. This creates a dangerous feedback loop, with economic inequality itself depressing turnout among historically underrepresented groups and thus undermining the structural policy changes we need to achieve strong, stable, and broad-based economic growth.
Like other American institutions, the U.S. electoral system is subverted by those in power to perpetuate inequality, deepening both economic and democratic injustice. Thankfully, there is a way out of this negative cycle—reimagining an electoral system that would allow wider participation, especially among the Black, Latinx, Indigenous, and low-income Americans who are currently much more likely to be disenfranchised. Though the reforms recommended in this report will not alone fix the U.S. republican form of government, they would go a long way to improving representativeness in the electorate and combating the interconnected economic problems of inequality, instability, and slow growth.
About the authors
David Mitchell is the director of government and external relations at the Washington Center for Equitable Growth. Prior to joining Equitable Growth, he was the associate director for policy and market solutions at the Aspen Institute Financial Security Program, where he led a growing team responsible for amplifying research and spurring action to address the short- and long-term financial challenges facing low- and moderate-income Americans, including income volatility, retirement insecurity, and consumer debt. Mitchell previously worked as a legislative aide to U.S. Sen. Sherrod Brown (D-OH), handling healthcare and Social Security issues and working on the landmark health reform law that passed in 2010. He also has held positions with the U.S. Senate Finance Committee, the White House National Economic Council, the law firm Hogan Lovells, the Office of Management and Budget, Citizens for Tax Justice, and the National Association of Community Health Centers. He holds a B.A. in political science from Tufts University, an M.PA from the Princeton School of Public and International Affairs, and a J.D. from the Georgetown University Law Center, where he was a public interest law scholar.
Austin Clemens is a computational social scientist at the Washington Center for Equitable Growth. Prior to joining Equitable Growth, Clemens was an assistant research scientist at the Public Policy Research Institute at Texas A&M University, where he researched criminal justice policy. Clemens holds a bachelor’s degree in economics from the University of Texas and a doctorate in political science from the University of Georgia. His work has appeared in ESPN the Magazine, Smithsonian magazine, Legislative Studies Quarterly, and the Journal of Business and Politics.
Shanteal Lake is the external relations associate at the Washington Center for Equitable Growth. Prior to joining Equitable Growth, she managed a variety of work streams and policy portfolios focused on eliminating inequities in education with clients such as the U.S. Chamber of Commerce Foundation, Collaborative for Student Success, and the Smarter Balanced Assessment Consortium. Previously, Lake served on the U.S. House of Representatives’ Committee on Education and the Workforce, where she supported the committee’s messaging, media coverage, and digital presence across a diverse range of public policy issues. She holds an M.A. in political and strategic communication from American University and a B.A. in political science from Spelman College.
Acknowledgments
We thank Mark Huelsman, Amanda Fischer, and Casey Schoeneberger for reading earlier drafts of this report and providing invaluable feedback. We thank Ed Paisley for his superb editing, David Evans for his deft design, and Emilie Openchowski for the copy edit. All errors are, of course, our responsibility alone.
End Notes
1. Elizabeth Rigby and Melanie J. Springer, “Does Electoral Reform Increase (or Decrease) Political Equality?” Political Research Quarterly 64 (2) (2011): 420–434.
2. Numbers are based on the authors’ analysis of Census data from the Current Population Survey. This, and all voting numbers in the report, entail some uncertainty because it is well-known that nonvoters will sometimes say they voted on surveys. Moreover, the Census Bureau reports respondents who say they voted, did not vote, and did not answer the voting questions, so there may be bias from the nonresponse in these surveys.
3. David Callahan and J. Mijin Cha, “Stacked Deck: How the Dominance of Politics by the Affluent & Business Undermines Economic Mobility in America” (New York: Demos, 2013).
4. Bendixen and Amandi International, “The 100 Million Project: The Untold Story of American Non-Voters” (Miami: Knight Foundation, 2020).
5. Ibid.
6. However, some policymakers continue to try to use outstanding financial obligations as a way to block access to the polls. See, for example, the discussion of criminal disenfranchisement in Florida in the following section.
7. Randall Akee and others, “Family Income and the Intergenerational Transmission Of Voting Behavior: Evidence From An Income Intervention.” Working Paper 24770 (National Bureau of Economic Research, 2018).
8. Zachary Markovich and Ariel White, “More Money, More Turnout? Minimum Wage Increases and Voting.” Self-Published Working Paper (2019).
9. “Access to paid sick leave, vacations, and holidays varies by wage category,” available at https://www.bls.gov/opub/ted/2016/access-to-paid-sick-leave-vacations-and-holidays-varies-by-wage-category.htm (last accessed January 22, 2021).
10. Robin Phinney, “Exploring Residential Mobility among Low-Income Families,” Social Service Review 87 (4) (2013): 780–815.
11. Bernadette Rabuy and Daniel Kopf, “Prisons of Poverty: Uncovering the pre-incarceration incomes of the imprisoned” (Northampton, MA: Prison Policy Initiative, 2015).
12. Fang Zhao and Thomas Gustafson, “Transportation Needs of Disadvantaged Populations: Where, When, and How?” (Washington: U.S. Department of Transportation, 2013).
13. Lynda Laughlin, “Who’s Minding the Kids? Child Care Arrangements: Spring 2011” (Washington: U.S. Census Bureau, Department of Commerce, 2013), pp. 3–4, table 2.
14. Drew Desilver, “In past elections, U.S. trailed most developed countries in voter turnout,” Pew Research Center Fact Tank blog, November 3, 2020, availabe at https://www.pewresearch.org/fact-tank/2018/05/21/u-s-voter-turnout-trails-most-developed-countries/.
15. Susan K. Urahn and Alexis Schuler, “Why Are Millions of Citizens Not Registered to Vote?” (Washington: Pew Charitable Trusts, 2017).
16. Youjin B. Kim, “Democracy In A Mobile America” (New York: Demos, 2012).
17. Michelle D. Holmes, “Will Democrats Give Unmarried Women a Reason and a Way to Vote?” The American Prospect, March 12, 2020, available at https://prospect.org/politics/will-democrats-give-unmarried-women-reason-and-way-to-vote/. Andrew Joseph Pegoda, “I asked people why they don’t vote, and this is what they told me,” The Conversation, January 17, 2020, available at https://theconversation.com/i-asked-people-why-they-dont-vote-and-this-is-what-they-told-me-129421.
18. Ruth Igielnik, “Men and women in the U.S. continue to differ in voter turnout rate, party identification,” Pew Research Center Fact Tank blog, August 18, 2020, available at https://www.pewresearch.org/fact-tank/2020/08/18/men-and-women-in-the-u-s-continue-to-differ-in-voter-turnout-rate-party-identification/.
19. Maggie Germano, “Women Are Working More Than Ever, But They Still Take On Most Household Responsibilities,” Forbes, March 27, 2019, available at https://www.forbes.com/sites/maggiegermano/2019/03/27/women-are-working-more-than-ever-but-they-still-take-on-most-household-responsibilities/?sh=31449fc552e9.
20. Nicholas H. Wolfinger and Raymond E. Wolfinger, “Family Structure and Voter Turnout” Social Forces 86 (2008): 1513–1528.
21. Angela Cools, “Parents, Infants, and Voter Turnout,” Working Paper 20-04 (Davidson College Department of Economics, 2020).
22. Taryn Morrissey, “Addressing the need for affordable, high-quality early childhood care and education for all in the United States” (Washington: Washington Center for Equitable Growth, 2020), available at https://equitablegrowth.org/addressing-the-need-for-affordable-high-quality-early-childhood-care-and-education-for-all-in-the-united-states/.
23. Kenneth Quinnell, “Know Your Rights: State Laws on Employee Time Off to Vote,” AFL-CIO blog, November 5, 2016, available at https://aflcio.org/2016/11/5/know-your-rights-state-laws-employee-time-vote.
24. Gustavo López and Antonio Flores, “Dislike of candidates or campaign issues was most common reason for not voting in 2016,” Pew Research Center Fact Tank blog, June 1, 2017, available at https://www.Pewresearch.Org/Fact-Tank/2017/06/01/Dislike-Of-Candidates-Or-Campaign-Issues-Was-Most-Common-Reason-For-Not-Voting-In-2016/.
25. Raymond E. Wolfinger, Benjamin Highton, and Megan Mullin, “How Postregistration Laws Affect the Turnout of Citizens Registered to Vote,” State Politics & Policy Quarterly 5 (1) (2005): 1–23.
26. Authors’ analysis of the Current Population Survey.
27. James Feigenbaum, Alexander Hertel-Fernandez, and Vanessa Williamson, “From the Bargaining Table to the Ballot Box: Political Effects of Right to Work Laws.” Working Paper 24259 (National Bureau of Economic Research, 2018).
28. Jan E. Leighley and J. Nagler, “Unions, Voter Turnout, and Class Bias in the U.S. Electorate, 1964–2004” The Journal of Politics 69 (2007): 430–441.
29. Dukhong Kim, “Labor Unions and Minority Group Members’ Voter Turnout,” Social Science Quarterly 97 (2016): 1208–1226.
30. Thom File, “Characteristics of Voters in the Presidential Election of 2016” (Washington: U.S. Census Bureau, Department of Commerce, 2018), p. 15, table 4.
31. In 2019, Black Americans accounted for 13.2 percent of the total population, and Hispanic Americans accounted for 18.7 percent. See Jessica Semega and others, “Income and Poverty in the United States: 2019” (Washington: U.S. Census Bureau, Department of Commerce, 2020), p. 15.
32. Though overshadowed by the more sweeping Voting Rights Act of 1965, the 24th Amendment to the U.S. Constitution, ratified in 1964, prohibits the conditioning of the right to vote on the payment of poll or other taxes. For a powerful interpretation of how the 24th Amendment could be applied to burdensome election procedures that effectively amount to a poll tax on low-income Americans, see Valencia Richardson, “Voting While Poor: Reviving the 24th Amendment and Eliminating the Modern-Day Poll Tax,” Georgetown Journal on Poverty Law and Policy, vol. 27, no 3 (2020): 451-468.
33. Sonya Rastogi and others, “The Black Population: 2010” (Washington: U.S. Census Bureau, Department of Commerce, 2011), p. 8, table 5.
34. “Criminal Disenfranchisement Laws Across the United States,” available at https://www.brennancenter.org/our-work/research-reports/criminal-disenfranchisement-laws-across-united-states (last accessed November 2020). See also “Felon Voting Rights,” available at https://www.ncsl.org/research/elections-and-campaigns/felon-voting-rights.aspx (last accessed November 2020).
35. Dexter Filkins, “Who Gets to Vote in Florida?” The New Yorker, August 31, 2020, available at https://www.newyorker.com/magazine/2020/09/07/who-gets-to-vote-in-florida.
36. File, “Characteristics of Voters in the Presidential Election of 2016,” p. 15, table 4.
37. “Voting Rights Restoration Efforts in Florida,” available at https://www.brennancenter.org/our-work/research-reports/voting-rights-restoration-efforts-florida (last accessed November 2020).
38. Brennan Center for Justice, “Second Supplemental Expert Report of Daniel A. Smith, Ph.D. in Jones v. DeSantis, etc., et al. (Consolidated Case No. 4:19-cv-300)” (2020).
39. U.S. Census Bureau, “Hispanic or Latino Origin by Race” (2018).
40. Raysor v. DeSantis, No. 19A1071 (U.S. 2020). Billionaire Mike Bloomberg has offered to pay off some of these fines and fees; see Greg Allen, “Bloomberg Adds $16 Million To A Fund That Helps Florida Felons Get Chance To Vote,” National Public Radio, September 24, 2020, available at https://www.npr.org/2020/09/24/916625348/bloomberg-adds-16-million-to-a-fund-that-helps-florida-felons-get-chance-to-vote.
41. Filkins, “Who Gets to Vote in Florida?”
42. Greg Palast, “Georgia Voter Roll Purge Errors” (Atlanta: American Civil Liberties Union of Georgia, 2020). Federal law requires that states keep their voter file up to date, so disputes on purges often turn on how aggressive and/or discriminatory the state is being as it attempts to stay in compliance with federal law. See Pam Fessler, “Are States Purging Or Cleaning Voter Registration Rolls?” National Public Radio, December 20, 2019, available at https://www.npr.org/2019/12/20/790319853/are-states-purging-or-cleaning-voter-registration-rolls.
43. Associated Press, “Wisconsin Voter Purge Case Heads To State Supreme Court,” September 28, 2020, available at https://minnesota.cbslocal.com/2020/09/28/wisconsin-voter-purge-case-heads-to-state-supreme-court/.
44. Henry Redman, “List maintenance or voter suppression: How the practice of maintaining voter lists became polarized,” Wisconsin Examiner, October 8, 2020, available at https://wisconsinexaminer.com/2020/10/08/list-maintenance-or-voter-suppression-how-the-practice-of-maintaining-voter-lists-became-polarized/.
45. Richard Salame, “Texas closes hundreds of polling sites, making it harder for minorities to vote,” The Guardian, March 2, 2020, available at https://www.theguardian.com/us-news/2020/mar/02/texas-polling-sites-closures-voting. See also Jeronimo Cortina and Brandon Rottinghaus, “‘The Quiet Revolution’: Convenience Voting, Vote Centers, and Turnout in Texas Elections.” Paper Presented to the Election Sciences, Reform, and Administration Conference (Philadelphia: University of Pennsylvania, 2019).
46. Stephen Fowler, “Why Do Nonwhite Georgia Voters Have to Wait in Line for Hours? Their Numbers Have Soared, and Their Polling Places Have Dwindled,” ProPublica, October 17, 2020, available at https://www.propublica.org/article/why-do-nonwhite-georgia-voters-have-to-wait-in-line-for-hours-their-numbers-have-soared-and-their-polling-places-have-dwindled.
47. Ibid.
48. Alexa Ura, “Federal judge dismisses lawsuit that sought sweeping changes to Texas’ in-person voting rules,” The Texas Tribune, September 8, 2020, available at https://www.texastribune.org/2020/09/08/texas-voting-rules-lawsuit/.
49. Liz Hipple, “New congressional reports underscore structural inequalities driving U.S. racial disparities in coronavirus infections and COVID-19 deaths,” Value Added blog, May 4, 2020, available at https://equitablegrowth.org/new-congressional-reports-underscore-structural-inequalities-driving-u-s-racial-disparities-in-coronavirus-infections-and-covid-19-deaths/.
50. Philip Bump, “The reduction of ballot drop-off sites in Texas will disproportionately affect Democratic and non-White areas,” The Washington Post, October 1, 2020, available at https://www.washingtonpost.com/politics/2020/10/01/reduction-ballot-drop-off-sites-texas-will-disproportionately-affect-democratic-non-white-areas/.
51. Enrico Cantoni, “A Precinct Too Far: Turnout and Voting Costs,” American Economic Journal: Applied Economics 12 (1) (2020): 61–85. Though not focused on minority access to the polls, another paper found the relationship between distance to polling place and voter turnout to be nonlinear, with suburban voters the most affected by additional miles and rural voters the least affected. J.G. Gimpel and J.E. Schuknecht, “Political participation and the accessibility of the ballot box,” Political Geography 22 (2003): 471–488.
52. M. Keith Chen and others, “Racial Disparities in Voting Wait Times: Evidence from Smartphone Data.” Working Paper 26487 (National Bureau of Economic Research, 2019).
53. Ibid. See also Stephen Pettigrew, “The Racial Gap in Wait Times: Why Minority Precincts Are Underserved by Local Election Officials,” Political Science Quarterly 132 (3) (2017): 527–547.
54. File, “Characteristics of Voters in the Presidential Election of 2016,” p. 15, table 4.
55. “Texas early voting begins with long lines, wait times,” NBC Nightly News, October 13, 2020, available at https://www.nbcnews.com/nightly-news/video/texas-early-voting-begins-with-long-lines-wait-times-93781061604.
56. Michael C. Herron and Daniel A. Smith, “Race, Party, and the Consequences of Restricting Early Voting in Florida in the 2012 General Election,” Political Research Quarterly 67 (3) (2014): 646–65.
57. File, “Characteristics of Voters in the Presidential Election of 2016,” p. 13, table 3.
58. Brittany Renee Mayes and Kate Rabinowitz, “The U.S. hit 73% of 2016 voting before Election Day,” The Washington Post, November 3, 2020, available at https://www.washingtonpost.com/graphics/2020/elections/early-voting-numbers-so-far/.
59. Charles Stewart III, “Some Demographics on Voting by Mail” Election Updates CalTech blog, March 20, 2020, available at https://electionupdates.caltech.edu/2020/03/20/some-demographics-on-voting-by-mail/.
60. Kevin Morris, “Who Votes by Mail?” Brennan Center for Justice blog, April 15, 2020, available at https://www.brennancenter.org/our-work/analysis-opinion/who-votes-mail.
61. Ibid.
62. Daniel A. Smith and Anna Baringer, “ACLU Florida: Report on Vote-by-Mail Ballots in the 2018 General Election.” In American Civil Liberties Union of Florida, ed., Let Florida Vote (2020).
63. Ibid.
64. Enrijeta Shino, Mara Suttmann-Lea, and Daniel A. Smith, “Voting by Mail in a VENMO World: Assessing Rejected Absentee Ballots in Georgia.” Self-Published Working Paper (2020). See also Enrijeta Shino, Mara Suttmann-Lea, and Daniel A. Smith, “Here’s the problem with mail-in ballots: They might not be counted,” The Washington Post, May 21, 2020, available at https://www.washingtonpost.com/politics/2020/05/21/heres-problem-with-mail-in-ballots-they-might-not-be-counted/.
65. Jane C. Timm, “A white person and a Black person vote by mail in the same state. Whose ballot is more likely to be rejected?” NBC News, August 9, 2020, available at https://www.nbcnews.com/politics/2020-election/white-person-black-person-vote-mail-same-state-whose-ballot-n1234126.
66. Laura Williamson, “Universally Accessible and Racially Equitable Vote By Mail” (New York: Demos, 2020).
67. Jhacova Williams, “Historical Lynchings and Contemporary Voting Behavior of Blacks.” Self-Published Working Paper (2018).
68. Jens Manuel Krogstad and Mark Hugo Lopez, “Black voter turnout fell in 2016, even as a record number of Americans cast ballots,” Pew Research Center Fact Tank blog, May 12, 2007, available at https://www.pewresearch.org/fact-tank/2017/05/12/black-voter-turnout-fell-in-2016-even-as-a-record-number-of-americans-cast-ballots/.
69. Ibid.
70. Ibid.
71. Jens Manuel Krogstad, Luis Noe-Bustamante, and Antonio Flores, “Historic highs in 2018 voter turnout extended across racial and ethnic groups,” Pew Research Center Fact Tank blog, May 1, 2019, available at https://www.pewresearch.org/fact-tank/2019/05/01/historic-highs-in-2018-voter-turnout-extended-across-racial-and-ethnic-groups/.
72. Native American Rights Fund, “Obstacles at Every Turn: Barriers to Political Participation Faced by Native American Voters” (2020).
73. Tova Andrea Wang, “Ensuring Access to the Ballot for American Indians & Alaska Natives: New Solutions to Strengthen American Democracy” (New York: Demos, 2012).
74. Peter Dunphy, “The State of Native American Voting Rights” (New York: Brennan Center for Justice, 2019), available at https://www.brennancenter.org/our-work/analysis-opinion/state-native-american-voting-rights.
75. National Congress of American Indians, “Every Native Vote Counts: Fast Facts” (2020).
76. Wang, “Ensuring Access to the Ballot for American Indians & Alaska Natives: New Solutions to Strengthen American Democracy.”
77. Kavya Vaghul, “U.S. democracy stuck in an ‘inequality trap,’” Value Added Blog, July 5, 2016, available at https://equitablegrowth.org/u-s-democracy-stuck-in-an-inequality-trap/.
78. Benjamin Highton and Raymond E. Wolfinger, “The Political Implications of Higher Turnout,” British Journal of Political Science 31 (1) (2001): 179–192.
79. Sean McElwee, “Why the Voting Gap Matters” (New York: Demos, 2014).
80. Jan E. Leighley and Jonathan Nagler, Who Votes Now (Princeton: Princeton University Press, 2013). See also Bendixen and Amandi International, “The 100 Million Project: The Untold Story of American Non-Voters,” finding that “If (non-voters) all voted in 2020, non-voters would add an almost equal share of votes to Democratic and Republican candidates, but important differences exist across swing states.”
81. Benjamin I. Page, Larry M. Bartels, and Jason Seawright, “Democracy and the Policy Preferences of Wealthy Americans,” Perspectives on Politics 11 (1) (2013): 51–73. See also Martin Gilens, “Preference Gaps and Inequality in Representation,” PS: Political Science & Politics 42 (2) (2009): 335–341, finding that policy preferences of low- and high-income are distinct.
82. Larry Bartels, “U.S. is a world leader in class conflict over government spending,” The Washington Post, April 21, 2014, available at https://www.washingtonpost.com/news/monkey-cage/wp/2014/04/21/u-s-is-a-world-leader-in-class-conflict-over-government-spending/.
83. Giovanni Facchini, Brian G. Knight, and Cecilia Testa, “The Franchise, Policing, and Race: Evidence from Arrests Data and the Voting Rights Act.” Working Paper 27463 (National Bureau of Economic Research, 2020).
84. Ibid.
85. Elizabeth U. Cascio and Ebonya Washington, “Valuing the Vote: The Redistribution of Voting Rights and State Funds following the Voting Rights Act of 1965,” The Quarterly Journal of Economics 129 (1) (2014): 379–433.
86. For more on the ways Black political power can translate into public sector employment for Black workers, see Peter K. Eisinger, “Black Employment in Municipal Jobs: The Impact of Black Political Power,” American Political Science Review, vol. 76, no. 2 (1982): 380–392.
87. Abhay P. Aneja and Carlos F. Avenancio-León, “The Effect of Political Power on Labor Market Inequality: Evidence from the 1965 Voting Rights Act.” Working Paper (Washington Center for Equitable Growth, 2020).
88. Though voting divides by gender are outside the scope of this brief, the Aneja and Avenancio-León paper is somewhat analogous to previous studies that found extending the franchise to women, who prioritized child welfare in their political preferences, led to increases in education spending and a concomitant rise in wages, as well as increases in public health spending and a corresponding decline in child mortality. See Esra Kose, Elira Kuka, and Na’ama Shenhav, “Women’s Suffrage and Children’s Education.” Working Paper 24933 (National Bureau of Economic Research, 2020); Grant Miller, “Women’s Suffrage, Political Responsiveness, and Child Survival in American History,” Quarterly Journal of Economics 123 (3) (2008): 1287–1327.
89. Abhay P. Aneja and Carlos F. Avenancio-León, “Disenfranchisement and Economic Inequality: Downstream Effects of Shelby County v. Holder,” American Economic Association Papers & Proceedings 109 (2019): 161–65.
90. Desmond Ang, “Do 40-Year-Old Facts Still Matter? Long-Run Effects of Federal Oversight under the Voting Rights Act,” American Economic Journal: Applied Economics 11 (3) (2019): 1–53.
91. Trevon Logan, “Do Black Politicans Matter? Evidence from Reconstruction.” The Journal of Economic History 80 (1) (2020): 1-37.
92. Suresh Naidu, “Suffrage, Schooling, and Sorting in the Post-Bellum U.S. South.” Working Paper 18129 (National Bureau of Economic Research, 2012).
93. Kim Quaile Hill, Jan E. Leighley, and Angela Hinton-Andersson, “Lower-Class Mobilization and Policy Linkage in the U.S. States,” American Journal of Political Science 39 (1) (1995): 75–86. See also Kim Quaile Hill and Jan E. Leighley, “The Policy Consequences of Class Bias in State Electorates,” American Journal of Political Science 36 (2) (1992): 351–65.
94. Thomas A. Husted and Lawrence W. Kenny, “The Effect of the Expansion of the Voting Frachise on the Size of Government,” Journal of Political Economy 105 (1) (1997): 54–82.
95. William Franko, Nathan J. Kelly, and Christopher Witko, “How Roadblocks to Voting Make Income Inequality Worse,” Scholars Strategy Network Key Findings, January 15, 2014, available at https://scholars.org/contribution/how-roadblocks-voting-make-income-inequality-worse. See also William W. Franko, Nathan J. Kelly, and Christopher Witko, “Tom Perkins Is Winning: The Rich Already Vote More,” Talking Points Memo, February 26, 2014, available at https://talkingpointsmemo.com/cafe/tom-perkins-is-winning-the-rich-already-vote-more.
96. William W. Franko, “Political Inequality and State Policy Adoption: Predatory Lending, Children’s Health Care, and Minimum Wage,” Poverty & Public Policy 5 (2013): 88–114.
97. James Avery and Mark Peffley, “Voter Registration Requirements, Voter Turnout, and Welfare Eligibility Policy: Class Bias Matters,” State Politics & Policy Quarterly 5 (2005): 47–67.
98. Martin Gilens and Benjamin I. Page, “Testing Theories of American Politics: Elites, Interest Groups, and Average Citizens,” Perspectives on Politics 12 (3) (2014): 564–581.
99. Larry M. Bartels, Unequal Democracy: The Political Economy of the New Gilded Age (Princeton, NJ: Princeton University Press, 2008), p. 285.
100. See, e.g., Peter K. Enns and others, “The power of economic interests and the congressional economic policy agenda.” Working Paper (Washington Center for Equitable Growth, 2016); Nicholas Carnes, “Keeping workers off the ballot: Electoral gatekeepers and the shortage of candidates from the working class.” Working Paper (Washington Center for Equitable Growth, 2016); Brian Libgober and Daniel Carpenter, “Lobbying with Lawyers: Financial Market Evidence for Banks’ Influence on Rulemaking.” Working Paper (Washington Center for Equitable Growth, 2016).
101. Armin Schäfer and Hanna Schwander, “‘Don’t play if you can’t win’: does economic inequality undermine political equality?” European Political Science Review 11 (3) (2019): 395–413.
102. Ibid. See also Vincent A. Mahler, “Electoral turnout and income redistribution by the state: A cross‐national analysis of the developed democracies,” European Journal of Political Research 47 (2008): 161–183, finding the correlation between Gini coefficients in 13 OECD countries in the late 1990s and aggregate voter turnout is 0.81.
103. Laura Williamson and Amshula K. Jayaram, “Universal Voter Registration: Eliminating One of the Biggest Barriers to Voting” (New York: Demos, 2020).
104. Jen Kirby, “How to fix America’s voter registration system so more people can vote,” Vox, October 7, 2020, available at https://www.vox.com/21492380/elections-vote-register-same-day-automatic.
105. For the People Act of 2019, H.R.1/S.949, 116 Cong. 1 sess. (Government Printing Office, 2019); For the People Act of 2021, H.R.1, 117 Cong. 1 sess. (Government Printing Office, 2021).
106. Elizabeth Rigby and Melanie J. Springer, “Does Electoral Reform Increase (or Decrease) Political Equality?” Political Research Quarterly 64 (2) (2011): 420–434.
107. J. Mijin Cha and Liz Kennedy, “Millions to the Polls: Same Day Registration” (New York: Demos, 2014); “Same Day Voter Registration,” available at https://www.ncsl.org/research/elections-and-campaigns/same-day-registration.aspx (last accessed November 2020).
108. Rigby and Springer, “Does Electoral Reform Increase (or Decrease) Political Equality?”
109. Jamila Michener, “Race, Poverty, and the Redistribution of Voting Rights,” Poverty & Public Policy 8 (2016): 106–128.
110. U.S. Commission on Civil Rights, “Briefing Report: Increasing Compliance with Section 7 of the National Voter Registration Act” (2016).
111. Cha and Kennedy, “Millions to the Polls: National Voter Registration Act & Expansion.”
112. Jeremy Bearer-Friend and Vanessa Williamson, “Tax-Time Voter Registration,” Tax Notes 103 (2020): 1013–1017.
113. Ibid.
114. For the People Act of 2021.
115. Ibid.
116. Voting Access Act, H.R.6183, 116 Cong. 2 sess. (Government Printing Office, 2020).
117. Sendhil Mullainathan, “For Racial Justice, Employees Need Paid Hours Off for Voting,” The New York Times, June 12, 2020, available at https://www.nytimes.com/2020/06/12/business/for-racial-justice-employees-need-paid-hours-off-for-voting.html, arguing that employers should voluntarily proivde their workers 4 hours of paid time off to vote on Election Day.
118. For the People Act of 2021.
119. Jean Lacroix, “Ballots instead of Bullets? The effect of the Voting Rights Act on political violence.” Working Paper 20-007 (Universite Libre de Bruxelles Centre Emile Bernheim, 2020); Jean Lacroix, “Violence in the US: What we can learn from the 1965 Voting Rights Act,” Vox EU CEPR, June 27 2020, available at https://voxeu.org/article/violence-us-lessons-1965-voting-rights-act.
120. U.S. Commission on Civil Rights, “2018 Statutory enforcement Report: An Assessment of Minority Voting Rights Access in the United States” (2018).
121. Wendy Weiser and Alicia Bannon, eds., “Solutons 2018: An Election Agenda for Candidates, Activists, and Legislators” (New York: Brennan Center for Justice, 2018).
122. There have been two different versions, the Voting Rights Amendment Act and the Voting Rights Advancement Act, the latter of which was recently renamed the John Lewis Voting Rights Advancement Act. Voting Rights Amendment Act of 2019, H.R.1799, 116 Cong. 1 sess. (Government Printing Office, 2019; Voting Rights Advancement Act of 2019, H.R.4/S.561, 116 Cong. 1 sess. (Government Printing Office, 2019); John Lewis Voting Rights Advancement Act of 2019, S.4263, 116 Cong. 2 sess. (Government Printing Office, 2020).
123. Native American Voting Rights Act, H.R.1694/S.739, 116 Cong. 1 sess. (Government Printing Office, 2020).
124. Lee Drutman and Charlotte Hill, “America Needs a Federal Elections Agency” (Washington: New America, 2020).
125. “What the Postal Service Crisis Means for the November Election,” available at https://www.brennancenter.org/our-work/research-reports/what-postal-service-crisis-means-november-election (last accessed November 2020).
126. For a summary, see “Preparing Your State for an Election Under Pandemic Conditions,” available at https://www.brennancenter.org/our-work/research-reports/preparing-your-state-election-under-pandemic-conditions (last accessed November 2020).
127. Adam J. Berinsky, Nancy Burns, and Michael W. Traugott, “Who Votes by Mail?: A Dynamic Model of the Individual-Level Consequences of Voting-by-Mail Systems,” Public Opinion Quarterly 65 (2) (2001): 178–197; Rigby and Springer, “Does Electoral Reform Increase (or Decrease) Political Equality?”; Elizabeth Rigby, “Do Election Reforms Promote Equal Participation?” Scholars Strategy Network Key Findings, April 1, 2012, available at https://scholars.org/contribution/do-election-reforms-promote-equal-participation.
128. Charlotte Hill and others, “We Should Never Have to Vote in Person Again,” The New York Times, May 4, 2020, available at https://www.nytimes.com/2020/05/04/opinion/coronavirus-vote-by-mail.html, linking to a self-published draft working paper titled “All-Mail Voting in Colorado Increases Turnout and Reduces Turnout Inequality.”
129. Williamson, “Universally Accessible and Racially Equitable Vote By Mail.”