Rebuilding trust and capacity by measuring what everyday Americans care about
Key Takeaways
- The federal economic statistical system is under-resourced and is under attack by the Trump administration. Both forces are threatening the quality of gathered data and undermining the American public’s trust in economic statistics. Trust fell from 57 percent to 50 percent in just eight months between June 2025 and February 2026.
- Restoring the capacity of the main federal statistical agencies is necessary but insufficient. Restoring trust means responding to the economic concerns of the American public. Policymakers should adopt an economic statistical agenda that responds to current concerns in economic discourse.
- An economic statistical agenda is a set of priorities for which economic statistics should be reported. Historically, policymakers with strong statistical agendas have succeeded in changing economic discourse and enshrining their policy priorities.
- Such an agenda is relatively easy for a president to pursue, sometimes without the help of the U.S. Congress, and requires only modest budget investments, which would increase U.S. economic competitiveness by boosting the efficiency of private markets and guiding good economic policymaking.
- This report suggests two priorities for an economic statistical agenda. The first is a timely, integrated system of income, consumption, and wealth statistics that can settle debates over the rise of the so-called K-shaped economy that favors the wealthy, as well as the genesis of the “vibecession,” or economic dissatisfaction that Americans can feel but not see in federal statistics. The second is new measures of affordability that capture inflation inequality and the so-called poverty premium that low-income households pay for the same goods.
- More timely and disaggregated statistical data would also enable policymakers to see the developing risks of artificial intelligence and manage those risks.
- A president can begin most of this work without Congress. Statistical policy directives, agency budget requests, and the chief statistician’s authority at the White House Office of Management and Budget are sufficient to launch this agenda. Legislation would accelerate it and provide necessary resources.
- What this means for growth: Federal economic statistics are vital to the efficient functioning of private markets. Research shows that trustworthy federal statistics contribute to economic growth, benefit small businesses, and help people find better job matches.
Overview

This report argues that policymakers in the next presidential administration should adopt an economic statistical agenda to save an essential statistical system that is imperiled by decades of neglect and the current political environment. Federal economic statistics are a critical component of the U.S. economy. Yet even prior to the second Trump administration, statistical agencies were already under threat1 from declining survey response rates, stagnant funding, and falling staff levels.
These problems have been sharpened during the second Trump administration2 due to budget cuts, staff reductions in force, the elimination of advisory boards, and incoherent statistical directives.3 Exacerbating the problems are politically motivated moves by the administration, such as publishing a partisan think tank report on the U.S. Census Bureau’s website,4 removing language from the U.S. Department of Commerce’s scientific integrity policy5 and firing the commissioner of the U.S. Bureau of Labor Statistics, Erika McEntarfer.
These are alarming interventions into the economic statistical system that threaten its ability to provide the accurate and impartial data that guide households, businesses, policymakers, and national economic discourse. The American Statistical Association makes the case for bold action to modernize the statistical system6 and make it more resistant to future political interference. That work is essential and should be adopted.
But policymakers should also set priorities. Even if the existing economic statistical system is fully funded, it may still fail to tell Americans what they most want to know about the U.S. economy. Understanding the needs of households and businesses and setting compelling statistical priorities based on that analysis is the duty of elected officials and an important way to guide and motivate the federal statistical system.
This report argues that in addition to modernizing statistical infrastructure and safeguarding the system from political manipulation, policymakers should adopt an economic statistical agenda that responds to the current economic environment. In the pages that follow, I will first explain what a comprehensive statistical agenda is and the many benefits it can provide to our economy and our society. I’ll then explain why a statistical agenda is not a call for interference in data-gathering but rather a way for policymakers to set their policy priorities based on much more detailed and disaggregated data to capture how everyday Americans experiencing economic growth.
I will then turn to the specific recommendations for building this new statistical system to address current economic debates and rebuild trust. These recommendations would build a timely, integrated system of income, consumption, and wealth statistics that can settle big and ongoing policy debates over how everyday U.S. households experience the U.S. economy and capture the effects of inflation inequality on low-income households.
The next presidential administration can begin most of this work without Congress. Statistical policy directives, agency budget requests, and the chief statistician’s authority at the White House Office of Management and Budget are sufficient to launch this agenda. More timely and disaggregated statistical data would also enable policymakers to see the developing risks of artificial intelligence and manage those risks. In sum, this new generation of statistics would let U.S. businesses see which customer segments are weakening, would let households evaluate how the U.S. economy is working for them and others like them, and would let policymakers see where economic pressure is building while there is still time to respond.
What is an economic statistical agenda and what are its benefits?
Policymakers often view federal statistical agencies as the arcane technocratic plumbing of bureaucracy, incidental to their governing goals. In doing so, they are missing an opportunity. Historically, both the executive and legislative branches of the federal government have been stewards of our national economic statistics. Both have the power and responsibility to ensure that federal economic statistics are responsive to the needs of the public and businesses and that they maintain high standards for integrity and impartiality.
An economic statistical agenda is a set of priorities for what the federal government should measure. It is, importantly, not a template for how anything should be measured, which is the responsibility of professionals in the statistical agencies.
This report focuses on the positive case for the next presidential administration and members of Congress to take control of this endangered system and re-imagine it for the 21st century. Implementing the statistical agenda described in this report would be affordable relative to the overall size of the federal budget, would powerfully influence future economic debates, and would become the basis of a durable economic legacy for policymakers who take up this charge. Reviewing the history of some of our most notable economic statistics demonstrates the benefits.
A brief history of the power of an economic statistical agenda
Sixty years ago, the administration of President Lyndon B. Johnson started using U.S. Census Bureau data to track a new economic metric, the poverty threshold. For the Johnson administration, it served two functions. First, the new metric would monitor the progress of President Johnson’s “unconditional war on poverty.7”And second, it would identify which families most needed help and should be eligible for anti-poverty programs.
The poverty threshold was invented entirely within the executive branch and could have easily died at the end of the Johnson administration in 1968. The poverty threshold metric was not included in laws passed during Johnson’s presidency. Tellingly, the Food Stamp Act of 1964 left determinations of eligibility entirely to states.8 It wasn’t until 1977, long after Johnson left office, that Congress made amendments to the act9 that made eligibility dependent on the poverty threshold. The poverty threshold was added to the National School Lunch Act as an amendment in 1970.
Despite its fragility at the end of Johnson’s presidency, rather than withering, the poverty threshold blossomed in importance and became an enduring legacy of his administration. It succeeded because it was a national standard that policymakers could call on when programs were transitioned from discretionary state-run programs to national entitlements in the 1970s. It even survived President Richard Nixon, who once called Johnson’s signature poverty initiatives “a cruel hoax.”10 An increase in poverty during Nixon’s term led to an effort to try to re-brand it as a “low-income” threshold, but these efforts ultimately failed.1112
There was little political influence over the initial establishment of the poverty threshold. The Johnson administration needed a metric and, by coincidence, an economist at the Social Security Administration named Mollie Orshansky had recently developed two poverty thresholds for her research on the impact of poverty on children.13 The Johnson administration took the lower one, under the rationale that they wanted to target those most in need. Johnson had used estimates of the number of people in poverty calculated by his White House Council of Economic Advisors in speeches, but when it came time to choose an official metric, the administration tapped an agency researcher, signaling a deference to impartial expertise.
The poverty threshold has been incredibly resistant to political challenges. Today, dozens of federal programs are conditioned on the poverty threshold and the percentage of families living below the poverty threshold is frequently invoked in public discourse. The September release of the Census Bureau’s Income and Poverty report creates an annual media cycle focused on poverty in the United States. The one-week period starting with the release of Census’s report corresponds to a 70 percent spike in mentions of poverty in U.S. print media.14
The U.S. poverty line was a landmark in economic statistics. The United States was among the first countries to adopt an official poverty measure. The Official Poverty Measure has faded in prominence in recent years but even this is a testament to its prominent position in economic statistics: it was supplanted by the Supplemental Poverty Measure,15 developed during the administration of president Barack Obama based on expert recommendations for updating the official threshold.
Congress has also wielded its power to steer economic statistics. The best example of this is also one of the most important economic statistical developments in history. In 1932, Senator Robert La Follette Jr. of Wisconsin introduced a resolution16 charging the Department of Commerce with the production of estimates of National Income. Members of Congress were responding directly to the dire economic circumstances of the Great Depression,17 An estimate of National Income would indicate what the U.S. economy had lost since the start of the deep and prolonged economic downturn in 1929 and what would be required to rebuild it going forward.
These estimates, produced as a joint venture of the U.S. Department of Commerce and the National Bureau of Economic Research, were the first set of comprehensive and official national income estimates for the United States. President Franklin D. Roosevelt immediately grasped the import of this new data series and integrated the estimates into his 1936 campaign speeches18to promote his New Deal policies.
Eventually, this work led to the National Income and Product Accounts and the reporting of statistical economic aggregates such as Gross National Product and Gross Domestic Product. The latter is now the most well-known and influential economic statistic reported by the government.
Statistical measurements directly impact policy outcomes
It’s no surprise that the poverty threshold has been so successful. Researchers have found that what we measure as a nation, or what we don’t measure, can have powerful shaping effects on political discourse. Sociologist Daniel Hirschman at Cornell University, studying the history of inequality statistics, shows that for decades the top 1 percent’s rising share of income was largely invisible in policy debate19 because existing household surveys couldn’t reliably capture the very top of the income distribution.
So when economists Thomas Piketty at the Paris School of Economics and Emmanuel Saez at the University of California, Berkeley instead built income statistics from IRS tax records,20 they made visible a concentration of income that the prior statistical infrastructure simply couldn’t see. Their new frame, “the 1 percent,” went on to become the defining frame of inequality politics, from President Obama’s economic rhetoric21 to Occupy Wall Street’s “We are the 99 percent.”22
Gross Domestic Product, probably the most instantly recognizable economic statistic in the United States or anywhere, has been similarly impactful. GDP, and the subsequent fixation on growth in GDP as a proxy for just about everything in our economic lives, has powerfully shaped economic policy and debate. Political scientists find that media coverage of the economy is more positive when income inequality is increasing, and that this association is primarily caused by the prominence of Gross Domestic Product23 in economic discourse because GDP growth tends to track the economic benefits that accrue to the wealthy.
Despite the consistent underfunding and benign neglect of statistical agencies, most policymakers seem to intuitively understand how powerful their outputs can be. President Obama pushed for the creation of the Supplemental Poverty Measure. President Joe Biden belatedly attempted to establish environmental statistical accounts.24 And President Trump has attempted to change the decennial Census to identify undocumented immigrants and remove questions about race.25
What we measure doesn’t just impact economic narratives but also can have powerful impacts on policymaking. The poverty threshold has been influencing policy debates for decades, but a concrete and more recent example are overdraft fees. In 2015, banks were required to break out revenue obtained from customer fees for the first time, when the Federal Financial Institutions Examination Council revised reporting requirements at the behest of the Consumer Financial Protection Bureau. Within five years these fees began to fall quickly26 as the media picked up on the CFPB-reported numbers and wrote critical stories, the agency pressured banks to reduce fees, and new banks competed with existing banks specifically on reduced fees. The simple act of collecting the data brought about a significant improvement for consumers.
An agenda for statistics is not interference in statistics
It’s important to make a distinction between political actors trying to influence the content of economic statistics and pursuing an agenda for economic statistics. The former is a significant concern right now, epitomized by the Trump administration firing the Commissioner of the U.S. Bureau of Labor Statistics, Erika McEntarfer,27 and trying to install an unqualified replacement as well as a more recent decision to publish a partisan think tank report as a U.S. Census Bureau product.28 Political actors should not delay statistics, influence statistical methodology, or install unqualified political leadership at statistical agencies.
Advocates for economic statistics frequently, and rightly, invoke the principle of professional autonomy29 for employees at statistical agencies. That is, the methodological choices made in the construction of official statistics should be entirely in the hands of skilled and nonpartisan staff. But this should not deter policymakers from pursuing an economic statistical agenda. It is entirely appropriate for a president or Congress to ask agencies to produce new statistical series or research the potential for improvement to existing statistical series.
The principle of professional autonomy is critical for maintaining trust in federal statistics. President Trump’s incursions on professional autonomy are probably the most important factor in declining trust. The agenda outlined in the next section of this report is strictly about leading the agencies to focus their efforts on pressing economic challenges, without directing the methodological content of their work or interfering with existing data production.
Economic statistics are vital to economic growth and competitiveness
A key reason to prioritize the federal economic statistical system is that federal economic statistics are vital to the efficient functioning of private markets. Households rely on them to make decisions about where to live and what to study, while businesses rely on federal statistics to make critical investment decisions.
Statistical releases trigger massive moves in financial markets,30 and recent research estimates that for each dollar spent on the budget of the Bureau of Labor Statistics, $25 are generated by the U.S. economy, which is attributed specifically to the marginal value of public trust in federal data.31 Businesses make better investment decisions when economic statistics are timely, especially small businesses, which cannot draw on alternative data sources.32 A Commerce Department analysis finds that industries that are highly reliant on government data almost doubled in revenue between 2012 and 2022,33 outpacing GDP growth by about 50 percent, demonstrating that the modern U.S. economy is becoming more reliant on government statistical production.
While it’s difficult to study the direct impact of economic statistics on growth in modern, industrialized economies where economic statistics are ubiquitous and credible, research in developing countries suggests that timely and credible national economic data can have a significant impact on growth.34 Researchers at the World Bank found that improving statistical capacity had a larger impact on income per capita in developing economies than comparable improvements in trade openness.
Federal economic statistics also help people find better jobs. When median earnings data was added to the College Scorecard, for example, students were more likely to send their SAT scores to schools with better reported earnings 10 years after students graduated.35 Additionally, job seekers who are provided with job market data broaden their searches and get more interviews.36 And long-term unemployed workers seeking employment are more likely to find jobs37 when provided with more job-search information.
Although the United States arguably pioneered the creation of modern economic statistics in the 20th century, our nation’s statistical infrastructure is falling behind as some nations create truly modern systems with integrated administrative data, threatening U.S. economic competitiveness.38
An economic statistical agenda will deliver a powerful and durable legacy, and is relatively easy to implement
Despite the importance of economic statistics to the U.S. economy and the potential to privilege policymakers’ economic agendas in policy discourses, presidents and members of Congress seldom enter office with an agenda for economic statistics. That’s a mistake. Government production of economic statistics is currently at an inflection point, and policymakers have an opportunity to shape what comes next.
We have already outlined two reasons that pursuing an economic statistical agenda is important. First, as with the poverty threshold and GDP metric, presidents and members of Congress can use the creation of new economic statistics to change economic discourse and enshrine their own policy preferences in public discourse for decades after their terms of office are over. The statistics the federal government tracks determine policymaking priorities. Second, federal economic statistics are vital to the efficient functioning of private markets and can increase U.S. economic competitiveness, support small businesses, and improve market efficiency.
Clearly, an economic statistical agenda can lead to significant benefits. On top of these benefits, there are compelling practical reasons to pursue a statistical agenda. First, both the president and members of Congress have broad authority to pursue an economic statistical agenda. The president can use statistical policy directives,39 while Congress can direct agencies with legislation.
Second, economic statistics is an area where policymakers can affect significant change with little need for significant budget appropriations. Where increased budgets are necessary, the needs will be modest. Economic statistics are relatively inexpensive; the combined budgets of the U.S. Department of Labor’s Bureau of Labor Statistics and the U.S. Department of Commerce’s Bureau of Economic Analysis and U.S. Census Bureau amount to just $3 billion a year on average, a tiny fraction of the federal budget.40 Significant infrastructure improvements can be made for spending on the order of $100 million.
Federal statistics are often overlooked, even though they deliver incredible benefits to the country with only modest fiscal investment.41 This report makes the case that there are powerful political and economic benefits the next presidential administration can unlock if it is willing to prioritize and execute an ambitious statistical agenda.
Characteristics of an impactful economic statistic
What makes Gross Domestic Product so influential? Many of the answers to this question are under the direct control of federal statistical agencies. The GDP metric is issued every quarter on a stable schedule, with revisions coming every month. This frequent release schedule means GDP is frequently in the news cycle.
Additionally, estimates of GDP growth are released on a low lag. Estimates of quarterly growth are released less than a month after the end of the quarter, and the first estimate of annual growth is likewise released less than a month after the end of the year, ensuring that these releases are timely and newsworthy. Finally, estimates are released as part of a major embargoed agency news release that indicates the importance of the data series to observers.
If a new data series is to garner attention and impact economic narratives, it should share these same features. Regular and predictable releases, short time lags between the close of a time period and estimates for that period, and prominent promotion by the agency are all essential features for capturing the attention of the media and the public. This, in turn, assures the durability of new statistics. When media and other analysts use statistics to create economic narratives, it creates a robust constituency for their continued collection.
A statistical agenda to address current economic debates and rebuild public trust
The federal economic statistical infrastructure is currently at a crossroads. The availability of administrative data—data collected by government agencies or private-sector organizations during the course of their operations—could be transformative, both in producing statistics and reducing the burden of federal surveys for businesses and households. Against this backdrop, users of economic statistics are demanding more timely and more granular statistics. The United States has an opportunity, with investments in our nation’s statistical infrastructure, to develop a statistical system for the 21st century that integrates different data sources and provides relevant and frequently updated economic intelligence.
In the chaos of the COVID-19 pandemic of 2020–2023, there was little economic intelligence to help people make sense of the U.S. economy. Private and academic researchers used nontraditional data sources to fill the gap.42 There are pitfalls to this kind of ad hoc data creation for crises, and official statistics that are representative of the population and regularly collected and published are a preferable solution.
Simultaneously, popular discourse around the U.S. economy has become fixated on concepts that we struggle to measure. The so called “vibecession,” where hard economic data is no longer doing a good job of predicting people’s subjective ratings of the economy,43 has puzzled economic observers. This disconnect may in turn cause people to lose trust in economic statistics that don’t appear to reflect their subjective opinions. Trust in federal statistics slipped from 57 percent in June of 2025 to 51 percent in September of 2026, according to the AmeriSpeak survey.44
Moreover, improper interference by the Trump administration may have been a key cause of this reduction in public trust, yet a properly executed agenda for economic statistics can help restore it. A statistical agenda demonstrates to voters that policymakers are taking a proactive approach to righting the ship, and targeting data that captures the forces behind the vibecession shows the public that policymakers are responsive to economic frustrations that are not reflected in the hard data. People who use and interact with federal statistics have much higher levels of trust in federal agencies, around 80 percent vs 50 percent in the general population.45
In other areas of economic discourse, our existing statistical infrastructure simply doesn’t provide recent enough data or disaggregated data that is necessary to adjudicate conflicting claims. There has been considerable interest, for example, in the so called “K-shaped recovery,”46 a recently coined term to describe an economic recovery where the rich pull ahead of other households. Business economists in particular are interested in the extent to which consumption may be shifting toward higher income households.47 But the federal statistical system provides little to no insight into this phenomenon. Although the Bureau of Labor Statistics has experimental statistics tracking the distribution of consumption, the most recent vintage only tracks consumption through 2023.48
Finally, the advent of artificial intelligence will lead to significant changes in the U.S. economy. Members of Congress are already asking statistical agencies49 to build the tools to track these changes. The agencies may struggle to adequately respond to these requests unless policymakers provide them with guidance and resources.
There are many areas that policymakers could target as part of an economic statistical agenda. Based on the needs identified above, we survey areas where policymakers can make significant and lasting contributions to our economic discourse. Specifically, this report proposes two areas where policymakers could make important contributions by:
- Demystifying the K-shaped discourse, responding to the vibecession, preparing for an AI-led disruption of the labor market, and better reflecting diversity in household economic experiences by developing an integrated system of timely and granular income, consumption, and wealth statistics
- Addressing persistent public concerns over affordability by considering inequality in inflation statistics and trying to better understand how financial innovations such as “Buy Now, Pay Later” lines of credit are impacting households by studying the various sources of the poverty premium and measuring its size
The remainder of this report discusses new statistics in these two areas and makes policy recommendations for the next presidential administration and members of Congress. We discuss the possible benefits of each set of statistics, the resources necessary for implementing new statistics, and possible pitfalls.
There are many needs in the statistical system and few resources to accomplish them. Historically, the most significant impediment to improving federal statistics has been flat or declining annual appropriations to the three key statistical agencies. This report ballparks the costs of each of our proposed reforms because policymakers have a great many urgent priorities and limited resources to address them. Statistical agencies are currently very thinly staffed. This report does not suggest requiring any new reporting from agencies without appropriate budget increases. The estimated costs are necessarily ballparks, as the statistical agencies generally have not provided firm figures for most of these efforts.
Timely measurement of inequality in income, consumption, and wealth
Debates about the vibecession, the K-shaped economy, and the impact of AI are all greatly hindered by a patchy understanding of what resources U.S. households can draw on to weather shifting economic winds. While our nation’s statistical agencies monitor concepts such as aggregate changes in wages relatively well, the actual distribution of those changes is measured less frequently and on longer lags, which is unfortunate because better and more timely data could detail whether wage gains, for example, are primarily concentrated among low-, middle-, or high-income households in real-time.
The nature and distribution of U.S. household wealth is measured just once every three years by the Federal Reserve Board in its Survey of Consumer Finances and is released nearly a year after the survey is complete. Income is measured once a year by the U.S. Census Bureau in its Annual Social and Economic Supplement to the Current Population Survey and reported in September of the following year, with a distribution of income reported by the Bureau of Economic Analysis the following December. Lags in consumption are similar, and current methods of measuring consumption have known data quality issues.50
Strengthening the measurement of these three concepts addresses virtually all the statistical needs identified in the first section of this report. Timely, distributed income data will help track the progression of AI adoption in the U.S. labor force. Timely, distributed consumption data will essentially end debate on the K-shaped economy by tracking exactly which consumers are struggling. Timely, distributed wealth data will help detail the extent to which households are cushioned against an economic downturn.
An integrated system of income, consumption, and wealth statistics is the goal of a 2024 National Academies of Sciences51 report focused on the distribution of economic resources among households in the United States. The system envisioned by the NAS report will greatly improve our ability to track economic inequality and household resilience in the face of a changing economy.
What specifically needs to be measured?
The proximate goal is to create timely joint estimates of income, consumption, and wealth for deciles across the distribution of U.S. households, with pullouts for the top 1 percent of households. Estimates would be annual and lag by no more than one year. Future iterations could explore distributing these concepts by demographics or by geography, improving timeliness further, and improving the anonymized household-level records (commonly referred to as microdata) on these distributions accessible to researchers inside of government and outside in academia.
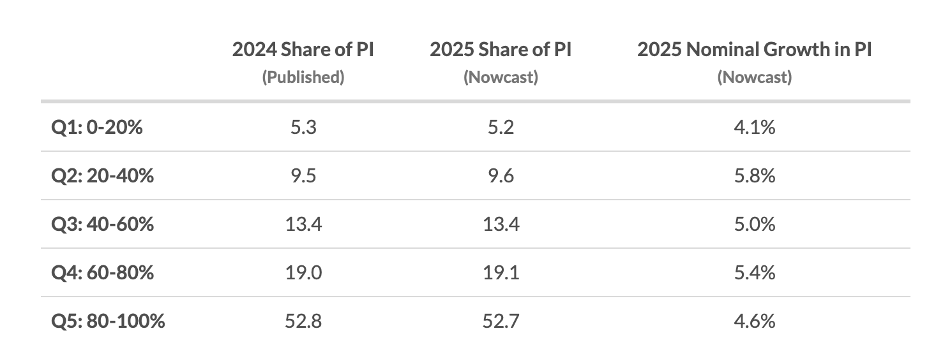
The first, basic benefit would be a new understanding of how the U.S. economy is performing for different households across the economy. Consider the Bureau of Economic Analysis’s nowcast of growth in Personal Income,52 which was first published in 2025. For just short of a century, policymakers have had to rely on aggregates for economic growth,53 which only detailed how much the economy grew as a whole. But different households experience the economy differently. The BEA’s National Nowcast shows that nominal growth varied considerably between quintiles of households, with the lowest income households seeing growth of around 4 percent, while households in the broad middle all saw income growth above 5 percent. (See Table 1.)
Table 1
Measuring how U.S. economic growth accrues to different U.S. households
The U.S. Bureau of Economic Analysis’s 2026 National Nowcast of growth in Personal Income, 2025
Similarly, the Distributional Financial Accounts, published by the Federal Reserve, provides insights into how wealth has grown for different types of households. These data show that the top 0.1 percent of households increased their wealth by more than 200 percent between 2000 and 2025, twice the rate of bottom 50 percent of households.54 This explosive growth allowed these households at the tippy top of the wealth distribution to increase their total share of household wealth by about 38 percent between 2000 and 2026.
A fully integrated system would unlock further benefits. It would enable the analysis of the joint distribution of income, consumption, and wealth. Consider some examples. Middle-income families might appear to have stable consumption yet could be financing that consumption by spending down accumulated wealth or using credit. Or take heirs to wealth who might seem poor in the income data, even though they are sitting on millions of dollars in wealth. Conversely, a young professional might seem rich in the income data category even though they are carrying crushing debts only visible in the wealth data.
This kind of connected thinking can be critical to assessing the U.S. economy. During the COVID-19 pandemic, for example, the savings of households became an intense topic of economic discourse as economists tried to predict55 if consumption would falter and lead to a recession.56 This is a difficult analytical question in our current system of unconnected statistics.
Now imagine a connected system, where each year the government issues a table showing, for each tenth of U.S. households by income, how consumption changed and whether their wealth rose or fell. This would demystify the pandemic savings debate completely, showing in near real-time how lower- and middle-income families saw their wealth swell due to government economic stimulus and then slowly drain away in the subsequent years.
This data is currently provided in a patchwork fashion and often on a considerable lag. The Bureau of Economic Analysis issues its Distribution of Personal Income statistics,57 which show how income is growing for households in each decile of income, plus additional detail for the top 1 percent of households. Detailed BEA data is released on about a one-year lag, although the Nowcast presented in Table 1 above provides data in January for the previous year.
The Distributional Financial Accounts,58 produced by the Federal Reserve, provide similar detail for wealth. The Bureau of Labor Statistics provides a distribution of consumption,59 although it is produced on a significant lag of about three years. Equitable Growth’s U.S. Inequality Tracker60 is built on these existing data sources.
All these data series are relatively new, and while each has strengths, they suffer from a lack of coordination. Ideally, definitions and units of measurement would be standardized, presentation of the data would be centralized, timeliness would be improved, and the datasets would be connected to produce the joint distribution of income, consumption, and wealth described here.
How would new statistics change economic discourse and economic policymaking?
Implementing this set of statistics would greatly raise the profile of inequality in economic discourse. Of the existing datasets discussed above, the most well-known and widely reported on is the Distributional Financial Accounts. The other two are relatively obscure, due to publication lags, lack of publicity from the agency, or their status as prototype data sets. Properly resourced and publicized, these series could greatly alter economic discourse.
The landmark Stiglitz-Sen-Fitoussi report on economic performance and social progress61 in 2009 highlighted the importance of understanding how economic resources are distributed, but in some sense the three authors—Joseph Stiglitz and Amartya Sen at Harvard University and the late Jean-Paul Fitoussi at the Institut d’études politiques de Paris—were merely restating an argument made by the Nobel laureate economist Simon Kuznets, the creator of Gross Domestic Product, in 1934. Kuznets observed that you cannot know the welfare of households in the economy62 with a single, aggregate yardstick like GDP. Distributional metrics are considerably overdue.
The lack of distributional metrics has had a negative impact on our economic discourse. The GDP metric has outsize power in economic discourse because of its long history, prominent release, and ease of international comparison. But political scientists have shown that because GDP tends to follow the fortunes of high-income households, and because journalists tend to follow GDP, the tone of economic journalism is most positive when economic inequality is increasing.63
In short, developing these statistics would greatly expand our knowledge of how the U.S. economy is working for different types of households, how households are changing their savings behaviors in response to economic headwinds, whether a booming economy is benefitting everyone or a narrower slice of households, and so on.
Having timely distributional metrics also would help solve economic puzzles that are currently intractable. Arguments over whether the current U.S. economy is K-shaped and to what degree are entirely downstream of the lack of timeliness in these metrics. For example, economists at Moody’s Analytics believe that consumption has shifted sharply towards upper-income households over the past five years. But many economists doubt these estimates,64 which are extrapolated from current data that may not be well suited to the task.
More recently, findings from private transaction data as well as new trends in official data have led to claims that the K-shaped economy is over, that the economy is now C-shaped,65 or that the economy is now a tilted K. These descriptive but exceedingly opaque definitions of the U.S. economic outcomes highlight why better data measurements are imperative for policymaking.
Additionally, this proposed new system would provide valuable intelligence on how the introduction of artificial intelligence is impacting the U.S. economy. There is little consensus on how AI might impact income and wealth inequality in the United States, but it’s clear that monitoring the impact of artificial intelligence on wages and income generally is important66 and a bipartisan group of legislators67 is keenly interested in better metrics for monitoring AI. A timely system of income and wealth statistics will expose who is benefitting most from a major technological shift and is sure to significantly inform debate over AI policies in the near future.
The vibecession debate also is, in part, a reflection of the current state of the data. Much of the discourse boils down to a belief that the aggregates are concealing stress in particular communities. A fully realized set of distributional statistics would allow analysts to compare households across the distribution but also across demographics such as age, race, and education.
Impact on business, policymakers, and households
In addition to their general impact on economic debate and discourse, a timely system of income, consumption, and wealth statistics would be useful to key consumers of economic statistics. Business economists have frequently requested more timely data on the distribution of income and consumption at federal statistical advisory panel meetings and other government and business forums. The need was especially acute in the early years of the COVID-19 crisis, when businesses wanted to understand which segments of their consumer base were most impacted by the economic shock.
The keen interest businesses have in this topic is demonstrated by the many,68 many,69 many70 analyses of the distribution of consumption or other concepts using private transactional data. This proliferation of analyses by financial institutions is itself an argument for better federal statistics. These institutions have access to transactional data from people’s credit cards that is not widely available to other actors in the economy. While large companies might have the resources to purchase this data, small businesses do not. Official economic statistics level the playing field71 and reduce information asymmetries, increasing market efficiency.
U.S. households with different incomes, wealth, and consumption patterns also would gain an important tool for holding their elected officials accountable. This suite of statistics gives the American public a reference point for how the economy is performing for people like them, not just the “average household,” giving them a new perspective on how federal economic policy impacts households with similar characteristics. Statistics that are more relevant to households up and down the distribution of economic resources could also boost household trust in the statistical system.
Researchers and policymakers would have access to a new resource for evaluating the business cycle, modeling the economy, predicting the revenue effects of tax policy, monitoring both intragenerational and intergenerational mobility, and much more. The National Academies of Sciences report has a good survey of the research applications72 starting on page 32 of that report.
In addition, state and local governments are an additional stakeholder that would benefit significantly from more granular data. Although adding geographic granularity to these statistics is among the more difficult ambitions a new presidential administration could pursue in this area, doing so would make the product broadly useful to state and local economic development and workforce development agencies, as evidenced by the research produced through the Bureau of Labor Statistics’ Wage Records Program.73
Actions for the next administration
The NAS report makes many recommendations for actions the statistical agencies and the White House Office of Management and Budget can pursue to iterate toward a complete set of statistics. Below is a summary of just some of the most significant proposals alongside some of my own recommendations to make short-term progress on the project:
- Direct the OMB’s chief statistician to issue a statistical policy directive establishing a coordinating group to create an integrated system of the distribution of income, consumption, and wealth inside the pilot of the National Secure Data Service at the National Science Foundation, which was authorized in the CHIPS and Science Act of 2022.
- Direct the chief statistician to set up a technical steering committee consisting of the Interagency Council on Statistical Policy, statistical agency economists, and researchers to advise the coordinating group.
- Task this coordinating entity with identifying bottlenecks that prevent greater timeliness in the production of income, consumption, and wealth data, and with resolving methodological questions posed in the National Academies of Sciences report.
- Direct the Bureau of Economic Analysis, the Bureau of Labor Statistics, and Census Bureau to jointly produce and publish an interim income, wealth, and consumption dataset using existing public microdata and statistical matching, where similar households are paired across surveys. Produce an initial joint report with headline statistics describing these distributions and establish an annual release pattern for future reports.
- Direct the Bureau of Labor Statistics to investigate incorporating electronic payment data into its Consumer Expenditure Survey and making other high-value modifications to the survey.
- Direct the Bureau of Economic Analysis and the Bureau of Labor Statistics to investigate possibilities for improving the data quality and the timeliness of the Distribution of Personal Income and the Distribution of Personal Consumption Expenditures datasets. Direct the Census Bureau to further develop the National Experimental Wellbeing Statistics.
- Direct the Bureau of Economic Analysis, the Bureau of Labor Statistics, and the Census Bureau to compare estimates of income and consumption across agencies and to reconcile income concepts and units of analysis.
- Encourage the Federal Reserve to consider an annual Survey of Consumer Finances, rather than triennial, to provide more up-to-date data on the distribution of wealth.
Actions for Congress
Congress can act before a new presidential administration takes office in 2028 to build political momentum for this project. Specifically, Congress could author legislation directing the three main federal statistical agencies to collaborate on a prototype dataset that merges existing survey data to create a joint distribution of income, consumption, and wealth.
To kick off such a collaboration, members of the appropriations committees in the House of Representatives and the Senate could launch an initial investigation of this question by the statistical agencies. One path would be to insert report language in the Financial Services and General Government appropriations bill directing OMB’s chief statistician to establish a coordinating group as detailed in the previous section. This group could establish the feasibility of an integrated system in a report back to Congress.
Finally, Congress can remove a key data barrier by co-sponsoring and working to advance legislation introduced by Rep. Donald Beyer (D-VA)74 that would make more administrative tax data available to the Bureau of Labor Statistics and Bureau of Economic Analysis.
Resourcing these new integrated statistical datasets
A future presidential administration should also direct each agency to estimate possible costs and produce appropriate budget requests for Congress to approve. The Office of Management and Budget should ensure that each agency breaks out budget detail for this project in their annual budget requests. Each agency should also ask for resources to add new full-time staff dedicated to this project.
There are versions of this project that range from modest to ambitious. The focus should be on creating an integrated system with harmonized data, a regular release schedule, and a data lag of no more than one year. Increasing timeliness could be a question of doing better modeling, as the Bureau of Economic Analysis did to create its Nowcast of the distribution of Personal Income growth on a one-year lag. This requires research but minimal budget commitments.
The most significant costs are those necessary to modernize surveys such as the Current Population Survey; BLS staff recently estimated this cost at $60 million annually75 and would include running a parallel survey to the current CPS data for comparison. It’s not clear from the estimate what ongoing costs would be after standing up the modernized survey.
Modernizing the Consumer Expenditure Survey may also be necessary. Altogether, these costs could run around $100 million in the short run, with higher costs up front and lower costs, perhaps in the range of $10 million to $30 million per year, once the surveys have transitioned. Modernizing these surveys would support a greatly improved statistical infrastructure that would benefit dozens of data series, including the affordability metrics discussed in the next section, which means the benefits of this spending are far broader than this specific proposal.
Then there’s the National Secure Data Service, which was given funding by Congress in the CHIPS and Science Act as a demonstration project. It is housed in the National Science Foundation, which is currently facing severe budget pressure of its own. The National Secure Data Service must be given a stable budget line and should become a permanent office within National Science Foundation. Congress is currently funding this office at around $9 million a year.
Finally, it is critical to assess funding at the IRS’s Statistics of Income division with the U.S. Department of the Treasury. For accurate and granular income distribution data, administrative tax data is likely necessary. The ability of the Statistics of Income division to package this data for other agencies will be a key data bottleneck. This IRS division is underfunded, and the Treasury Department should explore whether higher budgets could make data releases quicker. The annual budget for the IRS’s Statistics of Income division is just $40 million, so even modest appropriations could make a significant difference.
New metrics of affordability
Discussion of affordability has dominated economic discourse since inflation in the United States surged in 2021 and 2022, but the concept is often ill-defined. People who invoke it sometimes are referring to a small number of highly salient services, among them child care or health care. In other instances, it references housing, mortgage or interest costs generally, or price levels for high-salience goods such as groceries.
Regardless of the specific focus, a common theme in this debate is that standard measures of the price level such as the Consumer Price Index and other price indices are not fully capturing the cost-of-living pressures that households face. This belief, accurate or not, may be responsible for some of the loss of trust in official statistics. Affordability has dominated other concerns about the economy76 in polling, even as inflation dropped to nearly pre-pandemic levels prior to the Trump administration’s Iran war earlier this year.
Even if it’s unclear how important these expanded inflation measures might be right now, implementing them is both an investment in statistical infrastructure for the future and a signal that policymakers are taking constituents’ affordability concerns seriously. This section addresses two possibilities to provide more insight into affordability in the economy for different types of households.
First, existing price indices don’t address the different choices households make within product categories. This is a significant source of inflation inequality77 because households at different levels of income face different levels of inflation. Consumers may also face different levels of inflation due to their age and race.78 The Bureau of Labor Statistics currently publishes a by-quintile Consumer Price Index,79 but these indices differ from the official metric only in how they weight the consumption basket, and academic research has shown that the bigger differences are within product categories.80
A National Academies of Sciences report on modernizing the Consumer Price Index81 specifically advocates against spending more resources on this approach and states that developing metrics of inequality inflation “should be a high priority for BLS.”
Second, it is well-recognized that low-income households sometimes pay more than other households for the same product,82 whether because they must finance more purchases, face higher interest rates, are more likely to incur fees, can’t afford to buy in bulk, or pay higher insurance premiums. This is commonly referred to as the poverty tax or poverty premium. Relatively little is known about the total burden of this poverty premium, however, so this proposal is less shovel ready. But it is arguably more policy relevant as policymakers have recently become interested in reducing consumer costs exactly along these margins.
What are these new metrics of affordability?
Measures of inflation inequality are simple in theory. For each decile or possibly quintile of the income distribution, economists can use transaction data to look within product categories and see how consumer behavior varies across household incomes. The easiest place to do this is in groceries, which make up a significant portion of household budgets. Existing research establishes that differences in this category add up to create significant inequality in rates of inflation by income.83
Methods for incorporating scanner data collected by grocery stores into price indices are relatively mature. The primary barrier to integrating them into Consumer Price Index is the cost of buying private data. There are other categories of goods where this heterogeneity might also make a significant difference, such as durable goods and housing, where the research is not as advanced. Adjustments for heterogeneity in these categories could eventually be added but more research is likely required first.
A formal, government-backed metric of the poverty premium would attempt to quantify something that is completely absent from existing price indices: when households pay more than the sticker price of a good because they finance the cost or pay fees. Economists have already documented that the public is sensitive to this phenomenon. A 2024 paper found that rising interest rates after the pandemic could explain as much as three-quarters of the vibecession consumer sentiment gap.84
The Financial Health Network’s annual Spend Report documents growing reliance on some new financial product types that could impose high costs on low-income households. The most recent results indicate the problem for vulnerable households. The research found that financially vulnerable households spent 17 percent of their incomes on interest and fees in 2024,85 compared to just 1 percent for financially healthy households. The research also found that households are taking out more “Buy Now, Pay Later” loans and having more difficulty affording their payments.
An official metric would attempt to bring together these disparate strands and put hard numbers on the burden that different households face, distributed by income. An example of what this could look like is published by the University of Bristol’s Personal Finance Research Centre. Their report on the poverty premium finds that the average low-income household spent £38086 (about $520 as of this writing) on poverty premiums in 2026. Although the report doesn’t contextualize this number with a comparison to income, some back-of-the-napkin math suggests it represents about 2 percent of household income for this group.
In the United States, a recent report from The Century Foundation and Protect Borrowers finds that a large share of the rise in wages since 2022 is consumed by debt payments,87 and that people of color and households at the bottom of the income distribution are more adversely affected. They propose a new metric reporting household income after debt service is taken out.
The Bristol report takes an expansive view of what constitutes a poverty premium. This report now accounts for the increased costs that low-income households pay for groceries because they are more likely to shop at convenience stores rather than at large grocery stores they might have trouble getting to. There are several difficult choices to make about what should or should not be included in such a metric, and these decisions could be outsourced to the statistical agencies or the next administration could target particular types of costs.
How would it change economic discourse and economic policymaking?
Accurately documenting inflation inequality would demystify the vibecession and could build trust in federal statistics. While the difference between inflation for high- and low-income households in a single year is generally quite small, these differences can compound over time and become significant over several years.
Having reliable metrics of inflation inequality could dramatically alter how we think about inequality and the fortunes of low-income households. If inflation is higher for lower-income households, for example, then real wage increases after accounting for inflation for these households are lower than we currently report and wage inequality is increasing faster than economists believe. If this data had already existed, then the strident “income is stagnating”88 debate among policymakers and economists in the wake of the Great Recession of 2007–2009 might have looked very different. A 2019 study found that if inflation inequality was accounted for, 3 million more people would have been classified as living in poverty89 in 2018, and that real household income for the bottom 20 percent of households fell by more than 7 percent between 2004 and 2018.
Indeed, if inflation inequality is substantial then it could sharply alter many economic debates. But a note of caution is probably useful here: Should the Bureau of Labor Statistics take on this effort, historical data is not guaranteed. Buying historical data would be expensive and the coverage of historical data is more limited.
Better documentation of the poverty premium will lead to significant and important changes in economic discourse. When policymakers and journalists started to spotlight the harm caused by high overdraft fees, some banks started cutting back on these fees90 in advance of any federal policy action. The primary cause of the public attention that led to these adjustments was a change in 2015 in how banks report fees that allowed the Consumer Finance Protection Bureau to break out overdraft fee revenue for the first time.91 It’s a near perfect demonstration of the overarching thesis of this report: economic discourse caused real policy change purely via the collection of new data.
Impact on business, policymakers, and households
The primary benefit for U.S. households of better inflation measurements is simply the benefit of feeling seen by federal statistics. A common story since inflation moderated in mid-2023 is that households don’t feel, subjectively, that inflation has come down. Some attribute this to a longing for actual deflation, rather than low inflation.92 But it’s possible that inflation declined at different rates, and that certain segments of households are still facing above-trend inflation. This argument is common on social media, and metrics of inflation inequality would give us the tools to confront it.
Documenting inflation inequality comes with some risk for policymakers. They would learn more about the economic forces shaping their constituents’ views, but they might have few options for combatting observed inflation inequality. The Federal Reserve is our nation’s first line of defense against rising inflation, but there is no evidence that it can target inflation rates for low-income households separately from those for high-income households. In fact, the academic literature on the distributional impacts of monetary policy show that tighter monetary policy tends to increase income and consumption inequality.93
There are three primary mechanisms that have been proposed to explain inflation inequality. First, work by economist Xavier Jaravel (currently a professor at the London School of Economics) suggests that income inequality itself drives inflation inequality, because it leads to more competition in product segments that target high-income households,94 which reduces prices. Second, economists Alberto Cavallo and Oleksiy Kryvtsov at Harvard Business School suggest that cheaper goods face higher inflation because consumers substitute toward cheaper goods with thinner margins during periods of inflation,95 forcing retailers to pass increased costs on faster. Third, economist Kunal Sangani at Columbia Business School proposes that cheaper product inflation occurs in part because increasing costs of production tend to come in the form of similar absolute price increases for all goods,96 and those price increases are a larger percentage of the cost of cheaper goods. For instance, it costs the same to ship budget and luxury goods, adding a larger percentage price premium to budget goods.
These various mechanisms for inflation inequality suggest that policymakers will have to directly address income inequality or target supply-side cost increases, as the Biden administration did97 in the wake of the snarled supply chains amid the COVID-19 pandemic, to address inflation inequality.
New data on the poverty premium will be enormously useful to policymakers. They are already showing a keen interest in the poverty premium even without strong documenting data. Concern over the high interest rates of predatory payday lenders in the early 2000s led to state regulations that essentially shut down this industry in many states.98 Along these same lines, the Consumer Financial Protection Bureau issued a rule to protect consumers from hidden fees in the prepaid card market,99 and during the Biden administration the agency acted to protect low-income households from expensive overdraft fees,100 although a Republican-led Congress overturned this rule in 2025. More recently, New York City Mayor Zohram Mamdani has announced rules to crack down on hidden fees facing consumers.101
In this case, policymaking has actually run ahead of measurement of the phenomenon. Policymakers tend to invoke broad aggregates when they discuss these problems, but the statistical agencies could provide more useful measures of how particular products, among them rent-to-own or buy now, pay later lines of credit, impact households at the bottom, middle, and top of the income distribution.
Documenting the poverty premium carefully would also directly aid U.S. households in avoiding predatory financial products and could significantly increase financial literacy for low-income households. Some businesses could benefit, too. Reporting requirements for overdraft fees shined a spotlight on a tactic used by large, established banks that customers hated. FinTech startups such as Chime took advantage of this environment to build overdraft fee alternatives102 to appeal to customers who were radicalized against overdraft fees in part because of economic discourse around them.
Actions for the next administration
If the next administration prioritizes inflation inequality, then it could immediately take action to accelerate the development of such metrics at the Bureau of Labor Statistics. Specifically, the incoming administration could direct the agency to:
- Identify a preferred strategy for obtaining transaction data and estimate costs of that strategy, and include these costs in its budget request to Congress
- Study which categories of goods outside of packaged consumer goods, such as real estate, could also benefit from methods for disaggregating within categories
- Examine the feasibility of adopting the methodology of the RESET project103 to construct inflation metrics from scanner data
- Publish initial estimates of inflation inequality within two years and direct them to take steps to transition this initial product into a regular release
- Request an appropriate budget increase and increase full-time staffing
In addition, the new administration could direct the General Services Administration, with the help of the Office of Management and Budget and its chief statistician, to establish a government-wide purchasing vehicle for commercial data used in official statistics. This would allow the three federal statistical agencies to access scanner data and other data at lower prices.
The state of poverty premium research in the United States is relatively undeveloped, but there are concrete deliverables that policymakers can ask for while further research is conducted. The Bureau of Labor Statistics already has the means to analyze spending on interest and fees using its Consumer Expenditure Survey. Additionally, the Federal Reserve could explore creating a timely series of the distribution of debt service as a percent of income, something that it currently only provides triennially with the Survey of Consumer Finances.104 To move further in this direction, the new administration could ask the Bureau of Labor Statistics to:
- Publish an annual estimate of household spending on interest and fees as a share of income, by income decile, using the Consumer Expenditure Survey
- Research various aspects of the poverty premium, including which are most significant for low-income households and which are most tractable for data collection and presentation
- Examine different methods for gathering data on the poverty premium, primarily by researching the possibility of adding questions to surveys that could help measure the poverty premium and the possibility of directly merging transaction data with loan agreements that might be tied to those transactions
- Issue a preliminary report within 1 year that addresses both the above questions
In addition, the new administration could encourage the Federal Reserve to report out a distribution of the ratio of debt payments to family income on a timelier basis, using methods similar to those used to construct the Distributional Financial Accounts.
Actions for Congress
Congress can help the three statistical agencies build the necessary data infrastructure to analyze inflation inequality and can mandate research into the poverty tax. Specifically, Congress could author legislation that compels retailers above a threshold size to share scanner data with the economic statistical agencies. This would give them important data for a 21st-century system of statistics and eventually would mean the Bureau of Labor Statistics could wind down current field operations for gathering prices, which are expensive and can be burdensome for businesses. Mandatory scanner data reporting already exists in the United Kingdom and Canada.105
Congress also could author legislation requiring the Bureau of Labor Statistics to track inflation inequality in the United States, with authorizing language for appropriate funds to do so. In the same legislation, Congress could require the agency to study what kinds of metrics could be formulated to describe the poverty tax.
Resourcing these new investments in statistical infrastructure
Resources are a critical constraint if the Bureau of Labor Statistics is to provide meaningful data on inflation inequality. Scanner data from large retailers is a necessity, and the costs for this are not well known at present. The agency could pursue various avenues for obtaining this data and there are no recent public assessments of how it would obtain the data or what it would cost. Hiring staff to analyze the data and make regular reports on it should be relatively inexpensive, but costs for this infrastructure are uncertain and could range from a few million dollars to a few tens of millions of dollars.
Significant modernization of the agency’s Consumer Expenditure Survey is necessary no matter whether the agency begins using scanner data. A 2013 National Academies of Sciences report details current Consumer Expenditure survey costs and evaluated some proposals for reform.106 The maximal design considered increased costs by about 30 percent, which would amount to about $10 million a year. The NAS modernization plan would increase the sample size and reduce costs per person sampled.
More specifically, the National Academies of Sciences report did not calculate costs for the transition between the current Consumer Expenditure Survey and a modernized one, which could run into the tens of millions of dollars. A conservative estimate, accounting for price changes since the 2013 NAS report, is that the agency would need perhaps $60 million over two to three years to stand up new infrastructure and would then need ongoing appropriations of about $10 million per year.
Because research into the importance of the poverty premium is relatively light at this time, initial costs would be very low. An initial report should indicate whether the Bureau of Labor Statistics needs further resources to purchase data, add questions to surveys, or increase data collection in the field. Eventual costs are hard to ballpark, but immediate costs should be merely the price of appropriate full-time positions required to conduct the initial study.
Conclusion
Our nation’s economic statistical agencies have done remarkable work for a long time on thin budgets. Restoring what they have lost is urgent. But an agenda focused only on restoring the capacity of statistical agencies is insufficient. A new generation of statistics would let businesses see which customer segments are weakening, would let households evaluate how the U.S. economy is working for others like them, and would let policymakers see where economic pressure is building while there is still time to respond.
Policymakers should consider these choices deliberately and then task statistical agencies with developing new metrics that are responsive to current economic concerns. Policymakers should focus on building an integrated, timely system of income, consumption, and wealth statistics that can describe how different households are faring, as well as develop measures of affordability to capture the different prices and costs that households face. Neither is expensive, and the next president can begin both without waiting for Congress.
Making this statistical agenda a priority will yield far-ranging benefits for policymakers. It will change our nation’s economic discourse, focusing debate on how the economy works for all households, not just the statistically aggregate household. It will boost the competitiveness of U.S. businesses and create a more dynamic marketplace. It will boost trust in our federal statistics by answering the questions people have about our economy right now. For all these reasons, the next administration should prioritize the development of these new systems.
About the author
Austin Clemens is a visiting fellow at the Washington Center for Equitable Growth. Previously, he was a senior fellow and a computational social scientist at Equitable Growth, where he led the organization’s work on federal statistical policy. He is an expert on income and wealth inequality in the United States.
Acknowledgments
The author thanks Connie Citro, Erica Groshen, David Johnson, and John Sabelhaus for providing useful comments.
Did you find this content informative and engaging?
Get updates and stay in tune with U.S. economic inequality and growth!
End Notes
1. David S. Johnson, “Threats to headline economic statistics,” Brookings Institution, April 7, 2026, available at https://www.brookings.edu/articles/threats-to-headline-economic-statistics/.
2. American Statistical Association Project Team to Assess and Monitor the Health of the Federal Statistics, “2026 Midyear Update: Resources and Leadership Supporting Federal Statistics” (Alexandria, VA: American Statistical Association, 2026), available at https://www.amstat.org/docs/default-source/amstat-documents/FedStatHealth_MidYearUpdate.pdf.
3. Hansi Lo Wang, “A Trump push to cut ‘statistical noise’ could mean less data from the Census Bureau,” NPR, June 12, 2026, available at https://www.npr.org/2026/06/12/nx-s1-5855734/census-bureau-data-differential-privacy.
4. Hansi Lo Wang, “Experts raise alarms over Census Bureau report Trump is touting on noncitizen voting,” NPR, August 19, 2026, available at https://www.npr.org/2026/08/19/nx-s1-5938799/trump-census-bureau-noncitizen-voting.
5. Hansi Lo Wang, “Trump officials cut political interference ban after unusual Census Bureau report,” NPR, August 31, 2026, available at https://www.npr.org/2026/08/31/nx-s1-5948057/department-commerce-census-bureau-scientific-integrity.
6. American Statistical Association, “Modernizing the Federal Statistical System: A Roadmap” (Alexandria, VA: American Statistical Association, 2026), available at https://www.amstat.org/docs/default-source/amstat-documents/modernizing-the-federal-statistical-system/fss_modernizationroadmap.pdf.
7. Lyndon B. Johnson, “Annual Message to the Congress on the State of the Union,” January 8, 1964, available at https://www.americanrhetoric.com/speeches/lbj1964stateoftheunion.htm.
8. Food Stamp Act of 1964, Public Law 88–525, 88th Cong., 2d sess. (August 31, 1964), 78 Stat. 703, available at https://www.govinfo.gov/content/pkg/STATUTE-78/pdf/STATUTE-78-Pg703.pdf.
9. U.S. Department of Agriculture, Food and Nutrition Service, “A Short History of SNAP,” available at https://www.fna.usda.gov/snap/history (last accessed October 2026).
10. Sargent Shriver, We Called It a War: Lessons Learned from the Fight to End Poverty, ed. David Birenbaum (Baltimore: Apprentice House Press, 2026), 93.
11. Gordon M. Fisher, “The Development of the Orshansky Poverty Thresholds and Their Subsequent History as the Official U.S. Poverty Measure” (Washington: U.S. Census Bureau, 1997), available at https://www.census.gov/content/dam/Census/library/working-papers/1997/demo/orshansky.pdf.
12. Donald Rumsfeld, then the Director of the Office of Economic Opportunity, was one defender of the terminology, writing that the existing poverty terminology was “accurate and entirely appropriate.”
13. Fisher, “The Development of the Orshansky Poverty Thresholds and Their Subsequent History as the Official U.S. Poverty Measure.”
14. Author’s calculations using data from MediaCloud. Articles that mention “poverty” and “income” but do not mention “world” in U.S. newspaper, from 2014 to 2025.
15. Liana Fox, “What Is the Supplemental Poverty Measure and How Does It Differ From the Official Measure?”, U.S. Census Bureau, September 4, 2019, available at https://www.census.gov/newsroom/blogs/random-samplings/2019/09/what_is_the_suppleme.html.
16. Sen. Robert M. La Follette Jr., Senate Resolution 220, 72nd Cong., 1st sess., Congressional Record 75, pt. 11 (June 8, 1932), available at https://www.congress.gov/72/crecb/1932/06/08/GPO-CRECB-1932-pt11-v75-7.pdf. See page 12285.
17. Hugh Rockoff, “On the Controversies behind the Origins of the Federal Economic Statistics,” Journal of Economic Perspectives 33 (1) (2019): 147–164, available at https://www.aeaweb.org/articles?id=10.1257/jep.33.1.147.
18. Franklin D. Roosevelt, “Address at Forbes Field, Pittsburgh, Pa.,” October 1, 1936, The American Presidency Project, available at https://www.presidency.ucsb.edu/documents/address-forbes-field-pittsburgh-pa.
19. Daniel Hirschman, “Rediscovering the 1%: Knowledge Infrastructures and the Stylized Facts of Inequality,” American Journal of Sociology 127 (3) (2021): 739–786, available at https://www.journals.uchicago.edu/doi/pdf/10.1086/718451?download=true.
20. Thomas Piketty and Emmanuel Saez, “Income Inequality in the United States, 1913–1998,” Quarterly Journal of Economics 118 (1) (2003): 1–39, available at https://eml.berkeley.edu/~saez/pikettyqje.pdf.
21. Barack Obama, “Remarks by the President on the Economy in Osawatomie, Kansas,” December 6, 2011, available at https://obamawhitehouse.archives.gov/the-press-office/2011/12/06/remarks-president-economy-osawatomie-kansas/.
22. This is a recent and relevant example in a long literature in political science, sociology, and economics which finds that official statistics do more than merely describe the economy. They also create the frame for economic policymaking, determining which problems are visible, which policies are judged successful, and which groups are disadvantaged. Examples are Deborah Stone, Counting: How We Use Numbers to Decide What Matters (New York: Liveright, 2020), Wendy Nelson Espeland and Mitchell L. Stevens, “A Sociology of Quantification,” European Journal of Sociology 49 (3) (2008): 401–436, Wendy Nelson Espeland and Michael Sauder, “Rankings and Reactivity: How Public Measures Recreate Social Worlds,” American Journal of Sociology 113 (1) (2007): 1–40, and the Stiglitz, Sen, and Fitoussi commission’s finding that “what we measure shapes what we collectively strive to pursue.”
23. Austin Clemens, “Gross Domestic Product sets the tone of the U.S. economic debate while leaving working- and middle-class families behind,” Washington Center for Equitable Growth, March 3, 2020, available at https://equitablegrowth.org/gross-domestic-product-sets-the-tone-of-the-u-s-economic-debate-while-leaving-working-and-middle-class-families-behind/.
24. Austin Clemens, “Maybe some Earth Day soon, we’ll know what nature is worth,” Washington Center for Equitable Growth, April 24, 2023, available at https://equitablegrowth.org/maybe-some-earth-day-soon-well-know-what-nature-is-worth/.
25. Victoria Elliott, “A Census Proposal Would Stop Counting Undocumented Immigrants—and Ignore Race and Sexual Orientation,” Wired, August 8, 2026, available at https://www.wired.com/story/census-proposal-would-stop-counting-undocumented-immigrants-and-ignore-race-and-sexual-orientation/.
26. Gary Stein, “New insights on bank overdraft fees and 4 ways to avoid them,” Consumer Financial Protection Bureau, February 25, 2016, available at https://www.consumerfinance.gov/archive/blog/new-insights-on-bank-overdraft-fees-and-4-ways-to-avoid-them/.
27. Max Zahn, “Who is E.J. Antoni, Trump’s pick to lead the BLS?” ABC News, August 12, 2025, available at https://abcnews.com/Business/ej-antoni-trumps-pick-lead-bls/story?id=124579471.
28. Wang, “Experts raise alarms over Census Bureau report Trump is touting on noncitizen voting.”
29. Constance F. Citro and others, “What Protects the Autonomy of the Federal Statistical Agencies? An Assessment of the Procedures in Place to Protect the Independence and Objectivity of Official U.S. Statistics,” Statistics and Public Policy 10 (1) (2023), available at https://www.tandfonline.com/doi/full/10.1080/2330443X.2023.2188062.
30. Torben G. Andersen and others, “Real-time price discovery in global stock, bond and foreign exchange markets,” Journal of International Economics 73 (2) (2007): 251–277, available at https://www.sciencedirect.com/science/article/abs/pii/S0022199607000608?via%3Dihub.
31. Nicholas Bloom and others, “The Value of Reliable Statistics.” Working Paper 35135 (National Bureau of Economic Research, 2026), available at https://www.nber.org/papers/w35135.
32. Feng Chi, “Information Waves and Firm Investment.” Working paper (SSRN, 2022), available at https://papers.ssrn.com/sol3/papers.cfm?abstract_id=4269750.
33. U.S. Department of Commerce, Office of the Under Secretary for Economic Affairs, “Revenue of Industries Heavily Reliant on U.S. Government Data,” December 3, 2024, available at https://www.commerce.gov/news/blog/2024/12/revenue-industries-heavily-reliant-us-government-data.
34. Asif Mohammed Islam and Daniel Lederman, “Data Transparency and Growth in Developing Economies during and after the Global Financial Crisis.” Policy Research Working Paper 9493 (World Bank, 2024), available at https://openknowledge.worldbank.org/server/api/core/bitstreams/987ff135-7af7-41a6-a625-427cc8ba188e/content.
35. Michael Hurwitz and Jonathan Smith, “Student Responsiveness to Earnings Data in the College Scorecard,” Economic Inquiry 56 (2) (2018): 1220–1243, available at https://onlinelibrary.wiley.com/doi/10.1111/ecin.12530.
36. Michèle Belot, Philipp Kircher, and Paul Muller, “Providing Advice to Jobseekers at Low Cost: An Experimental Study on Online Advice,” The Review of Economic Studies 86 (4) (2019): 1411–1447, available at https://academic.oup.com/restud/article/86/4/1411/5091309.
37. Michèle Belot, Philipp Kircher, and Paul Muller, “Do the Long-Term Unemployed Benefit from Automated Occupational Advice during Online Job Search?” Discussion Paper 15452 (IZA – Institute of Labor Economics, 2022), available at https://docs.iza.org/dp15452.pdf.
38. Chris Borges, Navin Girishankar, and Andrew Reamer, “A Federal Statistical System for the Age of Economic Security” (Washington: Center for Strategic and International Studies, 2026), available at https://www.csis.org/analysis/federal-statistical-system-age-economic-security.
39. Congressional Research Service, “The Federal Statistical System: An Overview” (Washington: 2024), Report R48161, available at https://www.congress.gov/crs-product/R48161.
40. Authors’ calculations, averaging nominal funding levels over the ten years 2017-2026 to capture the full decennial Census cycle.
41. Diane Whitmore Schanzenbach and Michael R. Strain, “America’s small investment in government data has big payoffs,” Brookings Institution, March 8, 2017, available at https://www.brookings.edu/articles/americas-small-investment-in-government-data-has-big-payoffs/.
42. Tomaz Cajner and others, “Lessons Learned from the Use of Nontraditional Data during COVID-19.” In Wendy Edelberg, Louise Sheiner, and David Wessel, eds., Recession Remedies: Lessons Learned from the U.S. Economic Policy Response to COVID-19 (Washington: Brookings Institution, 2022), available at https://www.brookings.edu/wp-content/uploads/2022/04/RR-Chapter-9-Use-of-Nontraditional-Data.pdf.
43. “The pandemic has broken a closely followed survey of sentiment,” The Economist, September 7, 2023, available at https://economist.com/graphic-detail/2023/09/07/the-pandemic-has-broken-a-closely-followed-survey-of-sentiment.
44. American Statistical Association, “Assessing and Monitoring the Health of Federal Statistics,” available at https://www.amstat.org/policy-and-advocacy/assessing-the-health-of-the-principal-federal-statistical-agencies (last accessed November 2026).
45. Horrigan, Johnson, and Meinhardt, “Restoring trust in economic statistics: Why it matters and how we fix it.”
46. Lora Kelley, “When did everything become ‘K-shaped’?” The New York Times, December 19, 2025, available at https://www.nytimes.com/2025/12/19/business/K-shaped-economy.html.
47. Andrew Dorn, “K-shaped economy is still ‘firmly intact,’ Moody’s economist says.” The Hill, June 23, 2026, available at https://thehill.com/business/5935025-moodys-mark-zandi-economy-k-shape/.
48. U.S. Bureau of Labor Statistics, “Distribution of Personal Consumption Expenditures,” available at https://www.bls.gov/cex/pce-ce-distributions.htm (last accessed October 2026).
49. Sen. Mark R. Warner and others, letter to Secretary of Labor Lori Chavez-DeRemer, Acting BLS Commissioner William J. Wiatrowski, and Census Bureau Director George M. Cook, March 5, 2026, available at https://www.kelly.senate.gov/wp-content/uploads/2026/03/AI-Labor-Data-BLS-Letter.pdf.
50. Adam Safir and Daniel Dorfman, “Assessing Consumer Expenditure Surveys data quality through the lens of data use,” Monthly Labor Review, November 2021, available at https://www.bls.gov/opub/mlr/2021/article/assessing-consumer-expenditure-surveys-data-quality-through-the-lens-of-data-use.htm.
51. National Academies of Sciences, Engineering, and Medicine, “Creating an Integrated System of Data and Statistics on Household Income, Consumption, and Wealth: Time to Build” (Washington: The National Academies Press, 2024), available at https://www.nationalacademies.org/projects/DBASSE-CNSTAT-21-01/publication/27333.
52. U.S. Bureau of Economic Analysis, “Distribution of Personal Income,” available at https://www.bea.gov/data/special-topics/distribution-of-personal-income (last accessed October 2026).
53. BEA did track the distribution of Family Personal Income among quintiles of the distribution in the late 1940s and early 1950s.
54. Washington Center for Equitable Growth, “U.S. Inequality Tracker,” available at https://inequalitytracker.equitablegrowth.org/dashboard/ (last accessed October 2026).
55. Aditya Aladangady and others, “Excess Savings during the COVID-19 Pandemic,” FEDS Notes (Washington: Board of Governors of the Federal Reserve System, 2022), available at https://www.federalreserve.gov/econres/notes/feds-notes/excess-savings-during-the-covid-19-pandemic-20221021.html.
56. Julia Shapero “Americans will likely run out of excess pandemic savings this quarter: study,” The Hill, August 18, 2023, available at https://thehill.com/business/4158323-americans-will-likely-run-out-of-excess-pandemic-savings-this-quarter-study/.
57. U.S. Bureau of Economic Analysis, “Distribution of Personal Income,” available at https://www.bea.gov/data/special-topics/distribution-of-personal-income.
58. Board of Governors of the Federal Reserve System, “Distributional Financial Accounts,” available at https://www.federalreserve.gov/releases/z1/dataviz/dfa/index.html (last accessed October 2026).
59. U.S. Bureau of Labor Statistics, “Distribution of Personal Consumption Expenditures.”
60. Washington Center for Equitable Growth, “U.S. Inequality Tracker.”
61. Joseph E. Stiglitz, Amartya Sen, and Jean-Paul Fitoussi, “Report by the Commission on the Measurement of Economic Performance and Social Progress” (Paris: Commission on the Measurement of Economic Performance and Social Progress, 2009), available at https://ec.europa.eu/eurostat/documents/8131721/8131772/Stiglitz-Sen-Fitoussi-Commission-report.pdf.
62. Austin Clemens and Heather Boushey, “Disaggregating Growth” (Washington: Washington Center for Equitable Growth, 2018), available at https://equitablegrowth.org/research-paper/disaggregating-growth/?longfo=true.
63. Clemens, “Gross Domestic Product sets the tone of the U.S. economic debate while leaving working- and middle-class families behind.”
64. Jeff Horwich, “Have U.S. consumers gone ‘K-shaped’? A review of the data,” Federal Reserve Bank of Minneapolis, March 20, 2026, available at https://www.minneapolisfed.org/article/2026/have-us-consumers-gone-K-shaped-a-review-of-the-data.
65. Maria Ramirez Uribe, “Bessent said the K-shaped economy ‘is over.’ Here’s what financial experts say,” PBS NewsHour, August 12, 2026, available at https://www.pbs.org/newshour/economy/bessent-said-the-K-shaped-economy-is-over-heres-what-financial-experts-say.
66. Mary Beech, “What can federal data collection tell policymakers and researchers about artificial intelligence in the U.S. labor market?”, Washington Center for Equitable Growth, August 24, 2026, available at https://equitablegrowth.org/what-can-federal-data-collection-tell-policymakers-and-researchers-about-artificial-intelligence-in-the-u-s-labor-market/.
67. Sen. Mark R. Warner and others, letter to Secretary of Labor Lori Chavez-DeRemer, Acting BLS Commissioner William J. Wiatrowski, and Census Bureau Director George M. Cook, March 5, 2026, available at https://www.kelly.senate.gov/wp-content/uploads/2026/03/AI-Labor-Data-BLS-Letter.pdf.
68. Wayne Best and Michael Brown, “Will the affluent drive consumer spending growth again?” (Visa Business and Economic Insights, 2022), available at https://usa.visa.com/dam/VCOM/regional/na/us/partner-with-us/economic-insights/documents/special-report-affluent-consumer-spend.pdf.
69. Chris Wheat and others, “Real income sustains weak trend, while cash liquidity remains stable” (New York: JPMorganChase Institute, 2025), available at https://www.jpmorganchase.com/institute/all-topics/household-financial-health/real-income-sustains-weak-trend-cash-liquidity-remains-stable.
70. David Tinsley and others, “Consumer Checkpoint: Consumers hit the back of the net” (Bank of America Institute, 2026), available at https://institute.bankofamerica.com/economic-insights/consumer-checkpoint-july-2026.html.
71. Chi, “Information Waves and Firm Investment.”
72. National Academies of Sciences, Engineering, and Medicine, “Creating an Integrated System of Data and Statistics on Household Income, Consumption, and Wealth: Time to Build,” p. 32.
73. U.S. Bureau of Labor Statistics, “Wage Records Research,” available at https://www.bls.gov/wrp/publications.htm (last accessed October 2026).
74. A bill to amend the Internal Revenue Code of 1986 to allow the disclosure of certain business tax return information to the Bureau of Economic Analysis and the Bureau of Labor Statistics for certain statistical purposes, H.R. 10546, 118th Cong., 2d sess. (December 20, 2024), available at https://www.congress.gov/bill/118th-congress/house-bill/10546?s=2&r=1.
75. U.S. Bureau of Labor Statistics, “Report to the Appropriations Committees on Modernizing the Current Population Survey” (Washington: U.S. Department of Labor, 2026), available at https://www.bls.gov/bls/congressional-reports/report-to-the-appropriations-committees-on-modernizing-the-current-population-survey-april-2026.htm.
76. Lydia Saad, “Affordability Still Dominates Americans’ Financial Worries,” Gallup, April 28, 2026, available at https://news.gallup.com/poll/708905/affordability-dominates-americans-financial-worries.aspx.
77. Xavier Jaravel, “Inflation Inequality: Measurement, Causes, and Policy Implications,” Annual Review of Economics 13 (2021): 599–629, available at https://www.annualreviews.org/content/journals/10.1146/annurev-economics-091520-082042.
78. Rekha Balu and William J. Congdon, “Federal Economic Statistics: Current Uses, Unmet Needs, and Directions for Innovation” (Washington: Brookings Institution, 2026), available at https://www.brookings.edu/wp-content/uploads/2026/03/20260401_EII_BaluCongdon.pdf.
79. U.S. Bureau of Labor Statistics, “R-CPI-I and R-C-CPI-I: Research Consumer Price Indexes by Income,” available at https://www.bls.gov/cpi/research-series/r-cpi-i.htm (last accessed October 2026).
80. Kunal Sangani, “Cheapflation Cycles.” Working Paper 35235 (National Bureau of Economic Research, 2026), available at https://www.nber.org/papers/w35235.
81. National Academies of Sciences, Engineering, and Medicine, “Modernizing the Consumer Price Index for the 21st Century” (Washington: The National Academies Press, 2022), available at https://doi.org/10.17226/26485.
82. Matt Fellowes, “Reducing the High Costs of Being Poor,” Brookings Institution, March 8, 2008, available at https://www.brookings.edu/articles/reducing-the-high-costs-of-being-poor/.
83. Ana Elena Azpúrua, “Charting ‘Cheapflation’: How Budget Brands Got So Pricey,” Harvard Business School Working Knowledge, September 27, 2024, available at https://www.library.hbs.edu/working-knowledge/charting-cheapflation-how-budget-brands-got-so-pricey.
84. Marijn A. Bolhuis and others, “The Cost of Money Is Part of the Cost of Living: New Evidence on the Consumer Sentiment Anomaly” (2024), available at https://papers.ssrn.com/sol3/papers.cfm?abstract_id=4738600.
85. Hannah Gdalman and others, “FinHealth Spend Report 2025” (Chicago: Financial Health Network, 2025), available at https://finhealthnetwork.org/wp-content/uploads/2025/10/FinHealth-Spend-Report-2025.pdf.
86. Jamie Evans and Sara Davies, “Paying More for Less: The Poverty Premium in 2026” (Bristol, UK: Personal Finance Research Centre, University of Bristol, 2026), available at https://www.bristol.ac.uk/media-library/sites/geography/pfrc/documents/Poverty-Premium-2026.pdf.
87. Janelle Jones and others, “Half of Every Dollar: How Household Debt Eats Into Workers’ Income Gains” (New York: The Century Foundation, 2026), available at https://tcf.org/content/report/half-of-every-dollar-how-household-debt-eats-into-workers-income-gains/.
88. Austin Clemens, “U.S. income growth has been stagnant. To what degree depends on how you measure it.,” Washington Center for Equitable Growth, November 28, 2018, available at https://equitablegrowth.org/u-s-income-growth-has-been-stagnant-to-what-degree-depends-on-how-you-measure-it/.
89. Christopher Wimer, Sophie Collyer, and Xavier Jaravel, “The Costs of Being Poor: Inflation Inequality Leads to Three Million More People in Poverty” (New York: Center on Poverty and Social Policy, Columbia University, and The Groundwork Collaborative, 2019), available at https://povertycenter.columbia.edu/publication/2019/the-costs-of-being-poor-inflation-inequality.
90. Ken Sweet, “Bank of America’s overdraft fees down 90% under new policy,” Associated Press, August 17, 2022, available at https://apnews.com/article/brian-moynihan-92e3aa312012c9d4bc54720bb2b5ba60.
91. Stein, “New insights on bank overdraft fees and 4 ways to avoid them.”
92. Charlotte Morabito, “Inflation is slowing. Here’s why prices still aren’t going down,” CNBC, May 12, 2024, available at https://www.cnbc.com/2024/05/12/inflation-is-slowing-heres-why-prices-still-arent-going-down.html.
93. Olivier Coibion and others, “Innocent Bystanders? Monetary Policy and Inequality in the U.S.” Working Paper 18170 (National Bureau of Economic Research, 2012), available at https://www.nber.org/papers/w18170.
94. Xavier Jaravel, “The Unequal Gains from Product Innovations: Evidence from the U.S. Retail Sector,” Quarterly Journal of Economics 134 (2) (2019): 715–783, available at https://academic.oup.com/qje/article-abstract/134/2/715/5230867.
95. Alberto Cavallo and Oleksiy Kryvtsov, “Price Discounts and Cheapflation During the Post-Pandemic Inflation Surge.” Working Paper 32626 (National Bureau of Economic Research, 2024), available at https://www.nber.org/papers/w32626.
96. Sangani, “Cheapflation Cycles.”
97. U.S. Department of Transportation, Maritime Administration, “Investing in America: Biden-Harris Administration Announces Nearly $580 Million for Ports to Strengthen American Supply Chains and Lower Costs,” Press release, November 15, 2024, available at https://www.transportation.gov/briefing-room/investing-america-biden-harris-administration-announces-nearly-580-million-ports.
98. Alex Horowitz and Gabriel Kravitz, “Payday Loans and Overdraft: A Short History and What’s Next,” The Pew Charitable Trusts, June 2, 2023, available at https://www.pew.org/en/research-and-analysis/articles/2023/06/02/payday-loans-and-overdraft-a-short-history-and-whats-next.
99. Consumer Financial Protection Bureau, “CFPB Finalizes Changes to Prepaid Accounts Rule,” Press release, January 25, 2018, available at https://www.consumerfinance.gov/archive/newsroom/cfpb-finalizes-changes-prepaid-accounts-rule/.
100. Congressional Research Service, “CFPB Finalizes Overdraft Rule, Related Legislation” (Washington: 2025), Insight IN12513, available at https://www.congress.gov/crs-product/IN12513.
101. Office of the Mayor, City of New York, “Mayor Mamdani Announces Landmark ‘Click-To-Cancel’ Consumer Protection Rules to Ban Subscription Traps and Junk Fees,” Press release, July 10, 2026, available at https://www.nyc.gov/mayors-office/news/2026/07/mayor-mamdani-announces-landmark–click-to-cancel–consumer-prot.
102. Romain Dillet, “Chime now has 5 million customers and introduces overdraft alternative,” TechCrunch, September 4, 2019, available at https://techcrunch.com/2019/09/04/chime-now-has-5-million-customers-and-introduces-overdraft-alternative/.
103. “Re-Engineering Statistics using Economic Transactions (RESET),” a joint project of the University of Maryland, the University of Michigan, and the U.S. Census Bureau, available at https://ebp-projects.isr.umich.edu/RESET/ (last accessed October 2026).
104. Board of Governors of the Federal Reserve System, “Survey of Consumer Finances, 1989–2025: Historic Tables, Estimates in Nominal Dollars,” Table 18: Ratio of debt payments to family income (Washington: 2026), available at https://www.federalreserve.gov/econres/files/scf2025_tables_public_nominal_historical.xlsx.
105. Cloud Y, “The curious case of why UK and Canada CPI use grocery scanner data but the US can’t,” EconReporter, June 24, 2026, available at https://en.econreporter.com/58106/why-uk-canada-cpi-use-grocery-scanner-data-us-cant/.
106. National Research Council, “Measuring What We Spend: Toward a New Consumer Expenditure Survey” (Washington: The National Academies Press, 2013), available at https://doi.org/10.17226/13520.
Related




Explore the Equitable Growth network of experts around the country and get answers to today's most pressing questions!
Stay updated on our latest research