Over at Grasping Reality: (2003): Academic Economics: Strengths and Weaknesses: Weekend Reading
Things to Read at Lunchtime on April 4, 2015
Must- and Should-Reads:
- : Was Milton Friedman the Last Economist?
- : Overlapping Generations: The First Jubilee
- : An Exact Consumption-Loan Model of Interest With or Without the Social Contrivance of Money
- : “Mervyn King… at Princeton… had a lot of interesting things to say — boy, is he hard on euro area policymakers, and as I heard him he’s surprisingly sympathetic to the current Greek leadership…”
- Morning Must-Read: : Too Soon to Sound the Alarm, but March Jobs Numbers Should Give Us Pause
Might Like to Be Aware of:
- Today’s Must-Must-Read: : Weak U.S. Employment Gains and Wage Growth
- Amanda Marcotte: “http://www.georgerrmartin.com/excerpt-from-the-winds-of-winter/ Book loyalists, I think it’s becoming clear that Game of Thrones is forcing Martin to release more chapters.”
- : How can the Iran deal fall apart? Let me count the ways
- : A Tale Of Two Wearables
- : A Brief Primer on Human Social Networks, or How to Keep $16 Billion In Your Pocket
- : iPhone Killer: The Secret History of the Apple Watch
Weekend reading
This is a weekly post we publish on Fridays with links to articles we think anyone interested in equitable growth should be reading. We won’t be the first to share these articles, but we hope by taking a look back at the whole week we can put them in context.
Links
The costs of attending college have skyrocketed in recent decades, yet net costs (after factoring in financial aid, for example) haven’t increased as much, Shane Ferro reports. [business insider]
Justin Wolfers looks at a paper that claims parenting time doesn’t make that much of a difference for children. He finds it wanting. [the upshot]
Paul Krugman enters the blog debate about secular stagnation between Larry Summers and Ben Bernanke. [ny times]
John Roberston looks at what’s holding back productivity growth. [atlanta fed]
Cardiff Garcia digs into questions surrounding the yield curve and its effect on the economy. [ft alphaville]
Friday Figure
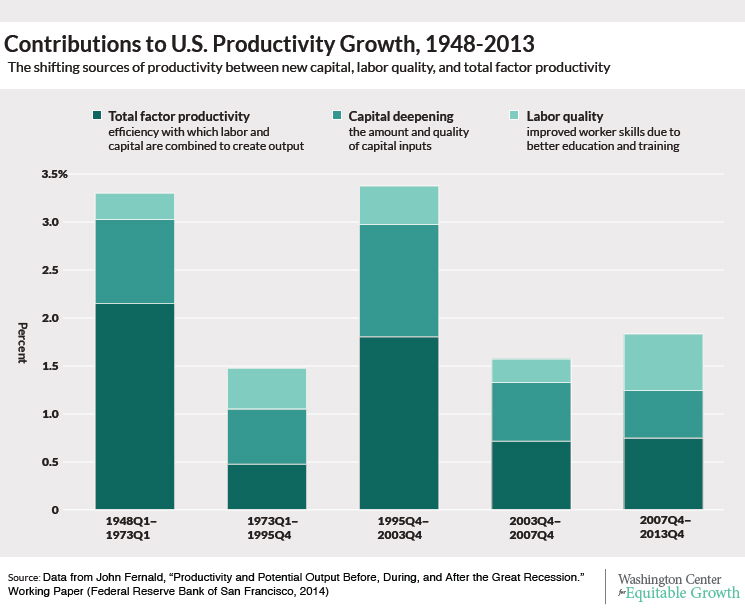
Figure from “The future of work in the second machine age is up to us,” by Marshall Steinbaum.
Today’s Must-Must-Read: Ben Zipperer: Weak U.S. Employment Gains and Wage Growth
…weak employment growth… not accompanied by strong hourly wage gains…. Over the last three months, the US economy has added a monthly average of 197,000 jobs… these job gains have not been sufficient to generate substantial wage growth…. In March…h the employed share of the population aged 16-to-24 years dropping to 48.2 percent from 48.9 percent. Until March the employment situation for younger workers had generally improved… but employment rates for the young still remain at historic lows….
Last month the hourly pay for workers in the private sector grew at a 2.1 percent annual rate compared to last year, and at an annual rate of 2.8 percent over the past three months…. The contrast is even sharper when looking back over the past six months… nonsupervisory wages have grown at an annual rate of about 1.8 percent…. For workers to maintain or increase their share of income, nominal wages must grow at an annual rate of at least 3.5 percent…. Since 1990, nominal wage growth sustainably exceeded the 3.5 percent threshold only when the prime-age employment rate remained above 79 percent. The employment-to-population ratio for prime-age workers in the past month was 77.2 percent…
Weak U.S. Employment Gains and Wage Growth
New data released this morning by the Bureau of Labor Statistics shows remaining weakness in the labor market as both job and wage growth disappointed. There were 126,000 more people employed in the United States in March compared to the prior month, and this weak employment growth was not accompanied by strong hourly wage gains, which grew by only 2.1 percent compared to last year, according to the latest employment and wage data.
The overall unemployment rate stayed the same at 5.5 percent. Many of the job gains were in the retail sector and health care sectors, where employment rose by 25,900 and 30,000, respectively. Over the last three months, the US economy has added a monthly average of 197,000 jobs, and these job gains have not been sufficient to generate substantial wage growth for the overall workforce.
While employment for younger workers saw some positive development in recent months, it fell in March with the employed share of the population aged 16-to-24 years dropping to 48.2 percent from 48.9 percent. Until March the employment situation for younger workers had generally improved alongside the continuing economic recovery, but employment rates for the young still remain at historic lows. (See Figure 1.)
Figure 1

The employed share of the younger population peaked at 60.2 percent in 2000 and fell sharply during the subsequent recession in 2001. Employment for 16-to-24 year-old workers never recovered from that first recession of the decade, and in the following Great Recession of 2007-2009 it suffered extremely steep losses. At the depths of 2010, employment rates for younger workers reached as low as 44.6 percent. The Federal Reserve should keep in mind that raising interest rates, as it may do this year, will dampen the already low employment prospects of younger workers.
As for wages, last month the hourly pay for workers in the private sector grew at a 2.1 percent annual rate compared to last year, and at an annual rate of 2.8 percent over the past three months, according to the most recent data. Most of the wage growth appears to be in lower-wage industries, such as the retail sector and the leisure and hospitality industries, which include restaurants. Over the last three months, wages in those sectors have grown at annual rates of 3.9 percent and 3.0 percent, respectively.
At the same time, wage growth for all nonsupervisory and production workers appears to be moving the wrong direction and may be aggravating wage inequality. In 2014, year-on-year wage growth averaged roughly 2.3 percent for this portion of the workforce, which comprises about 80 percent of total private-sector employment. This year, however, nonsupervisory wages have slowed, only growing at an average annual pace of under 1.8 percent, according to the most recent data.
The contrast is even sharper when looking back over the past six months: comparing the past three months to the prior three months, nonsupervisory wages have grown at an annual rate of about 1.8 percent. This disturbing slowdown in nonsupervisory wages relative to the overall private sector suggests that wage inequality may be increasing as nonsupervisory workers are generally paid less than other employees.
While job gains at the current pace will eventually bring about some wage growth, we should not expect healthy, sustainable wage growth immediately. For workers to maintain or increase their share of income, nominal wages must grow at an annual rate of at least 3.5 percent, assuming the Federal Reserve’s inflation target of 2.0 percent and annual productivity growth of 1.5 percent. Since 1990, nominal wage growth sustainably exceeded the 3.5 percent threshold only when the prime-age employment rate remained above 79 percent.
The employment-to-population ratio for prime-age workers in the past month was 77.2 percent, and the current rate of job gains is increasing this employment rate by about 0.6 to 1.2 percentage points per year. At this pace of employment growth, we should expect persistent, healthy wage gains sometime between the second half of next year and the beginning of 2018, perhaps as late as eight years after the end of the most recent recession.
Morning Must-Read: Elise Gould: Too Soon to Sound the Alarm, but March Jobs Numbers Should Give Us Pause
…While it’s important not to put too much stock in a couple months of data—especially given the unusual amount of snow that blanketed the country in the past two months—policymakers should be wary of any signs of any slowdown from the solid job growth over the previous year…. There is still ample slack in the labor market. Private sector hourly wages are up only 2.1 percent over the year…. The Federal Reserve should not be thinking about tapping the brakes any time soon.
Things to Read on the Afternoon of April 2, 2015
Must- and Should-Reads:
- : U.S. labor market slack and the path to full employment
- Morning Must-Read: : The Housing Bubble and the Financial Crisis #25,452
- : “[Jeb] Bush is leaning on Glenn Hubbard and Kevin Warsh…. Hubbard is a competent economist, when he wants to be. But some people may recall that he went around loudly proclaiming that the ‘Bush boom’ proved the efficacy of tax cuts, while Obamacare was a huge drag on business…. Warsh… was a striking exemplar of… the self-proclaimed wise man who urges us to ignore basic macroeconomics in favor of assertions about market psychology… that aren’t even borne out by market prices…”
- Morning Must-Read: : An Extrapolative Model of House Price Dynamics
- Morning Must-Read: : How Much Does Job Search Matter for Job Switching?
- Morning Must-Read: : The Maddening Bond-Market Conundrum-Redux Conundrum
- Morning Must-Watch: Jared Bernstein: Our Full Employment Event… The Video!
- Today’s Must-Must-Read: : Hard Decisions on Easy Money: Growth Now or Turmoil Later?
- Morning Must-Read: : Employment impacts of the Affordable Care Act
- Morning Must-Read: : On Larry Ball and Sub-5% Unemployment
- : Latest U.S. economic growth numbers highlight corporate investment
Might Like to Be Aware of:
- : “Ted Cruz, Marco Rubio and Rand Paul — all made a striking confession: They considered ‘the increasing gap between rich and poor’ to be a problem. But on the question of whether the government should intervene to solve it, Mr. Cruz and Mr. Paul rejected that approach, and Mr. Rubio appeared to agree with them…”
- : Adam Smith Is Not the Sntidote to Thomas Piketty
- : Extracts from Frank Vanderlip, “From Farm Boy to Financier”
- : “William Lehman has written a screed…. I kinda pull rank. He points to Star Trek…. Lehman has completely missed the point…. Gene Roddenberry was one of the great Social Justice Warriors. You don’t get to claim him or his show as a shield of virtue for a cause he would have disdained…”
- : “How Xi Jinping, an unremarkable provincial administrator, became China’s most authoritarian leader since Mao…”
- : Newsonomics: BuzzFeed and The New York Times play Facebook’s ubiquity game
- : Letter from Jekyll Island
- : Uncle Hugo’s: Interview with Miles Vorkosigan
U.S. labor market slack and the path to full employment
After years of economic tumult during the Great Recession and extraordinary actions by the Federal Reserve to jumpstart and sustain economic growth, many economists and policymakers are now calling for a return to normal monetary policy. The federal funds rate has been at zero for over 6 years now. With the economic recovery moving along, the Federal Open Markets Committee seems ready to raise the federal funds rate off zero, which the financial markets expect to happen this year.
But the question, as it has been for over a year now, is how much has the labor market actually recovered from the Great Recession. A premature rise in interest rates could arrest the labor market recovery we’re already seeing. The unemployment rate has been falling since March 2010, but it almost certainly underestimates the amount of slack in the labor market.
A new paper by Dartmouth College professor David Blanchflower and International Monetary Fund adviser Andrew Levin tried to estimate the level of labor market slack. The paper, written for the Full Employment project of the Center on Budget and Policy Priorities, looks at measures of slack by breaking them down into three different gaps: the unemployment gap, the labor force participation gap, and the underemployment gap.
The unemployment gap is the difference between the current unemployment rate and estimates of the unemployment rate when the economy hits equilibrium. The participation gap is the difference between the current labor force participation rate and the rate that would have occurred if long-run trends such as the aging of the Baby Boomers continued without the Great Recession having occurred. And finally, the underemployment gap is the percentage of the workforce that is working part-time but would like to work full time.
When it comes to all three gaps, Blanchflower and Levin find evidence of remaining slack. First, they figure that estimates of the long-run unemployment rate will continue to drop, meaning that there’s more space for the unemployment rate to drop before the U.S. economy hits full employment. Second, they believe the labor force participation rate has room to increase even as these demographic changes continue to affect the labor market. And third, the two authors expect a considerable amount of workers to still want to move to full-time employment from part-time jobs.
Furthermore, the still weak amount of wage growth is a good sign that all of these figures can go lower before wage growth really picks up, the authors conclude, meaning the labor market has more healing left to do, according to their analysis of previous data.
Yet Federal Reserve Chair Janet Yellen says that stronger nominal wage growth (before factoring inflation into the mix) is not a prerequisite for interest rate increases. Wage growth could continue to be flat and the Fed may still go head and raise interest rates. What would be the cost if wage growth stalls out? There would be many, but one consequence given recent debates might be a smaller share of income going to labor.
Given the Fed’s long-run inflation target of 2 percent and a long-run estimate of labor productivity of about 1.5 percent, nominal wage growth has to be at least 3.5 percent to keep the shares of income going to labor and capital constant. So wage growth that’s stuck below that level, say at about 2 percent, would result in the continuing redistribution from labor to capital over the past three decades.
Of course, an interest rate hike this year is not set in stone. And wage growth may soon start to accelerate. Or the Fed might raise rates only a small bit before waiting for more increases. Regardless, it’s vital to keep the costs of premature tightening in mind as the rest of the recovery plays out.
Morning Must-Read: Dean Baker: The Housing Bubble and the Financial Crisis #25,452
…it’s hard to see a candidate. Brad’s pick of non-residential investment doesn’t hold water. Perhaps we can claim a bit better picture on net exports if people had not turned to the dollar as a safe haven, but this involved many factors other than the financial crisis. Also, the conscious decision of foreign cental banks to prop up the dollar to sustain their export markets has to swamp this effect. I stand by my housing bubble assessment.
Morning Must-Read: Ed Glaeser and Charles Nathanson: An Extrapolative Model of House Price Dynamics
…momentum at one-year horizons, mean reversion at five-year horizons, and excess longer-term volatility relative to fundamentals. Valuing a house involves forecasting the current and future demand to live in the surrounding area. Buyers forecast using past transaction prices. Approximating buyers do not adjust for the expectations of past buyers, and instead assume that past prices reflect only contemporaneous demand, as with a capitalization rate formula. Consistent with survey evidence, this approximation leads buyers to expect increases in the market value of their homes after recent house price increases, to fail to anticipate the price busts that follow booms, and to be overconfident in their assessments of the housing market.