Munk School Trans-Pacific Partnership Conference: Geopolitics Panel
Revised and Extended: I could now talk about the risks of the Trans-Pacific Partnership. You have already heard a lot about the risks in the previous session here. You have heard about dispute resolution and about intellectual property. You have heard about instituting largely-untested dispute resolution procedures in such a way that they will be very difficult indeed to amend or suspend or replace or adjust in the future.
We all know very well the eurozone’s ongoing experience. We remember that the euro single currency is in its origins a geopolitical project. We remember the origins of the eurozone at Maastricht—the decision of the great and good of Europe that something needed to be done to bind Europe more closely together in the wake of the absorption into the Bundesrepublik of the German East and the collapse of the Soviet Empire. The creation of a single currency was clearly something.
But “we must do something; this is something; therefore we must do this” is a very dangerous syllogism to serve as a basis for any form of technocratic government. The inability of Europe to back itself out of and adjust away from unwise commitments made in the founding of the euro has not been a source of sunny happiness and light in Europe over the past now-eight years.
We all remember that, back in the late eighteenth century, the United States Constitution was at the very forefront of the most advanced intellectual thinking in its ultra-modern and ultra-aggressive innovation policy. The inclusion in the founding constitutional document itself of profound intellectual property protections—the power to by law reserve rights to make and use inventions and discoveries “for a term of years” in order to encourage the useful arts and sciences—was a bold step. But the bold step stopped before writing down the number of years for which rights were to be reserved. The term of intellectual property protection was left to the discretion of the legislature: either none whatsoever, or one day, or seven years, or as long as would encourage inventive and innovative activity—that was for the legislature to decide and revisit and revise as it wished.
We all remember how, back at the end of World War II, John Maynard Keynes and Harry Dexter White at Bretton Woods set about constructing their piece of the international economic institution. Keynes and White, however, did not hard-code policies and quantities into an effectively-unamendable treaty. Rather, they constructed agencies. And they then gave them discretion.
My last trip outside the United States before this trip to Toronto was a trip last December to the Rockefeller villa in Bellagio, Italy, on Lake Como—a trip to discuss Thomas Piketty’s Capital in the Twenty-First Century. Piketty writes about how it is the nature of capitalism that plutocrats and entrepreneurs invest not just in productive capital and beneficial technologies but in political influence in order to rejigger the system of property rights in order to acquire and protect economic rents. How much of what is in the TPP is part of that process rather than a good-faith technocratic effort to construct a better international trade, investment, innovation, and intellectual property-mobilization system for us frogs who live around the pond that is the Pacific Ocean?
All these considerations suggest that the TPP poses considerable risks as a leap into the untested dark. We do not know much about how these dispute and intellectual property provisions will actually work on the ground. And I have no idea how, in a decade, the negotiators of TPP anticipate backing-out of TPP’a mechanisms if on a decade they change their mind about their desirability.
Alternatively to the risks, I could now talk about the potential benefits of the TPP. We heard much less about those in the previous panel.
I could talk about how productivity depends on the division of labor, and the division of labor depends on the extent of the market, and the global trans-Pacific market is the largest we can find—or would, if it included China. I could talk about the benefits of economic integration both in enabling productivity-boosting specialization and incentivizing innovation. I could back up into political economy. I could quote James Madison on how the legislatures of Republican government are always prone to the disease of faction—rent-seeking by special interests—how one important cure for faction is extent of territory that reduces the relative power of each particular faction, and how a set of economic rules that spans an economy the size of the Pacific Ocean will be less vulnerable to rent-seeking by interests that would otherwise merely have to capture the legislature of one national government.
I could talk about how there is $4 trillion in present value in net static economic gains to the trans-Pacific economy from the TPP. And I could point out that those gains are static gains: they do not include the effects of any of the many invention, innovation, investment, spread of ideas, or political-economy virtuous circles that such a $4 trillion productivity boost would produce. I could conclude with observations about how static estimates tend to lowball our assessments of the gains—that the differences between more and less free-trade economies are vastly greater, and the share of those differences plausibly attributable to openness to world trade substantially greater, than estimates produced by the types of calculations that underpin the $4 trillion number.
I could then conclude with reflections on on model building and the estimation of the effects of trade deals. That conclusion would start with a reminiscence of a day in 1994: I was sitting in my office in the US Treasury, just before the start of the lame-duck session that was to pass the Uruguay Round. One of then-Treasury Secretary Lloyd Bentsen’s consiglieri walked into my office. He said: “Brad! Your task is to get the Economist to endorse the Uruguay round as a $1 trillion global tax cut! Then no Republican will dare oppose it!” And I found that Robert Cumby and I could indeed do it, and do it relatively straightforwardly.
But this is not a panel on the risks of TPP. This is not a panel on the benefits of TPP. This is not a panel on increasing-returns models and the assessment of trade deals. This is, indeed, not a panel on the political economy of trade policy in the U.S. in the 1990s.
This is a panel on geopolitics.
So let me talk about geopolitics.
And let me talk about the geopolitics of managing our relationship with the immense rising superpower across the great ocean to our west.
(1) Rising superpowers always believe they have the key to the riddle of history. They believe that history is about to reveal that their system is the best, and their elites are extremely unwilling to take even the best-intentioned advice from abroad on how to constitute their internal arrangements. They in fact believe that other countries should learn from them, and adopt their systems—even though, as rising superpowers, they do not or do not yet seek to impose their systems on others.
(2) Rising superpowers have a profound dislike of potentially-hostile bases near their borders, and a profound dislike of other powers’ interfering in what they think manifest destiny has decreed is their sphere of influence. They make their neighbors nervous.
(3) Rising superpowers almost always have territoria irridentia: regions that they believe ought to be under their control, and that only malign manipulations by other powers and historical accidents have left outside their current borders.
(4) Rising superpowers are overwhelmingly focused on making the world economy and society work for them and for their ruling classes.
And (5) managing your relationship with a rising superpower, doing as much as possible to align its and its elite’s core interests with yours, and then appeasing those core interests that cannot be so aligned, is your most important foreign-policy task and objective not just for one but for many generations.
I am, of course, speaking about Henry John Temple and [John Russell2, the third Viscount Palmerston and the first Earl Russell. Lord Palmerston and Lord John Russell were the British Whig mid-nineteenth century grandees who led the multi-generational pivot of the Whig, the Tory, and the subsequent Liberal administrations with respect to the British Victorian-era grand-strategic problem of how to deal with the rising superpower across the great ocean to the west that was the United States.
The mid-nineteenth century United States of America was a rising superpower, aggressively confident of its system. It was, in the words of John Quincy Adams: “the well-wisher to the freedom and independence of all… the champion and vindicator only of her own… [advancing the general cause] by the… sympathy of her example.” Great Britain had nothing to teach, the Americans thought, but rather should admire and learn.
What the rising superpower of the United States would not countenance was hostile bases, or perhaps I should say additional potentially-important hostile bases, anywhere near her borders. The Monroe Doctrine was evolved long before the United States could even begin to enforce it. And the United States certainly did not seek formal empire over Latin America. But it would react aggressively and with hostility to any European power’s intrusion into Latin America. And it would, eventually, seek, in Woodrow Wilson’s words, “to teach the South American republics to elect good men.”
And what rankled the United States in the mid-nineteenth century was the territoria irridentia of Canada—especially British Columbia: “54°40’ or fight!” was the American position on where the northern border of America’s claim to the Oregon Territory should be set. Plus there was the rest of Canada.
But the United States could be guided, and could be very comfortable in a British navy-protected free-trade political-economic order that allowed it to prosper and grow. And the interests of it and its elite could be brought into alignment, in at least major outlines, to the essential strategic interests of Imperial Britain.
In the 1840s, therefore, the Whig government of Lord Palmerston and Lord John Russell did a very unusual thing. The typical way for Victorian Britain to settle a dispute like that of the 1840s over the Oregon Territory would have been to adopt the negotiating strategy of sending a Canadian army and the British navy to burn down the negotiating counterparty’s capital, followed by a dictation of terms. Britain did not do that. It compromised: agreeing to an extension of the latitude line that had previously defined the southern border of Alberta, Saskatchewan, and Manitoba.
In the 1860s, therefore, the Whig government of the Earl Russell and Lord Palmerston did a very unusual thing. Usually Victorian Britain’s commitment to freedom of trade and the seas was lexicographically preferred to all other principles. One could argue over the rights and wrongs of addicting millions of China’s citizens to opiates through the drug trade. But interfering with commerce by seizing and destroying the property of British merchants—even property in the form of opiates—was beyond the pale, and cause for war. Fight first for free trade and protection of property, and deal with the other equities later. But that was not the line taken by the Whig government with respect to the cotton trade during the U.S. Civil War. The line was drawn not at interfering with British ships carrying cotton but at taking Confederate diplomats off of British ships.
And, thereafter, successive British governments, investors, noblemen and noblewomen, merchants, and manufacturers strove mightily to bind the United States to Britain. Material common economic interests and mutual economic interdependence grew. Conflicting political ideal interests fell away. Back in 1775 a core political interest of the United States-to-be was the conquest of Quebec, and Benedict Arnold’s army was sent north. Back in 1812—and for decades thereafter—a core political interest of the United States under James Madison was the conquest of Quebec, and fleets were duly built on the Great Lakes and then duly sunk by Canadian cannon. A very powerful ideal interest back then.
But what U.S. citizen today feels a pain at the thought that Toronto lies north of the U.S. border? I know I do. I look around this room. and it is painful to me that the Rt. Hon. Chrystia Freeland is Her Canadian Majesty’s Minister of International Trade in Ottawa. I wish she were not in Ottawa but in Washington. I wish she were the eloquent and influential Senator Chrystia Freeland (D-South-Central Ontario). U.S. politics would be much healthier were that the case. But I am unusual. And I digress…
The binding of the rising superpower back in the nineteenth century had many policy and non-policy parts, not all of them conscious or deliberate. but whether it was Cecil Rhodes’s offering free acculturation at Oxford to young members of the American elite, British investors entrusting the House of Morgan with their money, the Dukes of Marlborough offering their sons to daughters of plutocrats Consuelo Vanderbilt and Jenny Jerome, it was effective—so effective that just when Nazi Germany attacked the Franco-British army in 1940 the Prime Minister of Britain was a man who, as a natural-born citizen of the United States, was also perfectly well-qualified to be the American president.
This alignment of American interests and values to British took a long time—from 1850 and 1910: economic ties, cultural ties, plus political ties of mutual deference where strategic issues were at stake. But, as a result, by 1910 Americans by and large perceived Britain as their friend, and the British Empire as by and large a force for good in the world, and its interests as closely-aligned with theirs. This is in striking contrast to how Imperial Britain was perceived in 1850: as the cruel and corrupt ex-colonial power, the heartless aristocrats who had just starved a quarter of all Irishmen to death.
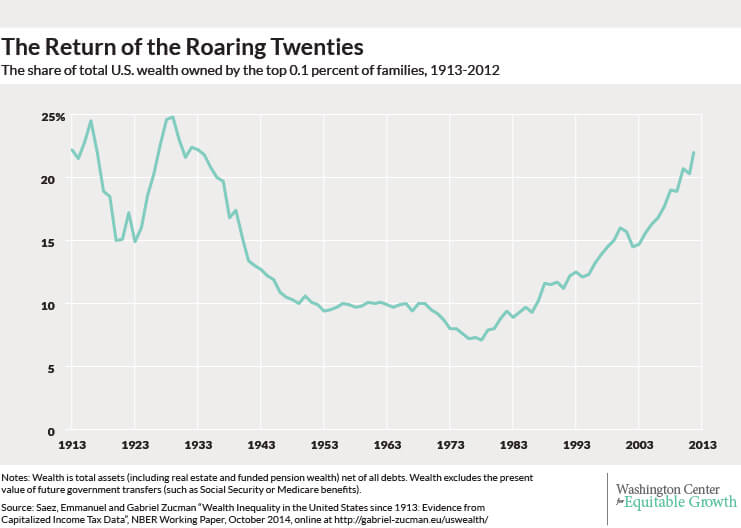
This mattered a lot. And this mattered a lot not just for the wave of prosperity produced up through 1913 by the coming of the Second Industrial Revolution and the First Great Globalization.
This mattered a lot for grand-geostrategic reasons as well. This meant that when Britain got into trouble in the twentieth century—as it did, first with Wilhelm II Hohenzollern and his ministers, second with Adolf Hitler, and third with Josef Stalin and his successors—it had wired aces as its hole cards in the poker game of seven-card stud that is international relations. The willingness of the United States to send Pershing and his army Over There, to risk war with and then to fight Hitler, and to move U.S. tanks from Ft. Hood, TX, to the Fulda Gap. These were all powerfully motivated by America’s affinity with Britain, its geostrategic causes, and its security. And these allowed Britain to punch far above its economic and military weight from 1917 on.
How does this apply to the TPP?
Just like Lord John Russell and Lord Palmerston in the 1840s and thereafter, we face a rising superpower across the ocean to our west. There is a good chance that China is now on the same path to world preeminence that America walked 130 years ago. Alexis de Tocqueville could project before the Civil War that the U.S. and Russia were likely to become twentieth-century superpowers. We can project today that at least one of India and China–perhaps both–will become late-twenty first century superpowers. We have an interest in building ties of affinity now.
My old Harvard professor Benjamin Friedman’s The Moral Consequences of Economic Growth argues that the wiring of human brains is such that the process of becoming richer relative to the reference point provided by our parents and their peers has a large number of beneficial moral as well as material effects. Modern societies are like bicycles: they move forward, or they fall over. Come 2047 and again in 2071 and in the years after 2075, the NATO powers are going to need China and China’s elite to believe and to have material and ideal interests broadly aligned with those of NATO. Thus there is nothing more dangerous for America’s future national security and nothing more destructive to America’s future prosperity than for Chinese schoolchildren to be taught in 2047 and 2071 and 2075 that America tried to keep the Chinese as poor as possible for as long as possible. There is little more dangerous to the NATO powers than a Chinese elite whose values and interests are not broadly consonant with those of America. And there is nothing more conducive to aligning the interests of China and its elite with those of the NATO powers than a China which is (a) growing richer, (b) increasingly entranced by the economic and cultural successes of North Atlantic civilization, (c) treated with respect, and (d) incentivized to strive for victory not in negative-sum military power but in positive-sum economic and technological games of international relations.
The big geostrategic danger, I think, is of a Wilhelmine China. Wilhelmine Germany was a rising economic superpower ruled by a class that had lost its social role. Faced with internal dissent, it contemplated busying giddy minds with foreign quarrels as a way to distract popular attention from internal problems and debates. Needless to say, this ended in total disaster for generations of Germans. But is China’s East China Sea Air Defense Identification Zone and its adventurism in the South China Sea an attempt to cheaply accomplish the primacy-of-internal-politics foreign-affairs strategy that Shakespeare’s Henry IV Lancaster recommended on his deathbed to his son the future Henry V? And, if so, how to lead China’s elite to the realization that, in the words of the computer in the movie “War Games”: “The way to win this game is not to play”?
This is the broadest context in which the North Atlantic—and Asian-Pacific Rim, and Australasian—discussion of the TPP ought to be set.
3360 words