Must-reads: February 27, 2016


Must-read: Paul Krugman: “Romer and Romer on Friedman”

Must-Read: IMHO, Paul Krugman should have had not two but four parting observations:

  1. Primaries are valuable testing grounds for candidates’ ideas and teams, which is a point he makes.
  2. It’s dangerous to believe something because it is what you want to hear, which is a point he makes.
  3. A point he doesn’t make but should: If you believe that hysteresis is not a one-way ratchet–that it is as easy to boost potential via a high-pressure economy as to destroy it via prolonged depression–Sanders’s stimulus plans are underpowered by a factor of four.
  4. A point he doesn’t make but should: If you believe–which I do–that so far hysteresis has only gobbled about two-thirds of the gap between current production and the pre-2008 trend, then Sanders’s fiscal stimulus plans are about the right size–and HRC’s are much too small.

Paul Krugman: Romer and Romer on Friedman – The New York Times: “Two parting observations, however:

First, aren’t you glad not to see a candidate leading with his chin this way in the general election?

Second, this is an object lesson in the dangers of believing something because it’s what you want to hear. And that’s a lesson that applies to a lot more than economic growth projections.

Weekend reading: A closer look at skill-biased technological change, carbon taxes, and more

This is a weekly post we publish on Fridays with links to articles that touch on economic inequality and growth. The first section is a round-up of what Equitable Growth has published this week and the second is work we’re highlighting from elsewhere. We won’t be the first to share these articles, but we hope by taking a look back at the whole week, we can put them in context. 

Equitable Growth round-up

The theory of skill-biased technological change is often used to explain the current rise in income inequality. But what about the differential rise in the very top incomes across countries? As Matt Markezich explains, “a purely technological explanation cannot explain all of the variance in the change in top incomes across rich countries.”

Environmentalists in the United States have long been proposing a carbon tax—that is, a tax on the carbon contents of goods and services—to fight the carbon dioxide emissions that are increasing greenhouse gas levels and in turn worsening climate change. What does all that have to do with equitable growth? Kavya Vaghul breaks it down.

New Hampshire’s median wage for full-time workers is $20.38 an hour, which ranks 13th among U.S. states. But the state also has the lowest minimum wage in the country, at $7.25 an hour. Ben Zipperer explains why New Hampshire has more opportunity now than most other states to raise the minimum wage.

Links from around the web

It’s time to rethink higher education and inequality. Rachel Cohen interviews Equitable Growth’s Marshall Steinbaum on this topic, with a focus on the student debt crisis, the “skills gap” narrative, segregation in higher education, and more. [american prospect]

The more education someone has, the higher their lifetime earnings will be on average. As such, many see increasing college education as a way to fight poverty and income inequality and improve social mobility. Brad Hershbein, however, shows that those who are raised in or near poverty end up seeing a lesser return on their college degree. [brookings]

“What if simply throwing more money at schools actually is a reasonable approach” to improving them? That’s the question Jordan Weissmann asked this week, citing two recent studies showing a positive relationship between more primary and secondary public school funding and increased student achievement. [slate]

When Federal Reserve Chair Janet Yellen gave her semiannual testimony on Capitol Hill earlier this month, multiple lawmakers reminded her that the U.S. economic recovery hasn’t extended evenly across racial lines. Ylan Q. Mui delves into the “complicated relationship” that the Fed has with race. [wa post]

Across the globe, there’s a clear disparity between how men and women spend their time. While men spend more of their time working for money, women do more of the unpaid chores such as cooking, cleaning, and child care. Claire Cain Miller explores this imbalance across countries. [ny times]

Friday figure

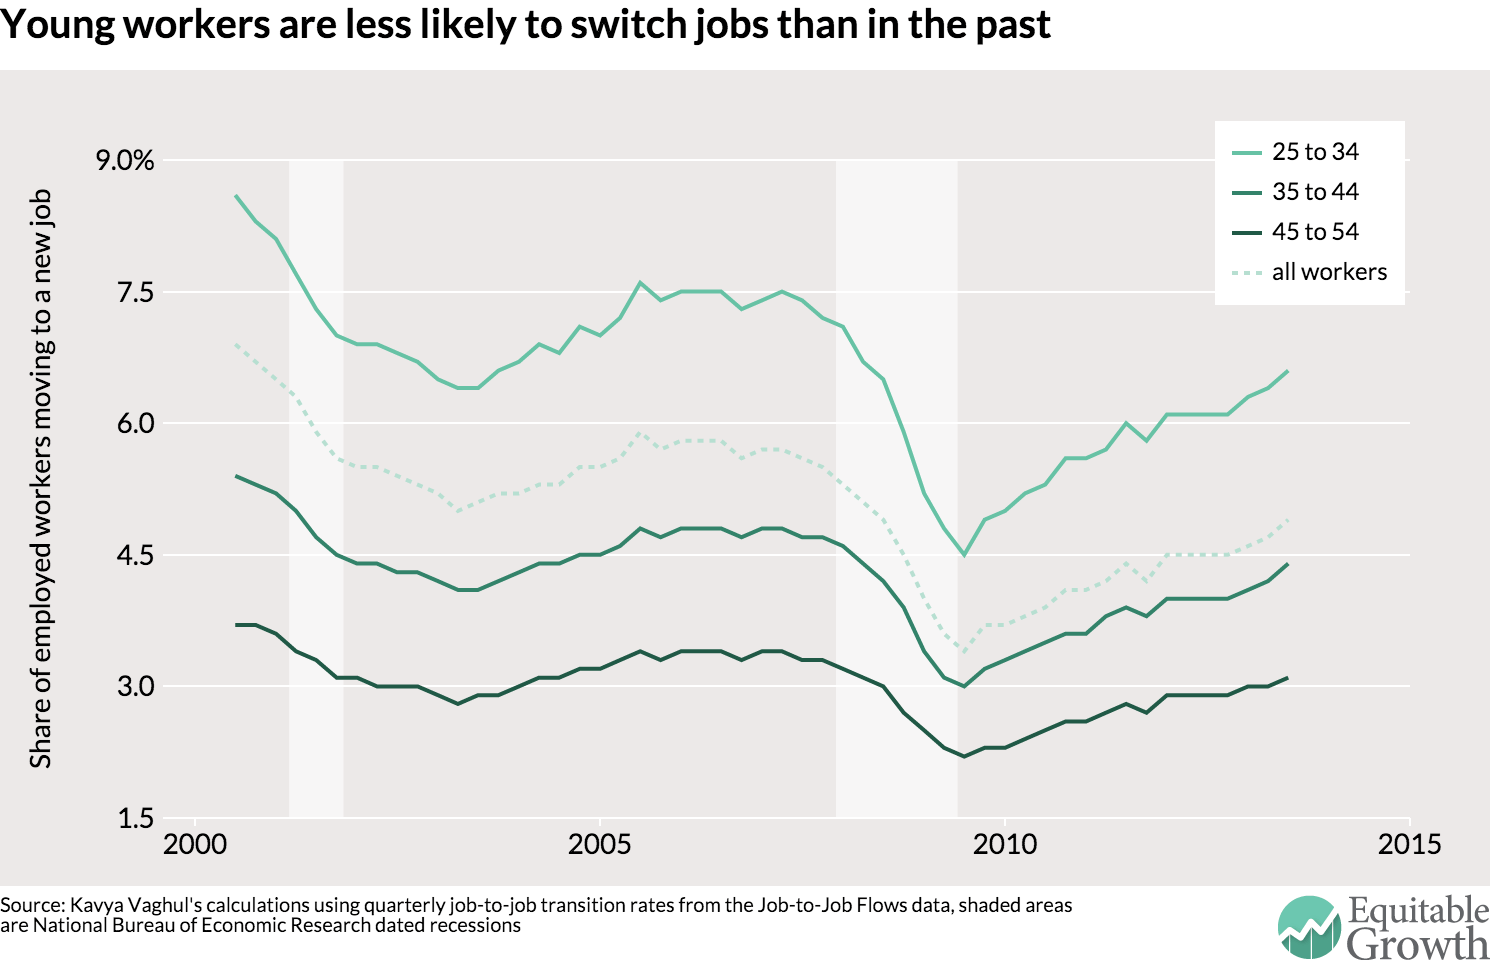
Figure from “Why it’d be nice if the ‘job-hopping’ Millennial story were true” by Nick Bunker.

History shows why New Hampshire has room for higher minimum wages

The New Hampshire State House in Concord, New Hampshire. (photo by Flickr user “cmh2315fl”)

(This column is based on a presentation to the 2016 New Hampshire Fiscal Policy Institute conference.)

New Hampshire is a relatively high-wage state: Its median wage for full-time workers of $20.38 an hour ranks 13th in the United States. But it also has the lowest minimum wage—$7.25 an hour—in the nation. As a result, New Hampshire has more opportunity now than most other states to raise its minimum wage.

To evaluate what would be an appropriate minimum wage for New Hampshire, we can look at the ratio of the minimum wage to the state’s median wage for full-time workers. How this measure of the “bite” of the minimum wage has ranged over time gives us a good sense of how far the minimum wage has cut into the state’s underlying wage distribution. Assuming underlying inequality stays the same, higher minimum-to-median-wage ratios indicate that any earnings and employment effects of minimum-wage increases could be larger, since a greater share of the workforce would be affected by the minimum wage.

Figure 1 shows how the minimum-to-median wage ratios in both New Hampshire and the United States as a whole have changed since 1979, the earliest point for which we have comparable data. Today, the bite of the minimum wage is lower in New Hampshire than in most states. New Hampshire’s minimum-to-median wage ratio last year was 35.6 percent, below the national average ratio of 41.2 percent. With relatively high median wages but following the lowest, federal minimum wage, New Hampshire’s minimum-to-median wage ratio is the fourth-lowest of any state.

Figure 1
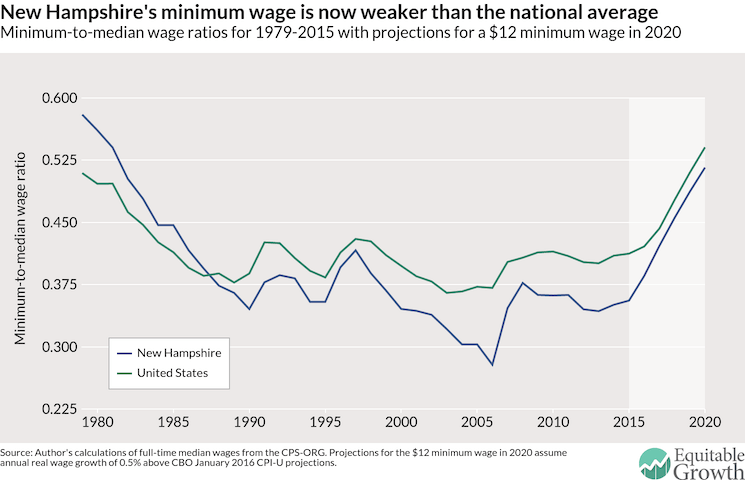
 

But as Figure 1 illustrates, this was not always the case. In the late 1970s and early 1980s, relatively low wages in New Hampshire caused the state’s minimum wage to bind much more strongly—that is, to be closer to the median wage. New Hampshire’s minimum-to-median wage ratio in 1979 was 58 percent, well above the national ratio at that time of 50.9 percent.

A low bite now and a high bite in the past suggests that New Hampshire has more room to raise minimum wages than other states. Figure 1 also shows what future minimum-to-median wage ratios would look like were the nation and New Hampshire to adopt a $12 minimum wage by 2020. (Since we don’t know what wage growth will be over the next five years, these projections assume annual wage growth of 0.5 percent above the Congressional Budget Office’s projected inflation.) The bite of the minimum wage would rise substantially in New Hampshire to 51.6 percent, significantly below the state’s bite in 1979 and similar to the national bite at that time. These figures suggest that New Hampshire has already experienced minimum-to-median wage ratios equivalent to what the state would see with a $12 minimum wage in 2020.

Since we don’t have a solid handle on the effects of high minimum wages in the 1970s, we can turn to a different evidence base that many economists hold as a standard for evaluating the causal effects of minimum wage policies. A set of papers by Arindrajit Dube of the University of Massachusetts Amherst, Michael Reich of the University of California, Berkeley, and T. William Lester of the University of North Carolina at Chapel Hill makes careful comparisons between areas with different minimum wages by contrasting nearby counties that straddle state borders and therefore have different minimum wages. Using the cross-border county research design, these studies estimate employment effects for teens and restaurants that are small and statistically indistinguishable from zero.

We can use the range of the bite in these border counties to understand which minimum-to-median wage ratios overlap the evidence base that shows no significant trade-off between raising wages and employment. (See Figure 2.)

Figure 2
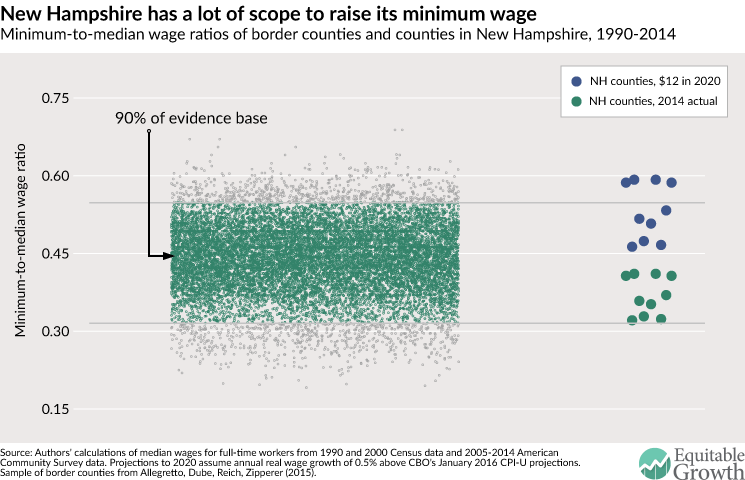
 

The left side of Figure 2 illustrates the set of minimum-to-median wage ratios during 1990 to 2014 for counties in cross-border discontinuity studies of restaurant employment. These range from about 19 percent to 69 percent, but 90 percent of the sample falls between about 32 percent and 55 percent. The right side of Figure 2 displays minimum-to-median wage ratios for New Hampshire’s 10 counties in 2014—the latest year for which data are available—as well as their bite in 2020 under a $12 minimum wage. Under this policy, New Hampshire’s counties would rise from having a bite at the low end of the spectrum to having a high bite relative to the 1990–2014 evidence base. Ranging from 46.3 percent to 59.2 percent, a majority of counties would fall squarely within the range of minimum-to-median wage ratios, but some low-wage counties have bites that fall above the bulk of the evidence base.

Compared to the longer, historical evidence in Figure 1, all of the New Hampshire counties with a $12 minimum wage in 2020 have minimum-to-median wage ratios near or substantially below the state ratio of 58 percent in 1979. New Hampshire’s labor market therefore has a great deal of room to accommodate much higher minimum wages.

Must-read: Christina D. Romer and David H. Romer: “Senator Sanders’s Proposed Policies and Economic Growth”

Must-Read: Christina D. Romer and David H. Romer: Senator Sanders’s Proposed Policies and Economic Growth: “According to an analysis by Gerald Friedman…

…Senator Sanders’s proposed policies would result in average annual output growth of 5.3% over the next decade, and average monthly job creation of close to 300,000. As a result, output in 2026 would be 37% higher than it would have been without the policies, and employment would be 16% higher. Although we share many of Senator Sanders’s values and enthusiastically support some of his goals, such as greater public investment in infrastructure and education, we also believe it is vitally important to be realistic about the impact of policies on the performance of the overall economy.

For this reason, it is worth examining Friedman’s analysis carefully. Moreover, Friedman has made available an extensive report describing his methodology and assumptions, allowing others to examine the specifics of his analysis. Unfortunately, careful examination of Friedman’s work confirms the old adage, “if something seems too good to be true, it probably is.” We identify three fundamental problems in Friedman’s analysis.

  1. All the effects of Senator Sanders’s policies that he identifies are assumed to come through their impact on demand. However, his estimates of those demand effects are far too large to be credible—even given Friedman’s own assumptions.
  2. In assuming that demand stimulus can raise output 37% over the next 10 years relative to the Congressional Budget Office’s baseline forecast, Friedman is implicitly assuming that the U.S. economy is (and will continue to be for a long time) dramatically below its productive capacity. However, while some output gap likely still exists, the plausible range for the output gap is much too small to accommodate demand effects nearly as large as Friedman finds. As a result, capacity constraints would likely lead to inflation and the Federal Reserve raising interest rates long before such high growth rates were realized.
  3. A realistic examination of the impact of the Sanders policies on the economy’s productive capacity suggests those effects are likely to be small at best, and possibly even negative…

Must-read: Willem Buiter: “Citi: Increasing chance that winter is indeed coming”

Must-Read: Willem Buiter: Citi: Increasing chance that winter is indeed coming: “The growing threat to the global outlook rests on poor fundamentals…

…which include the pre-existing fragilities related to the structural and cyclical slowdowns in China and its unsustainable currency regime, broken EM growth models, excessive leverage across many countries and sectors, and rising regional risks (Brexit) and geopolitical risks (including in Russia, Turkey and Syria, the South China Sea, and North Korea). These fundamental concerns are aggravated by a crisis of confidence that is in part fuelled by a growing worry that, should conditions deteriorate, they may not elicit an effective policy response. The main ‘game changers’ in our view are the emerging belief that even the US economy is no longer bullet-proof and that policymakers (in the US and elsewhere) may not be there to come to the rescue of their own economies, let alone the world economy, by propping up asset prices and aggregate demand…

David Keohane comments:

Obviously this is heavily caveated by Citi — and they lay out a US bull case — but the gist is that their forecast for ‘US growth in 2016 has meanwhile gone from 3.0% in January 2015 to 2.0% most recently’…. They emphasis that any material slowdown in the US economy would make it tough going for the rest of the world, and think that the barriers to Yellen in easing are higher than occasionally appreciated:

in part because it has just raised its policy rate for the first time since 2006 and in part because all of its easing options are perceived to be of limited effectiveness in boosting real economic activity or are associated with non-negligible costs (including political costs)….

Finally, they say, unshockingly, that the chances of a major fiscal stimulus are… not good…

Must-read: Philip Delves Broughton: “US voters rage against potholed roads and poisoned water”

Must-Read: Philip Delves Broughton: US voters rage against potholed roads and poisoned water: “Remember Thomas Piketty?…

…That Don Quixote of capitalism, the French economist who rode out of Paris in 2013 to assail rising inequality in the western world? The response among the Davos class was to look interested and raise vague doubts about his calculations. But this election season in the US is starting to look like Mr Piketty’s revenge. Inequality in all its guises has become the driving theme for the leading candidates of both parties, and it is confounding the Democratic and Republican establishments. When they hear Beyoncé’s ‘Formation’, with its strong message about racism in America, it is not that they do not recognise the tune. They do not even recognise it as music….

The sorry tale of the water supply in Flint, Michigan…. Prevention would have cost $100 a day, which seemed too much to those in power. As a result, hundreds of children were exposed to lead poisoning, with potentially life-long consequences. Would such a crisis have been allowed to happen in Greenwich, Connecticut, or Palo Alto, California? And if it had, would the response have been different? To borrow from Sarah Palin: you betcha…. What is fuelling the anger in this election season is a sense of social tragedy, of which decrepit bridges, potholed roads and poisoned water are the evidence. The word infrastructure causes panic among deficit hawks…. This is part of the reason why President Barack Obama’s latest efforts to raise money for infrastructure through a tax on crude oil are unlikely to succeed. But if you use America’s roads, airports or public transportation systems, you quickly see the problem….

Hillary Clinton has not made many great decisions in this campaign, but going to Flint was a good one. The candidate who makes the link between investing in American infrastructure and reducing inequality is going to win a lot of votes.

Must-read: Andy Harless: “Answering @rortybomb on why potential output has fallen”

Must-Read: Andy Harless: “Answering @rortybomb on why potential output has fallen…

https://t.co/rZHIRGaHt5: 1. Hysteresis. Theoretically reversible, but Fed won’t let US run well above capacity for a long time (unless Bernie appoints @mattyglesias). 2. Beveridge curve shift. Don’t know why it happened, but no reason to think Bernie’s policies would reverse it. 3. Guessed wrong on underlying productivity growth. 1995-2005 was a fluke. No way Bernie’s policies get us retroactively back to old guess. 4. Guessed wrong on demographics by ignoring interaction w business cycle & not realizing at the time that 2007 was a major peak. FWIW the hysteresis thing shows one reason to favor (in this case, retroactive) NGDPLT: allows maximum reversal w/o losing LR credibility…

Must-read: Justin Wolfers: On Twitter

Must-Read: I have only one critique of Justin Wolfers’s series of tweets here. He says that they are simple math errors. It is true that they are conceptually simple. But getting all this right is not easy–I have seen Alan Blinder get it wrong (in the context of a $12B surge in inventories in a single quarter, and its effect on real GDP growth rates) at a blackboard in his OEOB office during the Clinton administration[1].

This does explain a puzzle. As somebody-or-other said in the conversation, if you believe with Gerry Friedman that all of the shortfall in real spending growth since 2007 can be easily recaptured via demand channels alone, then Sanders’s proposals are at most one-third the size that they should be–and that is the critique that Friedman should be making of Sanders given Friedman’s beliefs about aggregate supply. (Since I do not share those beliefs, I think Sanders’s fiscal stimulus proposals are about right-sized):

Justin Wolfers: On Twitter: “Romer and Romer find what look like…

…simple math errors–confounding level effects and changes–in Gerry Friedman’s analysis: https://evaluationoffriedman.files.wordpress.com/2016/02/romer-and-romer-evaluation-of-friedman1.pdf

Here’s the problem: Fiscal stimulus raises spending: ↑ΔG today → ↑ΔY. But then [once the government purchase] stimulus ends: That’s a big ↓ΔG tomorrow → ↓ΔY. Long run effect ≈ 0. Or if redistribution leads to more spending: Big ↑Δspending today. But then no further Δspending. Long-run raises level of GDP but not growth…. (Their economics checks out, obviously):

Christina D. Romer and David H. Romer: Senator Sanders’s Proposed Policies and Economic Growth: “We have a conjecture about how Friedman may have incorrectly found such large effects…

…Suppose one is considering a permanent increase in government spending of 1% of GDP, and suppose one assumes that government spending raises output one-for-one. Then one might be tempted to think that the program would raise output growth each year by a percentage point, and so raise the level of output after a decade by about 10%. In fact, however, in this scenario there is no additional stimulus after the first year. As a result, each year the spending would raise the level of output by 1% relative to what it would have been otherwise, and so the impact on the level of output after a decade would be only 1%.

[1] Not, mind you, that I got it right back then–I had to go back to my Treasury office, think about it, and then do it three times. $12B was only 0.2% of what was then a nominal GDP level of $6000/year. But that $12B was four times as great a share of that quarter’s GDP: 0.8%. And if GDP jumps by 0.8% from one quarter to the next, that is a +3.2%/year jump in the growth rate of GDP. There is thus an amplification by a factor of 16 as we go from the raw change in inventory stocks in a quarter to the real GDP growth rate. But at the blackboard we were all saying it was either a factor of one or a factor of four…