…in the twentieth-century United States, and through it, a revised portrait of modern American governance. The book begins amid the Great Depression, with the insertion of federal money and federal rules into what had been a highly decentralized system of poor relief. Reformers hoped to use federal funds to ‘modernize’ that system – to make it more bureaucratic, centralized, expert-driven, and uniform. Drawing on original archival research, States of Dependency traces the fate of these efforts. The book analyzes federal administrators’ encounters with traditions of localism, federalism, and hostility toward the ‘undeserving poor.’ It also links these encounters to particular tactics, such as the mobilization of rights language and the use of strategic litigation. The result, four decades later, was a more legalistic and federalized public welfare apparatus, as well an expanded definition of national citizenship, but also a system of governance that sanctioned and perpetuated vast inequalities.
…This is the argument of a paper by academics at Oxford university…. February was the warmest month on record. The current El Niño–the warming of the global climate triggered by the Pacific Ocean–has boosted temperatures, just as it did in 1997-98…. Two forms of inertia govern climate policy…. Infrastructure in power generation… is long-lived…. Carbon dioxide remains in the atmosphere for centuries. Thus it is necessary to think not of annual flows but of cumulative emissions or of a global carbon budget…. Within power generation itself, there are four options. The first would be a more or less immediate shift to zero-emissions technologies. The second would be retrofitting of conventional capacity with carbon capture and storage. The third would be to replace new capital stock with zero-emissions capacity early in its life. The last would be early introduction of technologies to remove atmospheric stocks of carbon….
Far from having years to work out how to curb the risks of climate change, we face an imminent moment of truth…. After last year’s Paris climate conference, the world congratulated itself on having agreed a new process, even though real action was postponed. Yet, given the longevity of a large part of the capital stock, the time for decisive change is right now, not decades in future. But the world is not really serious about climate, is it? It prefers fiddling while the planet burns.
Wladimir S Woytinski: [World commerce and governments: Trends and outlook](http://www.amazon.com/World-commerce-governments-Trends-outlook/dp/B0006AU7CA/
Must-Read: I do not understand China. But it now looks more likely than not to me that Xi Jinping’s rule will lose China a decade, if not half a century…
The Economist: Chairman of Everything: “Two curious articles appeared in government-linked news media…
…The first [was] written in an allegorical style traditionally used in China to criticise those in power, in this case in the form of an essay praising the seventh-century emperor, Taizong, for heeding a plain-talking courtier… [and] called for more debate and freer speech at a time when China’s president, Xi Jinping, has been restricting both. ‘The ability to air opinions freely often determined the rise and fall of dynasties,’ it said. ‘We should not be afraid of people saying the wrong things; we should be afraid of people not speaking at all.’ The second article, in the form of an open letter, ran—fleetingly—on a state-run website. ‘Hello, Comrade Xi Jinping. We are loyal Communist Party members,’ the letter began. It called on Mr Xi to step down and eviscerated his record in office. The president, it said, had abandoned the party’s system of ‘collective’ leadership; arrogated too much power to himself; sidelined the prime minister, Li Keqiang; caused instability in equity and property markets; distorted the role of the media; and condoned a personality cult….
The historical essay was reposted on the disciplinary commission’s website (where it remains); it was clearly more than the work of a single disgruntled editor. The letter may have been planted by a lone dissident who managed to hack into an official portal, but it raised many eyebrows in China. The police have reportedly detained around 20 people…. When he became the party’s leader in 2012, more was known about Mr Xi’s family and personal qualities than about his politics. He was a princeling…. Mr Xi had spent almost 20 years in Fujian, a southern province far from political nerve-centres. More is now clear. As Geremie Barmé, an Australian academic, puts it, Mr Xi is China’s ‘COE’, or chairman of everything….
Mr Hu was a wooden leader whose rule was overshadowed by the retired Mr Jiang; Mr Jiang, while in power, had to bow to his retired predecessor, Deng Xiaoping; even Deng trod carefully for fear of upsetting fellow party elders. Mr Xi, like Mao, appears unfettered by such concerns. He wants the country to know it, too…. Mr Xi is no Mao, a man whose whims caused the deaths of tens of millions and who revelled in the hysteria of his cult. But he rules in a way unlike any leader since the Great Helmsman. After Mao’s death, Deng tried to create a leadership of equals in order to push China away from Maoist caprices. Mr Xi is turning from that system back towards a more personal one. Indeed, he is more of a micromanager than Mao ever was….
The anti-corruption campaign has involved a radical change in the unwritten rules that have held the party together since the near civil war that Mao inflicted on it…. The anti-graft campaign is popular with the public, which suffers hugely from officials’ corruption, negligence and incompetence (a scandal that came to light in March involved rampant corruption in the state’s oversight of the sale and use of vaccines). But it has dismayed officials, many of whom have responded with passive resistance and fear-driven inertia…. Mr Xi has also sown alarm throughout the 2.3m-member People’s Liberation Army (PLA), the collective name for the armed forces. He has arrested generals for graft who were once considered untouchable, announced a trimming of the ranks by 300,000, shaken up the outdated command structure and slimmed down the top-heavy high command. Any one of these moves would have been impressive…. Mr Xi’s willingness to take on these tasks simultaneously suggests remarkable confidence….
Both in his reforms of the PLA and in his fight against corruption, Mr Xi’s actions aim first and foremost at tightening control: both the party’s over the army and his own over the party. It is similar in other areas of politics…. Mr Xi is determined to reimpose discipline on a querulous society that in recent years, thanks to the rapid spread of social media, has become much better equipped to organise itself independently of the party and to evade official controls. In the war against dissent, however, Mr Xi is facing visible resistance. Ren Zhiqiang, a property mogul turned commentator, said the media should serve readers and viewers, not the party….
Mr Xi has been even more hesitant in his handling of the economy. Months after taking power, he proclaimed that under his leadership markets would play a ‘decisive’ role. Since last year he has begun to talk of a need for ‘supply-side’ reforms, implying that inefficient, debt-laden and overstaffed state-owned enterprises (SOEs)—ie, most of them—need shaking up. But his approach has been marked by uncertainty, U-turns and, occasionally, incompetence…. Mr Xi’s lack of clear focus on the economy, and his unwillingness to let people more expert in such matters (namely, the prime minister, Mr Li) handle it, have caused a series of errors…. Markets are unpredictable and no Chinese leader (including Mr Xi) has any experience of the way they work in Western economies. But it is also likely that Mr Xi’s desire to hog power is partly to blame…. Mr Xi understands power, is not afraid to use it and is willing to take risks. He understands less about the new complexities of a changing society and worries about social unrest, so plays safe. He does not understand the economy well, is not sure what to do and does not trust others to act for him.
The way Mr Xi rules has three broad implications. The first is that problems common to all dictatorships will grow…. Another implication is that it is no longer reasonable to argue that China is a model of an authoritarian country opening up economically without doing so politically…. The third is that Deng’s policy of putting ‘economic construction at the centre’ is no longer the country’s most hallowed guiding principle. For Mr Xi, politics comes first every time…. The success of Mr Xi’s rule will rest not just on whether he wins the battles he has chosen to fight, but on whether he has picked the right ones. Seen from the point of view of China as a whole, it does not look as if he has. Mr Xi seems bent on strengthening his party and keeping himself in power, not on making China the wealthier and more open society that its people crave.
…has dramatically changed the composition of family incomes…. Even as more women have joined the labor force and families have lost their time for caregiving, too many families’ continue to face economic insecurity…. Over the past four decades, women’s increased earnings and increased annual hours of work have been essential as families across the United States seek to find and maintain economic security….
This analysis is an extension and update of the analysis presented in the forthcoming book ‘Finding Time: The Economics of Work-Life Conflict’ authored by… Heather Boushey….
Between 1979 and 2013, on average, low-income families in the United States saw their incomes fall by 2.0 percent. Middle-income families, however, saw their incomes grow by 12.4 percent, and professional families saw their incomes rise by 48.8 percent. Over the same time period, the average woman in the United States saw her annual working hours increase by 26.4 percent…
The assumption–debateable–is that “unemployment” is not a farm thing–that in the rural south or in the midwest or on the prairie you can always find a place of some sort as a hired hand, and that “unemployment” is a town- and city-based nonfarm phenomenon.
I confess I do not understand how anyone can look at this series and think that calculating stable and unchanging autocorrelations and innovation variances is a reasonable first-cut thing to do…
Today, the Washington Center for Equitable Growth released our second set of working papers. Equitable Growth working papers aim to promote the work of our grantees, our in-house research team, and other scholars in and out of our network who are doing research on the connection between inequality and economic growth.
This latest release features two papers by Equitable Growth grantees. One is written by Stephanie Chapman, who is about to receive her Ph.D. in economics from Northwestern University. Chapman’s working paper examines the impact of student loans on recipients’ subsequent performance in the job market.
The other grantee whose research is included in today’s release is Jacob Mortenson, whose work is also related to his Ph.D. dissertation at Georgetown University. Mortenson’s paper, co-authored with Jeff Larrimore of the Federal Reserve Board and David Splinter of the Joint Committee on Taxation, uses federal income tax data to look at earnings volatility in the 2000s.
Today’s third paper is by Kim Clausing, an economist at Reed College who specializes in tax issues. Her paper analyzes whether international profit shifting by corporations reduces the size of the U.S. corporate tax base.
The final paper is by Equitable Growth Research Advisory Board member David Autor of the Massachusetts Institute of Technology and two co-authors, David Dorn of the University of Zurich and Gordon Hanson of the University of California at San Diego. They study the adjustment costs and distributional consequences in the United States of the expansion of manufacturing imports from China.
The research contained in Equitable Growth working papers is work-in-progress. We hope that the series will encourage broader discussion and generate valuable feedback as researchers prepare their work for final publication.
Earlier this week, a consortium of investigative journalists released a trove of leaked data and research on the use of shell corporations to move money abroad. All of the data come from one law firm—Mossack Fonseca, based in Panama—that helped set up shell corporations based in the Central American country for more than 40 years. The data show that political and financial elites across the world have used these shell corporations in a number of illegal ways to help them hide their money.
Such illegal activities are and likely will be the focus of reporting on the leaks. But it’s also worthwhile to look at the broader system that allows for the legal shifting of income abroad.
As Matt Yglesias points out at Vox, there’s a difference between tax evasion, which is illegal, and tax avoidance, which is legal. The international tax system is full of loopholes that allow elites and major corporations to shift their incomes abroad—or, more accurately, to make it appear that their incomes were earned abroad.
Research by economist Gabriel Zucman of the University of California, Berkeley shows how large the “hidden wealth of the world” really is. According to his estimates, about 8 percent of the world’s financial wealth resides in tax havens such as Bermuda and the Caymans. Recent international agreements have taken actions on some of the loopholes that allow wealth to hide, but Zucman argues that these changes are minor, as they build upon a system that will continue to let money remain in the shadows.
The problem is that companies have become quite adept at making it seem that money has been earned in these tax-haven countries. Think, for example, of the technology company that transfers its intellectual property to a subsidiary in a low-tax jurisdiction. The earnings from that intellectual property get booked to the low-tax subsidiary even if the sales actually happen in a higher-tax jurisdiction. Zucman’s solution would be to change the basis of taxation to the location of the sale, which is much harder to manipulate.
And there’s other evidence that capital income has become more hidden and obscure: Recent research details how U.S. business income since 1980 has shifted away from traditional corporations toward “pass-through” entities like partnerships. This kind of business income is not only more unequally distributed and taxed less than corporate income, but it’s more opaque. The researchers looking at these tax data noted that the source or ultimate ownership of 30 percent of the partnership income couldn’t be determined.
Clearly the extent of offshore wealth and the opacity of capital income were known before the data leak. But it’s a good reminder of how the international tax system is built to allow these kinds of transactions to occur. Capital has a way of flowing to places where it’s taxed less, despite evidence that low tax rates don’t necessarily spur more investment and wage growth. The issue, it seems, is actually taxing the capital.
The steady movement of women into the U.S. workforce over the past half-century has dramatically changed the composition of family incomes across the country and up and down the income ladder. All these additional earnings, however, have not meant that family income has increased faster than in earlier eras. A breadth of research demonstrates that overall family economic security in the United States has been declining since the 1970s, especially among low- and middle-income families. As a result, even as more women have joined the labor force and families have lost their time for caregiving, too many families’ continue to face economic insecurity.
This issue brief explores how over the past four decades, women’s increased earnings and increased annual hours of work have been essential as families across the United States seek to find and maintain economic security. Using data from the Current Population Survey, we document how family income has changed between 1979 and 2013 for low-income, middle-class, and professional families, decomposing the differences in male earnings and female earnings from greater pay, female earnings from more hours worked, and other sources of income over this time period.
This analysis is an extension and update of the analysis presented in the forthcoming book “Finding Time: The Economics of Work-Life Conflict” authored by one of the co-authors of this issue brief, Equitable Growth’s Executive Director and Chief Economist Heather Boushey. Here are our key findings:
Between 1979 and 2013, on average, low-income families in the United States saw their incomes fall by 2.0 percent. Middle-income families, however, saw their incomes grow by 12.4 percent, and professional families saw their incomes rise by 48.8 percent.
Over the same time period, the average woman in the United States saw her annual working hours increase by 26.4 percent. This trend was similar across low-income, middle-class, and professional families.
Across all three income groups, women significantly helped family incomes both because they earned more per hour and worked more per year. Women’s contributions saved low-income and middle-class families from steep drops in their income.
These findings establish that working women, especially those within low-income and middle-income families, have made the key difference in securing earnings for their families. Without women’s added earnings, families would be much worse off.
Women’s changing role in the U.S. labor force
An increasing number of families across the United States, especially low- and middle-income families, are becoming less economically secure. This trend began more than four decades ago, long before the Great Recession of 2007–2009. In light of this increasing instability and stagnant growth in family incomes, families have had to find ways to cope—including an growing reliance on the earnings of women. The role of women in the United States has transformed from predominantly being a wife or mother to being all of these things and a breadwinner.
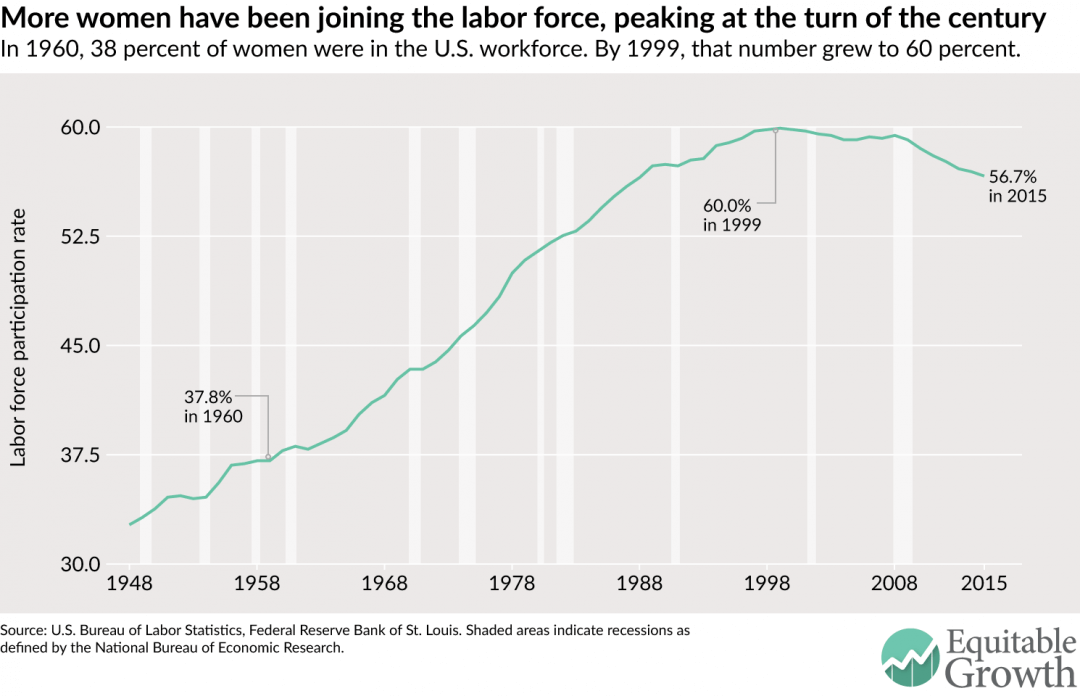
Half a century ago, women—especially middle-class women—began entering the U.S. labor force and staying there, although they were still more likely to be their family’s caregiver for children, the aging, and the ill. And starting in the 1970s, more women started gaining professional degrees, which along with other factors contributed to a sharp rise in women’s labor force participation as well, especially for prime-age working women (ages 25 to 54). By 2000, about 60 percent of all U.S. women were in the labor force, which remained the case until the financial crash in 2007 and the ensuing Great Recession. (See Figure 1.)
Figure 1
As women engaged more in the labor force, they also started working more hours on average. In 1979, 28.6 percent of all U.S. women were working full time. By 2007, right before the Great Recession, this number had increased to 43.6 percent. This change has made a substantial difference at a macroeconomic level: Our gross domestic product in 2012 would have been $1.7 trillion less if women had not increased their working hours over the past four decades.
Updating and building on the findings that Heather Boushey presents in her forthcoming book, “Finding Time: The Economics of Work-Life Conflict,” this brief explores the difference that women’s increased work hours have made at the family level, and how this effect varies for different types of families. Using data from the Current Population Survey, we calculate how family income changed between 1979 and 2013 for low-income, middle-class, and professional families in the United States, decomposing it by differences in male earnings, female earnings, and other sources of income over that time period. We further dissect the change in female earnings to find what portion of that change is due to increases in pay and what portion is due to working more hours in 2013 in comparison to 1979.
Defining income groups
This analysis follows the same methodology presented in “Finding Time.” For ease of composition, we use the term “family” throughout the brief, even though the analysis is done at the household level. We split households in our sample into three income groups. Low-income households are those in the bottom third of the income distribution, which means those earning less than $25,440 per year in 2015 dollars. Professional households are those in the top fifth of the income distribution who have at least one household member with a college degree or higher; in 2015 dollars, these households have an income of $71,158 or higher. Everyone else falls in the middle-class category.
Setting some context
Before we delve into the main analysis, let’s first set some context for how family incomes and women’s hours have changed across low-income, middle-class, and professional families.
How did family incomes change between 1979 and 2013?
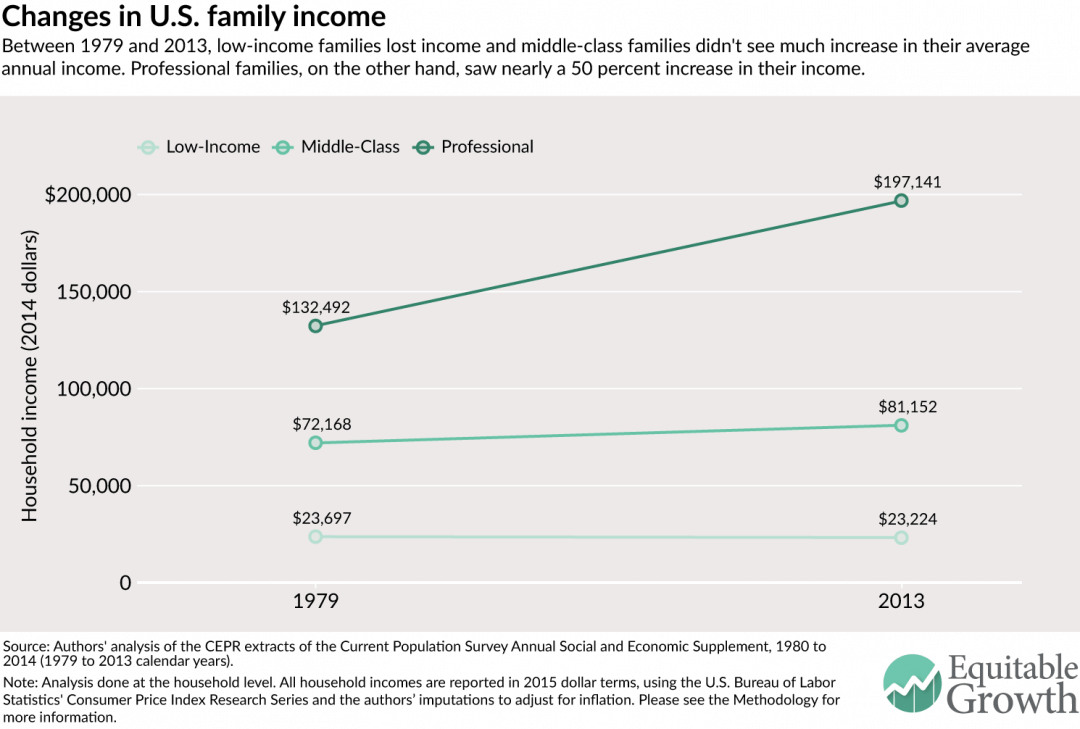
The changes in average U.S. family incomes between 1979 and 2013 show widening inequality, consistent with other research. In 1979, low-income families had an average annual family income of $23,697 in 2015 dollars—by 2013, that number dropped by 2.0 percent to $23,224. Middle-class families only fared marginally better: In 1979, they had an average income of $72,168, which by 2013 rose by 12.4 percent to $81,152. Over the same time period, however, professional families saw a 48.8 percent increase in their average income, going from $132,492 in 1979 to $197,141 in 2013. (See Figure 2.)
Figure 2
How did women’s working hours change between 1979 and 2013?
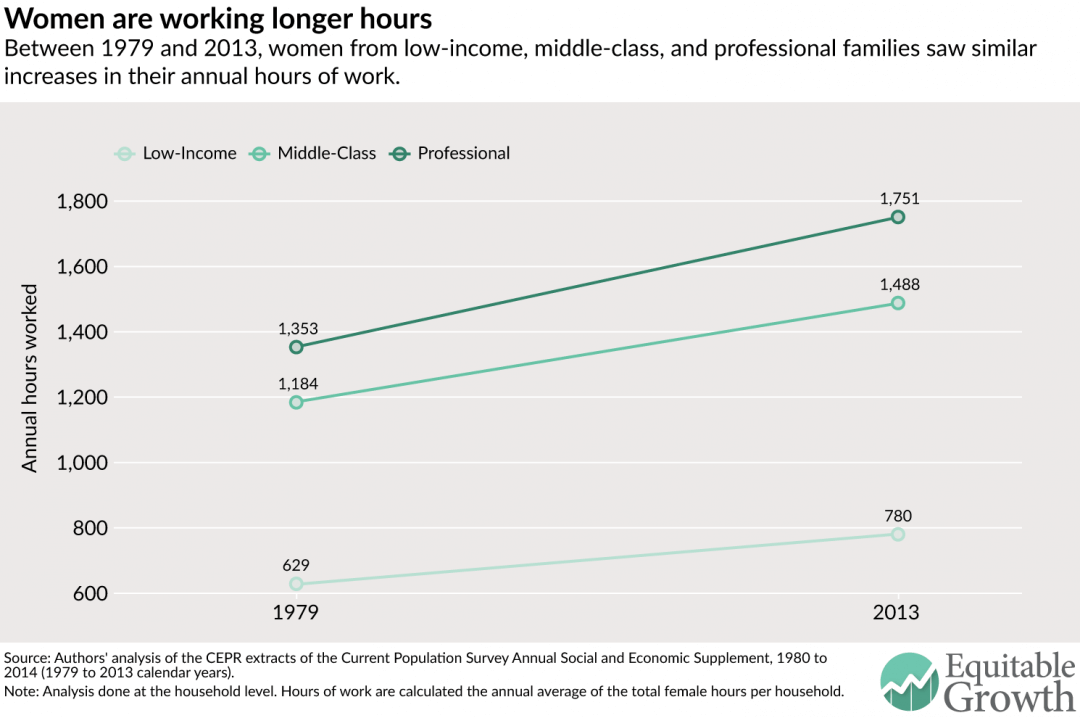
Women across all three income groups saw their working hours rise. In 1979, on average, women from low-income families worked 629 hours per year (or 12 hours per week), and by 2013 their annual work hours had grown by 24.1 percent to 780 hours (or 15 hours per week). Similarly, middle-class and professional women’s hours grew by 25.7 percent (from 23 per week in 1979 to 29 hours per week in 2013) and 29.4 percent (from 26 hours per week in 1979 to 34 hours per week in 2013) over that same time period, respectively. (See Figure 3.)
Figure 3
Decomposing the changes in family income between 1979 and 2013
Figures 2 and 3 establish that between 1979 and 2013, even as women’s working hours increased at parallel rates for all income groups, family income was either stuck or stalled for low-income and middle-class families. This paradox is resolved when we break down the changes in average family income into male earnings, female earnings, and income from Social Security, pensions, or any other non-employment-related source over that same time period.
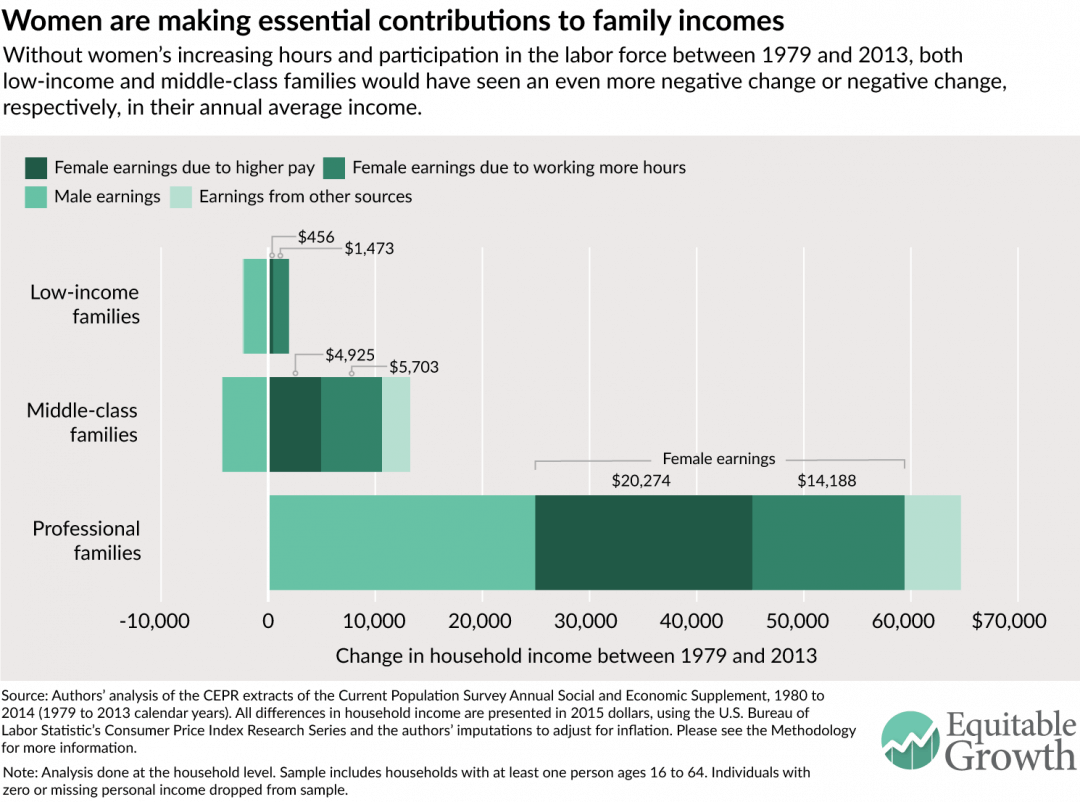
Specifically, we divide female earnings into the portion due to women earning more per hour and that due to women working more per year. To calculate female earnings stemming directly from the additional hours worked, we take the difference between 2013 female earnings and the hypothetical earnings of women if they earned 2013 hourly wages, but worked the same hours as women did in 1979. (For more on how we did this calculation, please see our Methodology.) It turns out that this is an important distinction because, as shown in Figure 4, the difference in female earnings due to additional hours has made a significant positive difference for every income group, especially for low-income and middle-class families. (See Figure 4.)
Figure 4
Between 1979 and 2013, low-income families saw their income fall, as shown in Figure 2; in Figure 4, we see that this is because men’s earnings fell. Women not only increased their working hours but also their pay per hour—so much so that their overall contribution grew the average annual family income by $1,929 making up for much of the losses from declining male earnings. Women’s earnings from working additional hours alone added $1,473.
In middle-class families, the average annual income grew by $8,984. But, like low-income families, this change was also entirely due to women’s added hours and earnings. Between 1979 and 2013, women’s earnings from working more hours accounted for the largest share of the gains, adding $5,703. The second-largest factor was once again women’s pay, which contributed about $4,925. Also similar to low-income families, men’s earnings pulled down overall income within middle-income families, falling by $4,278.
Professional families experienced significant income growth between 1979 and 2013 across all earnings and income categories. As with low-income and middle-class families, women’s earnings from higher pay and increased hours were the most important factor. Women’s earnings from pay increased by an average of $20,274 per year, while women’s earnings from more hours accounted for $14,188. However, as opposed to families further down the income spectrum, men in professional families earned on average $24,936 more per year over this period, helping boost family income.
Conclusion
Across every income group, women’s increased working hours have helped bolster family economic security. But for low-income and middle-class families, women’s contributions, particularly from working more per year, have been essential in abating the effects of stuck or stalled family income growth. Simply, women’s participation in the workforce has made the key difference for middle-class families and more vulnerable families on the brink.
Families have benefited greatly from the changing roles of women in the home and the work force. Yet across the U.S. job market and across all levels of the income distribution, men and women face daily conflicts between work and family. As researchers strengthen the finding that what happens within a family is just as important to the economy as what happens within a business, it is imperative that we design policies that support families where they live, work, and play. These policies, among them work flexibility, paid family and medical leave, and child care, must be designed so that their distributional effects help all families equitably in order to truly strengthen our economy.
Heather Boushey is the Executive Director and Chief Economist at the Washington Center for Equitable Growth and the author of the forthcoming book from Harvard University Press, “Finding Time: The Economics of Work-Life Conflict.” Kavya Vaghul is a Research Analyst at Equitable Growth.
Acknowledgements
The authors would like to thank John Schmitt, Ben Zipperer, Dave Evans, David Hudson, and Bridget Ansel. All errors are, of course, ours alone.
Methodology
The methodology used for this issue brief is identical to that detailed in the Appendix to Heather Boushey’s “Finding Time: The Economics of Work-Life Conflict.”
In this issue brief, we use the Center for Economic and Policy Research extracts of the Current Population Survey Annual Social and Economic Supplement for survey years 1980 and 2014 (calendar years 1979 and 2013). The CPS provides data on income, earnings from employment, hours, and educational attainment. All dollar values are reported in 2015 dollars, adjusted for inflation using the Consumer Price Index Research Series available from the U.S. Bureau of Labor Statistics. Because the Consumer Price Index Research Series only includes indices through 2014, we used the rate of increase between 2014 and 2015 in the Consumer Price Index for all urban consumers from the Bureau of Labor Statistics to scale up the Research Series’ 2014 index value to a reasonable 2015 index estimate. We then used this 2015 index value to adjust all results presented.
For ease of composition, throughout this brief we use the term “family,” even though the analysis is done at the household level. According to the U.S. Census Bureau, in 2014, two-thirds of households were made up of families, defined as at least one person related to the head of household by birth, marriage, or adoption.
We divide our sample into three income groups—low-income, middle-class, and professional households—using the the definitions outlined in “Finding Time.” For calendar year 2013, the last year for which we have data at the time of this analysis, we categorized the income groups as follows:
Low-income households are those in the bottom third of the inflation- and size-adjusted household income distribution. These households had an income of below $25,440 (as compared to $25,242 and below for 2012). In 1979, 28.3 percent of all households were low-income, increasing to 29.7 percent in 2013. These percentages are slightly lower than one third because the cut-off for low-income households is based on household income data that includes persons of all ages, while our analysis is limited to households with at least one person between the ages of 16 and 64. The working-age population (16 to 64) typically has higher incomes than older workers, and as a result, the working-age population has somewhat fewer households that fall into this low-income category.
Professionals are those households that are in the top quintile of the inflation- and size-adjusted household income distribution and have at least one member who holds a college degree or higher. In 2013, professional households had an income of $71,158 or higher (as compared to $70,643 or higher in 2012). In 1979, 10.2 percent of households were considered professional, and by 2013, this share had grown to 16.8 percent.
Everyone else falls in the middle-class category. For this group, the household income ranges from $25,440 to $71,158 in 2013 (as compared to $25,242 to $70,643 in 2012); the upper threshold, however, may be higher for those households without a college graduate but with a member who has an extremely high-paying job. This explains why within the middle-income group, the share of households exceeds 50 percent: The share of middle-income households declined from 62 percent in 1979 to 53.4 percent in 2013.
Note that all cut-offs above are displayed in 2015 dollars, using the inflation adjustment method presented earlier.
In our analysis, we limit the universe to persons with non-missing, positive income of any type. This means that even if a person does not have earnings from some form of employment but does receive income from Social Security, pensions, or any other source recorded by the CPS, they are included in our analysis.
These data are decomposed into income changes between 1979 and 2013 for low-income, middle-class, and professional families. The actual household income decomposition uses a simple shift-share analysis to find the differences in earnings between 1979 and 2013 and calculate the extra earnings due to increased hours worked by women.
To do this, we first calculate the male, female, and other earnings by the three income categories. To calculate the sex-specific earnings per household, we sum the income from wages and income from self-employment for men and women, respectively. The amount for other earnings is derived by subtracting the male and female earnings from total household earnings. We average the household, male, female, and other earnings by each income group for 1979 and 2013, and take the differences between the two years to show the raw changes in earnings by each income group.
To find the change in hours, for each year by household, we sum the total hours worked by men and women. We average these per-household male and female hours, by year, for each of the three income groups.
Finally, we calculate the counterfactual earnings of women. We use the 2013 earnings per hour for women and multiply it by the 1979 hours worked by women. Finally, we subtract this counterfactual earnings from the female earnings in 2013, arriving at the female earnings due to additional hours.
One important point to note is that because of the nature of this shift-share analysis, the averages don’t exactly tally up to the raw data. Therefore, when presenting average income, we use the sum of the decomposed parts of income. While economists typically show median income, for ease of composition and the constraints of the decomposition analysis, we show the averages so that the data are consistent across figures. Another important note is that we make no adjustments for changes over time in topcoding of income, which likely has the effect of exaggerating the increase in professional families’ income relative to the other two income groups.