Fifty years after the arrival of the contemporary women’s movement on the national stage, the U.S. workforce and the U.S. economy are the beneficiaries of the enormous strides in gender equality. Women are working in nearly all occupations that once were exclusively the domain of men, and many are in prominent leadership roles in business and government. Yet sex segregation in the workplace remains a problem as social norms continue to restrict occupational choices by women and men, thereby distorting labor markets, depressing wages, and hurting business innovation and productivity.
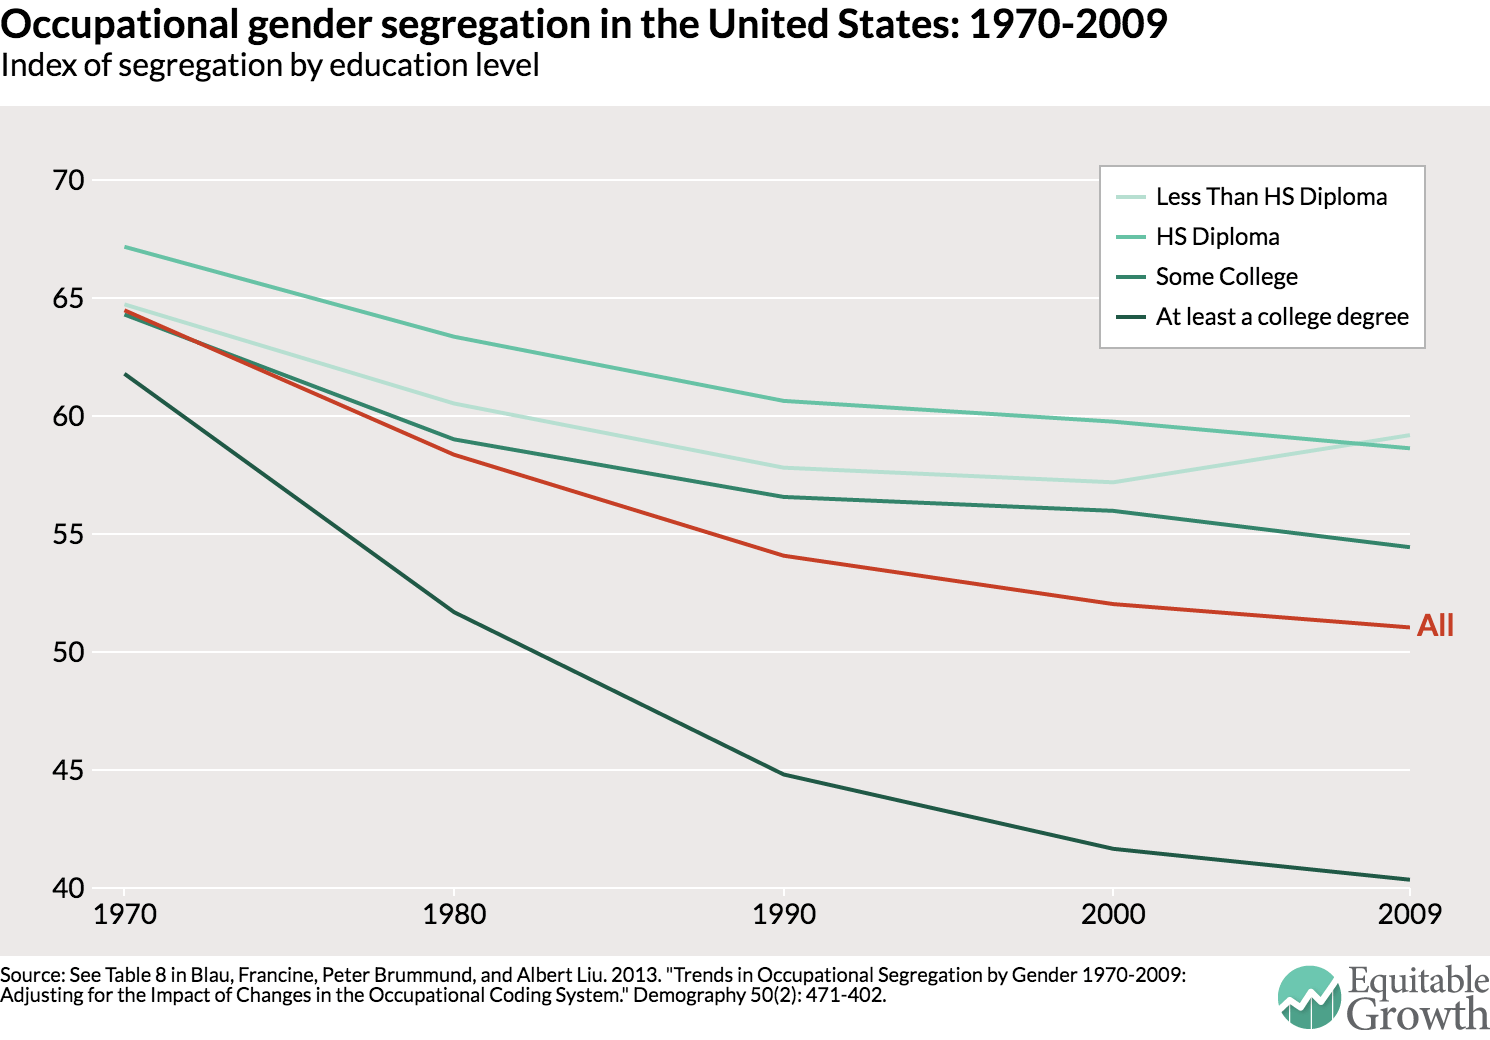
Despite the early gains of women in professional and service jobs that require a college education, many such occupations remain disproportionately male, particularly at the highest levels. Furthermore, most technical and manual blue-collar jobs have undergone little to no integration since the 1970s. Economists Francine Blau at Cornell University, Peter Brummund at the University of Alabama, and Albert Yung-Hsu Liu at Mathematica Policy Research, Inc., examined trends in occupational segregation between 1970 and 2009 and found that the process of desegregation has slowed significantly in recent decades, regardless of the education level necessary for a job. (See Figure 1.)

Why does occupational segregation by gender persist
Traditional economic theory explained occupational segregation by gender as an inevitable consequence of “natural differences” in skills between women and men, but contemporary economists have refocused the blame on gender discrimination by employers, coworkers, and other actors. According to the standard model, levels of segregation should be constant over time as they are determined by occupations’ supposed compatibility with “male” and “female” labor market preferences. Contradicting this prediction, economist Jessica Pan at the National University of Singapore finds that men abandoned formerly all-male professions in droves after women’s participation reaches “tipping points,” fearing the social stigma and wage penalties associated with belonging to “feminine” occupations.
Contemporary economic research has sought to better understand the causes of this male aversion to working with female colleagues. On one hand, the discrimination in hiring and promotion that reinforces segregation is based on stereotypes about women’s skills. As Harvard University economist Claudia Goldin argues in her “pollution theory of discrimination,” men often underestimate women’s skills based on their current underrepresentation in certain occupations and thus discriminate against women in these occupations on the false assumption that increasing their representation would lower overall productivity.
On the other hand, economists George Akerlof at Georgetown University and Rachel Kranton at Duke University argue that discrimination in male-dominated professions is caused by social pressures, interpreting women’s inclusion as a threat to the professions’ masculinity. By this account, men don’t discriminate against women because they view women as less qualified but rather because they are trying to protect the social power men hold through membership in the “boys’ club.” In a similar model of “stratification economics,” economists Sandy Darity of Duke, Darrick Hamilton of the New School for Social Research, and James Stewart of Pennsylvania State University detail how socially dominant groups create and reinforce prejudices against other groups in order to protect their economic, political, and social advantages.
Despite a decline in explicit sexism, researchers argue that gender discrimination today, whether in the form of stereotypes or social pressures, is perpetuated by a new, “egalitarian” form of gender essentialism—the belief that women and men’s social, economic, and familial roles are and should be fundamentally different. While most people now support women’s access to all economic opportunities, they simultaneously expect men and women to pursue traditionally “male” and “female” jobs and regard parenting as the primary responsibility of mothers. Sociologist Paula England at New York University and other researchers note that the resurgence in differential expectations is responsible for the recent stagnation in occupational desegregation and in other indicators of women’s economic inclusion.
Assuming different roles for men and women at work and at home, male-dominated occupations remain mostly structured to meet the needs of a stereotypical male who is expected to have a spouse at home, a work-schedule issue that not only fails to accommodate women but also often actively pushes women out. The idea that women are freely “opting out” of workforce opportunities because they have different career aspirations than men has been thoroughly debunked. Instead, women usually leave their jobs because of negative experiences in the workforce, especially in male-dominated fields. In particular, jobs in these fields often demand a culture of long hours, which does not accommodate flexibility for caregiving, forces many mothers to quit, and likewise discourages fathers from helping out at home.
To make matters worse, male-dominated workplaces are often hostile work environments for women, featuring the highest rates of sexual and gender-based harassment. Overt forms of sexual harassment remain part of the “culture” of many male-dominated jobs, particularly given the limited of application of anti-discrimination laws in many blue-collar occupations, as the late Barbara Bergmann, a pioneering feminist economist, once observed. Subtler forms of gender-based harassment in which men exclusively hire, socialize with, and promote each other are even more common in the STEM (science, technology, engineering, and mathematics) professions, in finance, and in other professional environments and have been demonstrated to limit women’s prospects for advancement, decrease female labor force attachment, and reinforce segregation.
How occupational segregation drives down wages and slows economic growth
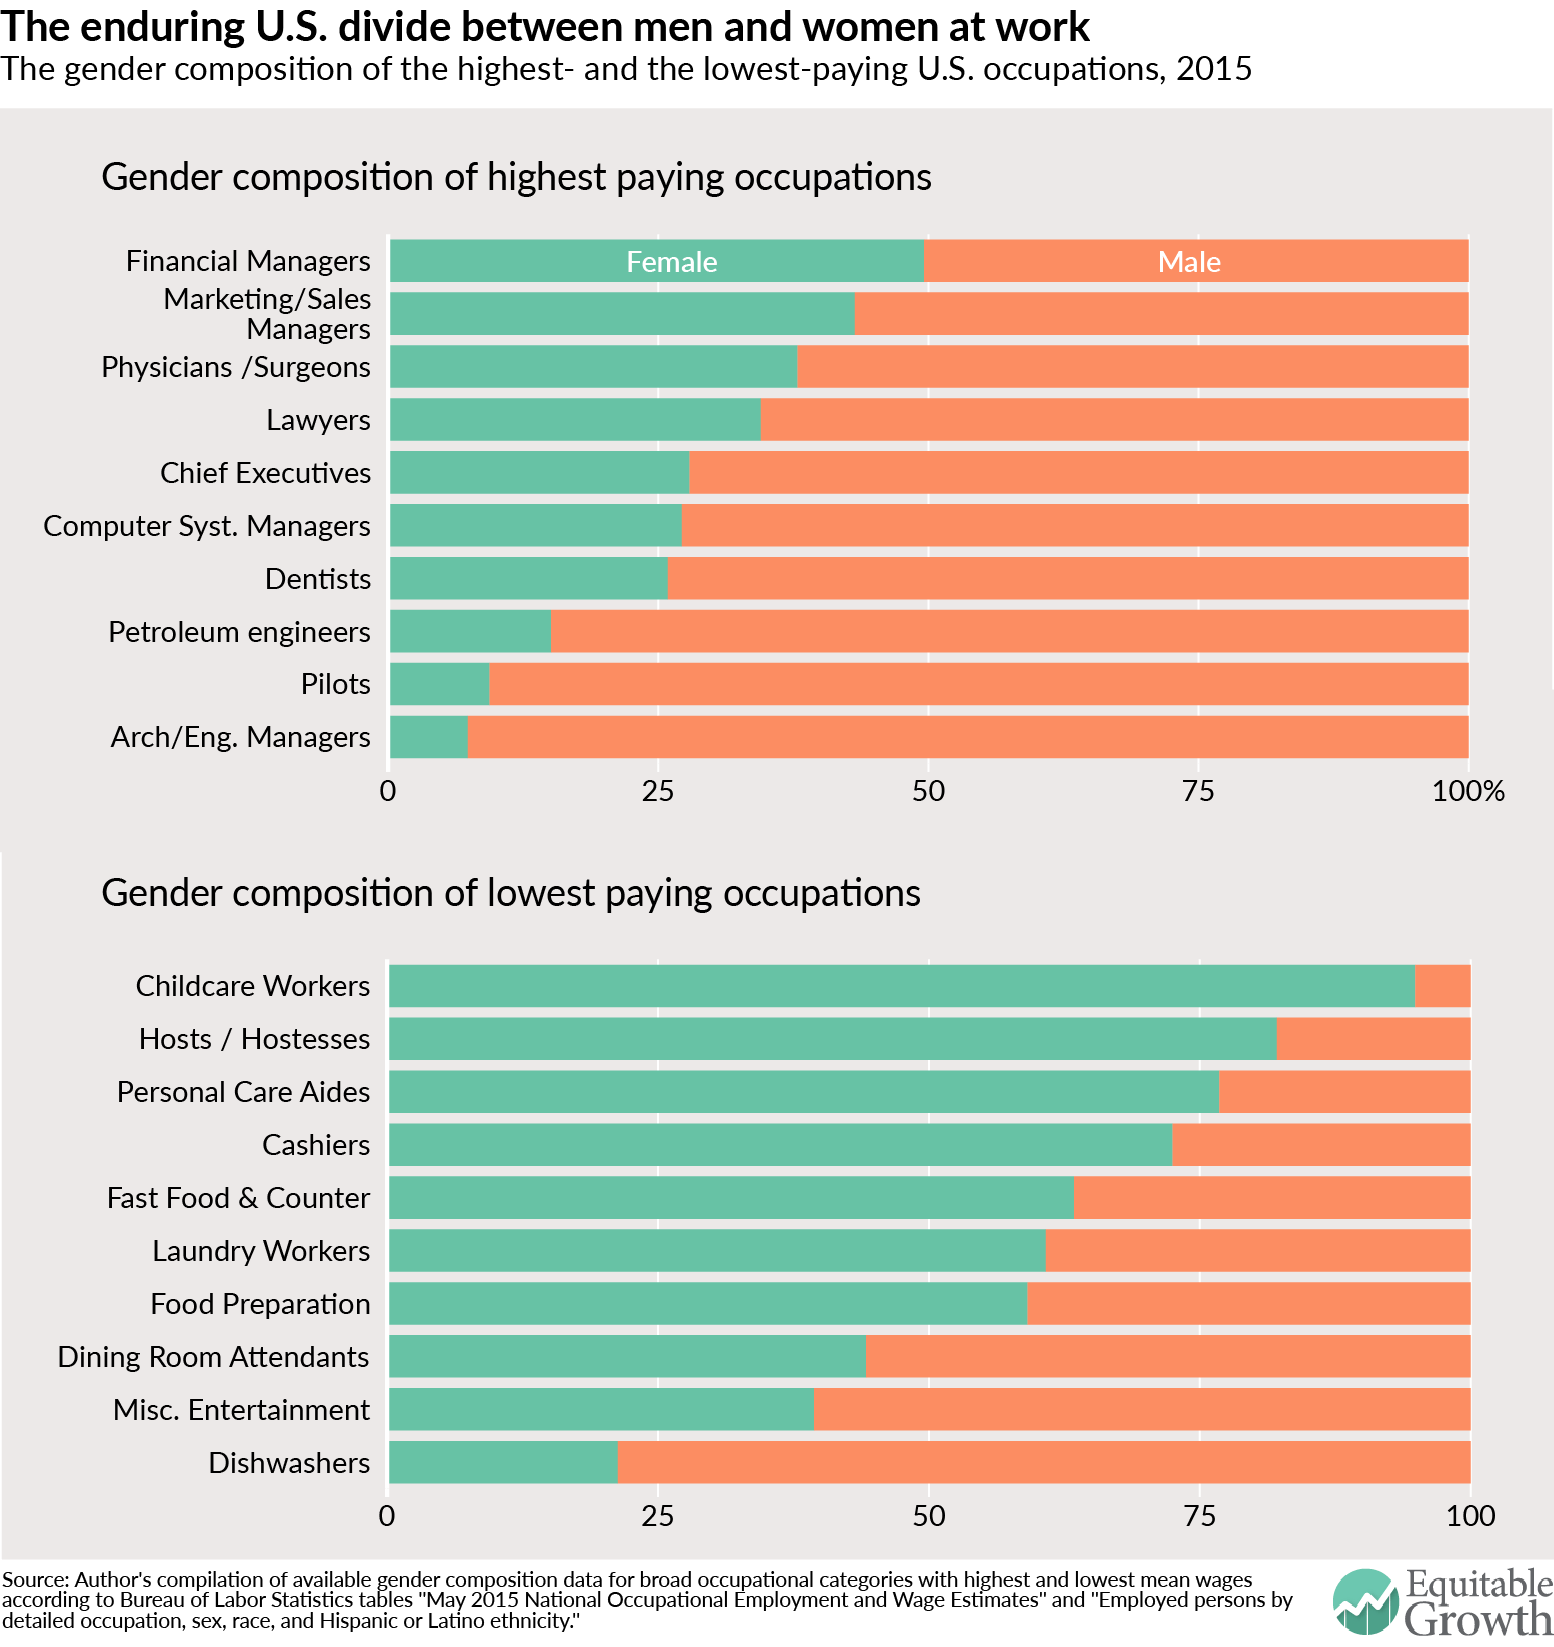
At the microeconomic level, occupational segregation by gender substantially depresses female wages and contributes to the gender wage gap. Most of the U.S. economy’s highest paying occupations are predominantly male while most of the lowest paying occupations are predominantly female. (See Figure 2.)

By pushing women into lower-paying occupations, occupational segregation depresses female wages and hurts family economic security. A recent empirical review on trends in the gender wage gap since 1980 by economists Blau and her colleague at Cornell, Lawrence Kahn, attributes half of the present gap to women working in different occupations and industries than men. In addition to keeping women out of the highest-paying occupations, a report by the Institute for Women’s Policy Research authored by Heidi Hartmann, Barbara Gault, Ariane Hegewisch, and Marc Bendick details how segregation also excludes women from the best-paying middle-skills jobs in information technology, logistics, and advanced manufacturing, even though these jobs require similar skills as predominantly female jobs with worse pay. Other researchers clearly demonstrate that this “wage penalty” for occupational feminization is a product of discrimination against women’s labor as opposed to productivity differences between predominantly male and female jobs.
As AFL-CIO chief economist William Spriggs and Case Western University historian Rhonda Williams argue, these trends also are highly racialized: women of color at all education levels are segregated into jobs with lower wages than their white female peers of similar skill level. Conversely, occupational integration produces huge wage increases for women and people of color: econometric analysis by Chang-Tai Hsieh and Erik Hurst at the University of Chicago and Charles Jones and Peter Klenow at Stanford University shows that occupational integration since 1960 was responsible for 60 percent of real wage growth for Black women, 40 percent for white women, and 45 percent for Black men (after accounting for inflation). These patterns indicate that the persistence of segregation today results in a significant loss of income for working women and their families, which should be disconcerting to policymakers given the ameliorative effects of lifting women’s wages on poverty, unemployment, and inequality.
Beyond its effect on individual workers, occupational segregation limits optimal matching of workers with jobs where they can best leverage their skills and fulfill their ambitions. If men and women are pushed into careers based on societal definitions of “masculinity” and “femininity” then they aren’t able to choose the labor market opportunities that best match their skills and ambitions. Most of this issue brief is focused on how segregation limits women’s ability to contribute to traditionally male occupations, but it also limits men’s ability to contribute to traditionally female occupations—a significant policy issue as globalization and technology continue to decrease the availability of many predominantly male blue-collar jobs in the United States.
Indeed, a growing body of evidence demonstrates that occupational integration helps both sexes contribute their human capital to enhancing the productivity of firms. A variety of studies show that establishing a “critical mass” of at least 30-percent women in corporate leadership enhances firm innovation and overall performance. This is consistent with behavioral research that gender integration improves teams’ “collective intelligence.” In the financial sector in particular, occupational integration decreases systemic risk driven by masculine-stereotyped behaviors encouraged in sex-segregated environments, argues economist Julie Nelson at the University of Massachusetts-Boston.
These individual- and firm-level gains can have a massive impact on overall productivity and growth. Research by economists Hsieh, Hurst, Jones, and Klenow demonstrates that occupational integration was responsible for driving 15 percent to 20 percent of the increase in aggregate output per worker since 1960.
Where policymakers can jumpstart integration
To counteract gender discrimination, firms should set explicit targets for increasing female representation at all levels. Because children’s labor market preferences are largely shaped by the representation of women in leadership roles, increasing women’s representation in private- and public-sector institutions can decrease stereotypes and expand opportunity for women at all levels. According to research by economists Marianne Bertrand at the University of Chicago, Sandra Black at the University of Texas-Austin, Sissel Jensen at the Norwegian School of Economics, and Adriana Lleras-Muney at the University of California-Los Angeles, Norway’s 40 percent minimum requirement for women on corporate boards increased female representation, attracted female board members with greater qualifications, and reduced gender wage gaps on boards. While it may take time for these effects to trickle-down to entry-level workers, a study by Lori Beaman at Northwestern University, Esther Duflo at the Massachusetts Institute of Technology, Rohini Pande at Harvard University, and Petia Topalova at the International Monetary Fund, shows that a law mandating increased representation for women on municipal councils in India dramatically decreased bias against women in the population as a whole while expanding girls’ educational opportunities and career aspirations.
In addition to interventions at the top, researchers, including Harvard’s Rosabeth Moss Kanter, argue that by establishing a critical mass of women in all work environments employers can dramatically reduce the prevalence of discriminatory behaviors and force their workplaces to adapt to their female employees’ needs and demands. As Yale Law professor Vicki Schultz argues, anti-discrimination law and policy should thus emphasize increasing women’s numerical strength across occupations and dismantle the workplace structures discussed above that create sex differences in labor market choices—as opposed to simply reflecting them. Sociologists Sheryl Skaggs of the University of Texas-Dallas, Kevin Stainback of Purdue University, and Phyllis Duncan of Our Lady of the Lake University find significant “bottom-up” effects of increasing women’s general representation on their representation in managerial positions, complementing the “top-down” effects of increasing their numbers on corporate boards.
While work-life reforms benefiting both fathers and mothers are essential to developing an inclusive workplace, setting explicit targets for women at all levels would help reverse discrimination against women in promotion decisions based on their greater probability of taking leave, as Cornell economist Mallika Thomas documents. Furthermore, while male-dominated occupations can and must change to include women, it is equally important to elevate and integrate female-dominated occupations by mandating equal pay for jobs of equal value or “comparable worth,” as noted by, among others, economist and IWPR president Heidi Hartmann as well as economist and former Bennett College President Julianne Malveaux.
Beyond reforms within labor markets, ending occupational sex segregation will require a comprehensive strategy to prevent the formation of gender stereotypes at a young age that later “spillover” into the workplace. Cultivating inclusion must start early in order to have a lasting impact on children’s beliefs and experiences. Research demonstrates, for example, that unnecessarily segregating boys and girls in educational or social activities creates arbitrary categories of “us” and “them,” sending a message that children’s opportunities should be determined by their gender. Efforts to counteract gender stereotypes can also help women later on in their careers. Indeed, the IWPR report by Hartmann, Gault, Hegewisch, and Bendick argues for public-private partnerships to train and match women from “on-ramp occupations” to higher paying traditionally male jobs that require similar skills.
Achieving successful integration at all levels will take work. However, social scientists including legal scholar Joan Williams at the University of California’s Hastings School of Law and behavioral economist Iris Bohnet at Harvard are proposing a variety of strategies for decreasing bias, overcoming difference, and advancing women throughout their educational and professional careers. As Goldin and Princeton University economist Cecilia Rouse argue in their seminal study on the gender equity benefits of blind auditions for symphony orchestras, these strategies should focus on results-based approaches that decrease the influence of social networks and gender biases in evaluation, hiring, and promotion of women.
Leveraging these behavioral changes to promote gender equity and inclusion in all institutions boasts enormous potential to raise wages, boost productivity, drive innovation, and expand opportunity for women and men across the economy.
Will McGrew is an intern at the Washington Center for Equitable Growth and a Dahl Research Scholar at the Yale Institution for Social and Policy Studies. He is studying Economics and Political Science at Yale University.


