Should-Read: Robert Reich: Five Questions for Robert Reich about Saving Capitalism: For the Many, Not the Few

Should-Read: Robert Reich: Five Questions for Robert Reich about Saving Capitalism: For the Many, Not the Few: “America has repeatedly reformed itself with regard to excessive concentration of income and its attendant political consequences…

…We have a strong track record of expanding the circle of prosperity when capitalism gets off track…. I want to reach average Americans who are confused and frustrated about the current political-economic system, who don’t want to scapegoat immigrants or the poor for their problems, and who are open to uniting with others in order to mobilize and organize a movement to regain control over our democracy and make our economy work for the many rather than the few…. The rules that define the basic building blocks are hidden from view, and most people don’t see them or understand them….

Nothing should be controversial in a partisan sense. On this book tour, I’ve talked with many people who call themselves “conservative Republicans” who agree with almost every point I make. They want to end crony-capitalism; they think the biggest Wall Street banks are way too big; they’re opposed to “corporate welfare”; they want to get big money out of politics…. Even my political point—that we need to reestablish what John Kenneth Galbraith once described as “countervailing power”—is not really controversial. I don’t condemn big corporations, big banks, CEOs, or wealthy individuals. My concern is that political power has become too concentrated in the hands of too few, and we need to reestablish countervailing power—perhaps not the same sources of countervailing power as we had in the 1950s and 1960s, but new sources that act as a check and balance upon concentrated power…

Must-Read: Matthew Yglesias: Beyond wild allegations, what’s clearly true about Trump and Russia is disturbing

Must-Read: Matthew Yglesias: Beyond wild allegations, what’s clearly true about Trump and Russia is disturbing: “The Russian blackmail theory is composed of two sub-elements…

…both of which are clearly true based on publicly available information. One is that Donald Trump has a curious and wrongheaded affection for the present government of Russia and its foreign policy. The other is that Donald Trump has engaged in scandalous conduct, the public revelation of which would cause a rational person to reduce their opinion of him…. Trump’s strange ideas about Russia date back to at least 1987, when Trump called for a US-Soviet alliance against France and Pakistan.
During the 2016 campaign, Trump publicly called into question America’s commitment to defending NATO allies from Russian attack.
Trump praised Russia’s intervention in the Syrian Civil War. Trump has also pointedly declined to criticize Putin on any front, whether it’s about killing journalists or invading Ukraine. Trump’s former campaign manager, Paul Manafort, made a lot of money working for Putin’s proxy party in Ukraine…. Trump’s Russia policy is both a bit bizarre and also quite clear. Maybe the Russians are bribing him into it. Maybe he just has bad ideas. Maybe they are blackmailing him.

I have no idea. But if you’re wondering whether there is dirt on Trump out there, then the answer is clearly yes. Trump was recorded telling a casual acquaintance that he routinely sexually assaults women and escapes culpability because “when you’re a star they let you do it.” Trump paid $21 million in damages to students at his fake university who alleged he’d defrauded them. Trump’s foundation broke a wide range of rules about how it is legal to raise funds for charity and how it is legal to manage charitable funds…. Trump’s Atlantic City comeback was fueled by bilking shareholders…. There is at least one thing — and perhaps several things — lurking in Trump’s tax returns that would be highly damaging to his political standing…. A special congressional select committee investigation — or maybe some kind of independent prosecutor — seems clearly appropriate…

Should-Read: Noah Smith: The Wisdom and Madness of Crowds

Should-Read: Noah Smith: The Wisdom and Madness of Crowds: “Prelec… Seung, and… McCoy ask… what people think others will guess. If herd behavior is present, some people will know it, and will be contrarians…

…they’ll guess something different from what they think other people will say. Prelec et al. find that the forecasts that receive the most contrarian support–the guesses that people pick even though they think others will guess differently–tend to be the right ones. They find that these forecasts, which they label the “surprisingly popular” options, tend to outperform standard crowd averages in a number of applications, with error rates more than 20 percent lower…. This method obviously has some very important potential applications for finance…. In the search for the ultimate forecast, the wisdom of crowds might turn out to be very good, but not quite the best.

Must-Read: Dietrich Vollrath: Who are you calling Malthusian?

Must-Read: The word on what a “Malthusian” analysis of the pre-industrial agrarian-age economy means these days:

Dietrich Vollrath: Who are you calling Malthusian?: “Living standards are negatively related to the size of population…

…This would occur if we had some sort of fixed factor of production. Typically, one might say it was agricultural land, but you could just say resources if you like…. Population growth is positively related to living standards…. Then you’ve got what I’d call a Malthusian economy…. Everything in the system is pushing back towards some middle ground where the resource per person, and hence the living standard, is at just the right level so that population growth is zero. With no change in population, there is no change in living standards, so there is no change in population growth, so there is again no change in population. The economy becomes stagnant at the living standard which delivers zero population growth….

Let me offer a few [more] observations…. The stagnant level of living standards is not necessarily at a biological minimum…. All Malthusian economies do not stagnate at the same level of living standards. Shocks to technology/productivity will only temporarily raise living standards, but will permanently raise population size. Positive shocks to productivity raise living standards immediately for those alive, but this induces them to have more kids (or induces their kids to not die as quickly, so to speak), leading to population growth, which lowers living standards. Variation in productivity across countries will thus show up in higher population, but not necessarily in higher living standards…. The adjustment back to the stagnant level of living standards can take a long time….

What about other uses of the term Malthusian?… Brenner and Bois use the term Malthusian to describe their opponents and their theories. And to me, this is an incorrect use…. There is nothing Malthusian about Postan, Le Roy Ladurie, and North and Thomas, at least when it comes to their explanation of institutional change. This doesn’t make Brenner and Bois wrong. It makes them semantically confusing…. I don’t consider myself a Malthusian in this sense of… [a] finite limit of resources…. Technological change will make some resource constraints less binding…. The income elasticity of demand for resource-intense goods is low…. [Assuming] that no matter how high productivity got, we are always producing goods using the same resource-intense production function… may be fine if you are just describing the stagnant economies prior to sustained growth – or maybe it isn’t… if you read Lemin Wu’s paper – but breaks down if you allow for any appreciable non-resource based sector…

Cursor and Who are you calling Malthusian Dietrich Vollrath Cursor and Who are you calling Malthusian Dietrich Vollrath Cursor and Who are you calling Malthusian Dietrich Vollrath

Should-Read: Martin Feldstein, Ted Halstead and Greg Mankiw: A Conservative Case for Climate Action

Should-Read: I see no reason why this could not have been written and published in, say, August of 2009. No reason, that is, save that Mitch McConnell and John Boehner had passed the word that Obama was to get as few policy “victories” as possible.

Then it would have done good. Now? I may be wrong, but I can’t see it having any impact at all. Anytime you begin an oped with “crazy as it may sound…” and “call us nuts…”, I see you:

Martin Feldstein, Ted Halstead and Greg Mankiw: A Conservative Case for Climate Action: “CRAZY as it may sound, this is the perfect time to enact a sensible policy to address the dangerous threat of climate change…

…Before you call us nuts, hear us out….
Our co-authors include James A. Baker III, Treasury secretary for President Ronald Reagan and secretary of state for President George H. W. Bush; Henry M. Paulson Jr., Treasury secretary for President George W. Bush; George P. Shultz, Treasury secretary for President Richard Nixon and secretary of state for Mr. Reagan; Thomas Stephenson, a partner at Sequoia Capital, a venture-capital firm; and Rob Walton, who recently completed 23 years as chairman of Walmart….

The federal government would impose a gradually increasing tax on carbon dioxide emissions… at $40 per ton…. The proceeds would be returned to the American people on an equal basis via quarterly dividend checks…. American companies exporting to countries without comparable carbon pricing would receive rebates on the carbon taxes they’ve paid on those products, while imports from such countries would face fees on the carbon content of their products…. Finally, regulations made unnecessary by the carbon tax would be eliminated, including an outright repeal of the Clean Power Plan…

Should-Read: Andrew Harless: Employment, Interest, and Money: James Medoff, Stagflation, the Phillips Curve, and the Greenspan Boom

Should-Read: My memory is that Andrew was a full coauthor on this work. And it certainly profoundly influenced us over at the Treasury–it definitely shaped how Bentsen talked to Greenspan…

Andrew Harless (2013): Employment, Interest, and Money: James Medoff, Stagflation, the Phillips Curve, and the Greenspan Boom: “James Medoff, my thesis advisor in graduate school and later my collaborator and business associate, died on Saturday, September 15 after a long struggle with multiple sclerosis…

…I was a student of macroeconomics…. Why was there stagflation (stagnation and inflation at the same time) in the 1970’s?  When I was in graduate school, there were two popular (complementary) explanations. First, the Fed had been too easy because it didn’t adequately account for the way inflation expectations would become ingrained…. Second, there were oil shocks, shocks to aggregate supply which drove prices up and employment down.  A third explanation you might also hear was that the Fed had responded to political pressure from the Johnson and Nixon (and possibly Carter) administrations and loosened at the wrong times…. Medoff-Abraham… said… that there was not nearly as much “stag” in the stagflation as we thought… [because] the unemployment of the 1970’s was largely “structural” (at least that’s the term used in debates about today’s unemployment), and once you realized that, the accompanying inflation shouldn’t surprise you.

When I took James’ graduate course in 1989, this idea was particularly important, because the situation was beginning to reverse itself.  The plateau in structural unemployment lasted from maybe 1975 to maybe 1987, and after that it began to decline.  By the time I graduated, in 1994, this decline was well underway, and our data were suggesting that the US economy could support considerably lower unemployment rates without sparking inflation.  James was invited to the Fed’s meeting of academic consultants that year to make the case for lower unemployment, and I went along to help and observe the discussion.  As I recall, there were about 10 people at the table, and James was the only one saying that it was OK to keep interest rates low and let the unemployment rate fall further.

Naturally, rather than listen to a single maverick, the Fed kept raising rates, and maybe that was for the best, since the recovery turned out to be stronger than most people (including us) had expected.  But over the next few years, something unusual happened.  The unemployment rate kept coming down, and the inflation kept not happening, and now it was Alan Greenspan himself, not some out-of-the-mainstream labor economist from Harvard, who was insisting (against some substantial resistance) that it was OK to keep interest rates low and let the unemployment rate continue falling.

Did James Medoff ultimately influence monetary policy, and was he therefore partly responsible for the boom of the late 1990’s?  Who knows?  If I had Alan Greenspan’s ear, I might ask him.  At his funeral, James’ daughter Susanna said that, in fifth grade, she had wanted to dress up as her father for “Dress as Your Hero Day,” but the teacher wouldn’t let her, so she dressed as Alan Greenspan instead.  In those days, a lot of adults may have considered Greenspan a hero, but I doubt many other fifth graders did.  For the record, I still think Greenspan did a remarkable job with the macroeconomic aspects of monetary policy, and his hero status (since rescinded by most commentators) was not without justification.

In any case, I feel that the research I mentioned is relevant today in a couple of ways.  For one thing, the saga of structural-vs-cyclical unemployment goes on today.  Using techniques similar to those used by Abraham and Medoff, my best guess is that, after the long decline that began around 1988, structural unemployment reached a trough in 2005 and has been rising since then.  (However, I see no particular evidence of a discontinuous increase during the Great Recession, or immediately before or after, and the increase since 2005 has not been particularly rapid, so I don’t buy the view that “our problem is structural.”)

Another way the research is relevant is that it reframes the 1970’s.  By the end of the 1970’s, most economists were convinced that, as textbooks put it during my undergraduate years and maybe still do, “the long-run Phillips curve is vertical.”  In other words, there is no long-run tradeoff between unemployment and inflation.  In the minds of most economists this conclusion was necessitated by the experience of the 1970’s, during which it seemed to become obvious that higher inflation was not generally associated with lower unemployment.  But if much of the problem of the 1970’s was structural, then the conclusion is not so obvious.  Perhaps, conditioning on the structure of the labor market, a downward-sloping Phillips curve still exists, even in the long run.  Indeed, more recent evidence suggests that there is such a tradeoff after all, at least at low inflation rates.

This is important because the US seems to be in the middle of that tradeoff right now.  If you believe there is no tradeoff, if you believe the long-run Phillips curve is vertical, then it’s hard to explain how there’s still any inflation at all after almost 5 years during which we had first an extremely deep recession and then a painfully slow recovery that has left output still well below any reasonable estimate of the economy’s potential.  After 5 years, we should surely be making our way toward the long run, that vertical Phillips curve at full employment. If we’re not, it must be because demand is astonishingly weak, and that astonishingly weak demand should be associated with an inflation rate that falls lower and lower until it becomes negative. (This is the flip side of an overheated economy that produces ever-accelerating inflation.) But that isn’t happening. Instead we’re seeing something that looks a little bit like the old-fashioned downward-sloping static Phillips curve, where low, but not necessarily falling, inflation rates are associated with persistent excess unemployment.

I admit this isn’t what I expected. I wrote a blog post a couple of years ago predicting deflation. Even after having questioned the conventional wisdom, I had found it too strong to resist. The vertical long-run Phillips curve, I thought, might not be quite right, but it was “a close enough approximation,” and if I denied this, I’d face excommunication from the Church of Macroeconomics. Deflation was coming, I thought.  I was wrong.

I never got a chance to discuss this question with James. During his last years he found it increasingly difficult to think and express himself clearly, so it’s unlikely we could have had a productive discussion. But I can imagine what he would have said 20 years ago. He would have talked about his contacts in industry and how they weren’t about to destroy morale by cutting wages, even if the economy stayed weak for several years. After some discussion I think we would have come to the conclusion that the vertical long-run Phillips curve was actually a pretty crummy approximation. That’s certainly what I think now. I’m going to have to pay more attention in the future to what Hypothetical James Medoff has to say. He lives on.

U.S. tax revenue will rise modestly in the next 10 years, no thanks to corporate taxes

Photo of the Internal Revenue Service (IRS) headquarters building in Washington.

The Congressional Budget Office’s latest budget and economic outlook for 2017 and beyond estimates that overall federal tax revenue will be on the rise over the next decade if current tax laws remain unchanged. Yet the CBO also anticipates that this growth in tax revenue will be tempered by decreases in receipts from specific sources, including the payroll tax and the corporate income tax.

The report forecasts that revenues will grow modestly relative to U.S. gross domestic product between this fiscal year ending September 30th and 2027. A majority of this growth is expected to be driven by an increase in revenues from individual income taxes, which will rise from 8.6 percent of GDP in 2017 to 9.7 percent of GDP by 2027 thanks to “bracket creep,” an aging population that will begin accessing more and more retirement income, and fast-growing earnings for those at the top of the income ladder. Revenues from payroll taxes and other taxes, which includes the excise, estate, and gift taxes, will see small declines from 6.0 percent and 1.5 percent of GDP to 5.9 percent and 1.2 percent of GDP in 2027, respectively.

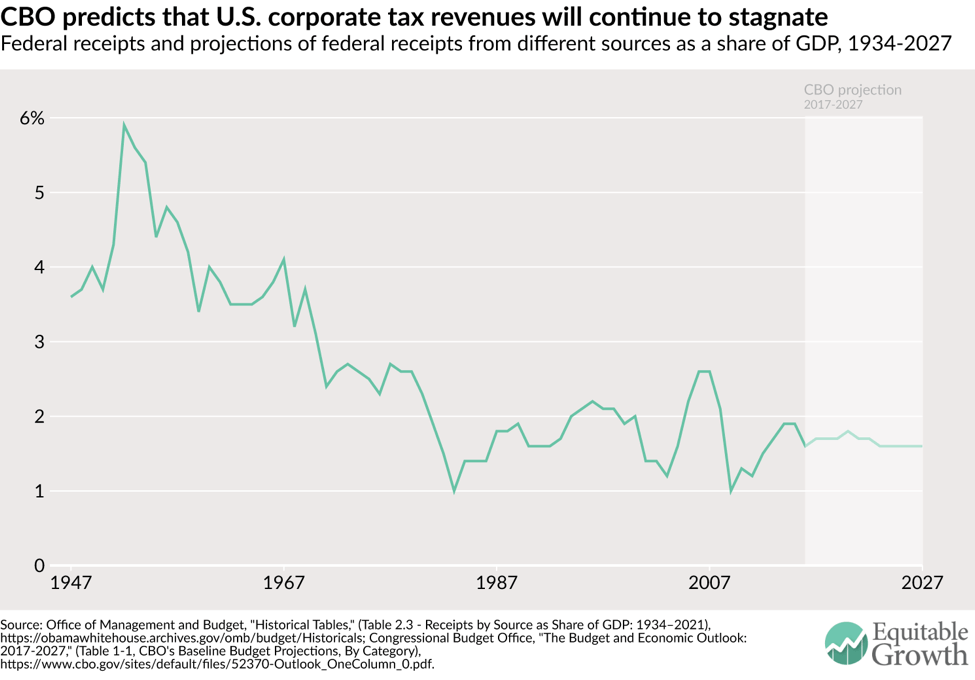
The trends in corporate tax revenues, however, are an interesting case. In fiscal year 2017, receipts from corporate income tax are expected to amount to 1.7 percent of GDP. By 2027, the Congressional Budget Office anticipates that these revenues will fall by 0.1 percentage point to 1.6 percent of GDP. This small predicted drop is actually part of a longer trend: In the United States, corporate tax revenues as a share of the economy have been relatively stagnant since the mid-1980s. (See Figure 1).

Figure 1

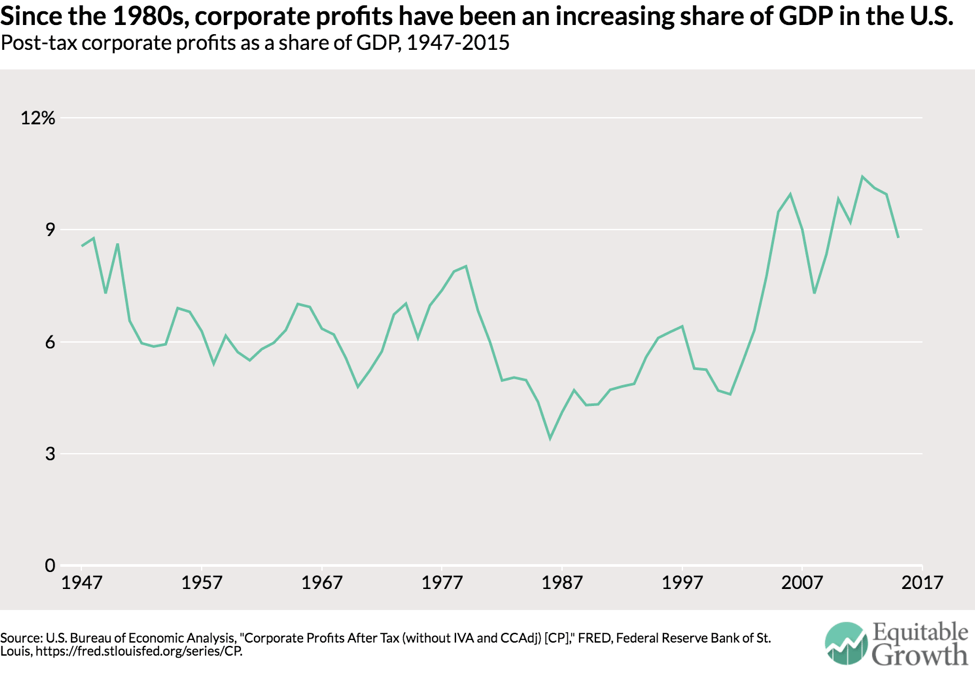
Over this same period, though, corporate profits have grown sharply. Between 1985 and 2015, corporate profits as a share of GDP rose by 4.4 percentage points. (See Figure 2.)

Figure 2

Rising corporate profits in a time when corporate tax revenues remain relatively stable suggests that effective corporate tax rates are declining. In fact, in their models, the Congressional Budget Office assumes that businesses and investors will continue to find new ways to reduce their tax rates, which is part of the reason that corporate receipts face a small decrease in the next decade. The continued erosion of corporate tax revenues will have long-term effects on total federal revenues and could even contribute to a further rise in income inequality.

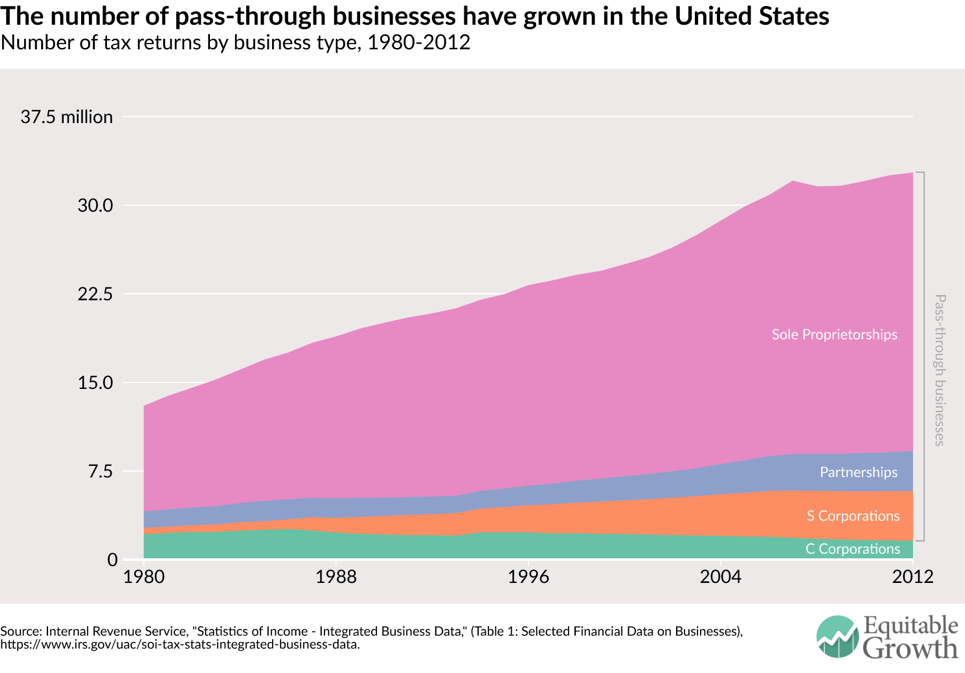
One strategy that businesses use to reduce their tax rates is to organize as a pass-through business, effectively reducing the tax base for the corporate income tax. S Corporations, Sole Proprietorships, and Partnerships are all considered to be pass-through businesses because the profits from these firms are not subject to corporate income taxes. Instead, the profits can be “passed-through” to the business owners and taxed only on their individual income tax returns. In contrast, owners of traditional C Corporations face two taxes: a corporate tax on profits and a tax to shareholders on profits that are distributed as dividends. The clear advantage of setting up as a pass-through business has greatly motivated owners to find loopholes, which has augmented their presence in the United States. (See Figure 3.)

Figure 3

Another strategy that businesses are increasingly using is corporate profit shifting. Corporate profits, for example, can be shifted out of the United States by increasing intercompany loans,  setting high transfer prices, or using a process known as corporate tax inversion. According to research by Kimberly Clausing of Reed College, who uses data from the U.S. Commerce Department’s Bureau of Economic Analysis, corporate profit shifting in 2012 alone reduced tax revenues by between $77 billion and $111 billion.

Again, if all current laws and tax codes remain unchanged, the Congressional Budget Office predicts these strategies will be used at a greater rate and corporate tax revenue will continue to stagnate as a share of GDP and actually fall relative to total corporate profits in the economy. But, with tax reform looming as a top priority for the Trump Administration and Congress, business may not stay as usual.

Speaker of the House Paul Ryan’s blueprint for tax reform—the likely template for Congress—would make several major changes to the corporate income tax code that would slash corporate tax revenues over time. Some of these changes include reducing the marginal tax rate on corporate profits from 35 percent to 20 percent and capping the tax rate on pass-through business profits at 25 percent. A recent analysis of the House of Representative’s plan by the Tax Policy Center found that if the House blueprint were implemented, $3 trillion in tax revenue would be lost over the next ten years. The TPC estimates that close to two-thirds of those losses would come from changes to the corporate tax code. What’s more, there is skepticism that the Ryan plan would lessen incentives for creating pass-through entities or fully stop U.S. corporations from shifting their profits to earn most of their income overseas in the first place.

Whether laws and tax codes remain the same or are reformed according to the House blueprint, it is clear that over the next decade corporate tax revenues need to be better preserved. Given that corporate taxes are one of the most progressive taxes in the federal system, policymakers must consider a way to recoup these losses or else we’ll be saddled with even wider income inequality.

Why the United States still needs paid family and medical leave

Senator Kirsten Gillibrand (D-NY) and Representative Rosa DeLauro (D-CT) yesterday reintroduced their bill to establish a federal paid family and medical leave program—the FAMILY Act. First introduced in 2013, the bill would give mothers and fathers 12 weeks of job-protected leave at 66 percent wage replacement—funded by a 0.4 percent increase in the payroll tax, split evenly between employers and employees. The Trump administration also is on record supporting paid leave for new mothers (and recently indicated it may consider paid leave for new fathers), though it has not specified how to pay for the program. With these efforts by policymakers in mind, it’s a good opportunity to briefly look at the policy landscape for paid leave and the economics of job protected leave.

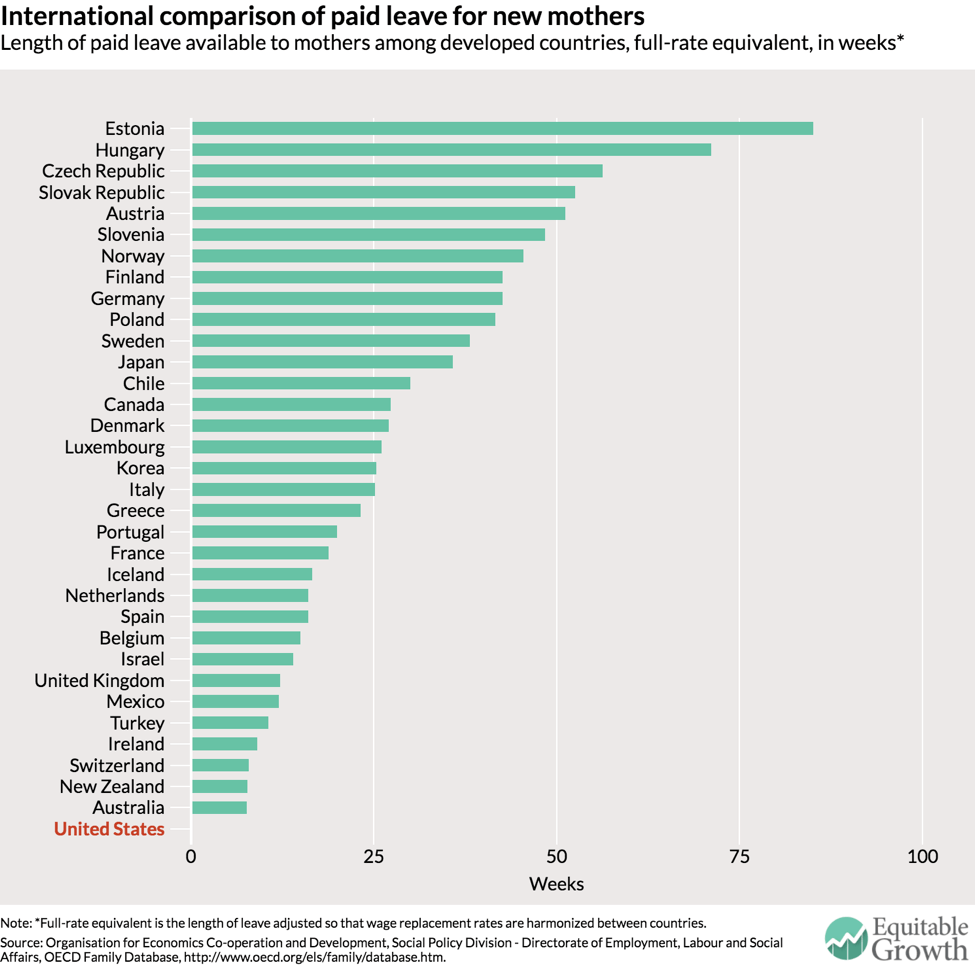
Internationally, the United States is a major laggard on expenditures on childcare and work-life benefits, and is alone among member countries of the Organisation for Economic Co-operation and Development in not providing any paid leave to new mothers. (See Figure 1.)

Figure 1

Within the United States, California, New Jersey, Rhode Island, and New York have enacted paid leave programs, and the District of Columbia has recently passed a version of its own—it just awaits Mayor Muriel Bowser’s signature. All in all, 13 percent of workers in the United States have access to paid family and medical leave through state and local paid leave programs, as well as private employer plans.

These state and local programs provide insights into the economic effects of paid leave. In California, where workers can take up to six weeks of paid leave, researchers find that following implementation not only were workers much more likely to take leave following the birth of a child, but they more often returned to work following their period of leave. In the three years following child birth, researchers find that hours worked increased by 10 to 17 percent. Among women who were employed during their pregnancy, paid family leave raised the probability of returning to work within a year of childbirth by 10.5 percentage points. Cross-national evidence (including California) shows that female employment rates increased by about 2.5 percent relative to their male counterparts with the introduction of paid leave.

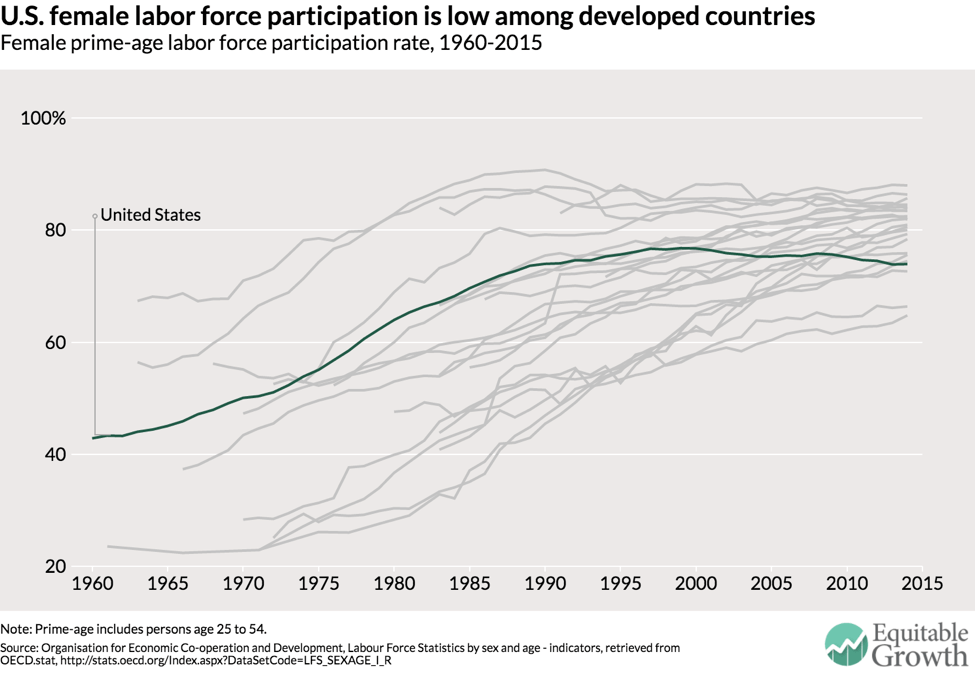
Since 1948, when data was first collected, U.S. labor force participation for women ages 16 to 64 was 32 percent. Today, that number has only risen to 56.8 percent. The difference is even more stark for prime-age workers, or those between the ages of 25 and 54, which economists use to control for demographic changes. Prime age participation grew from 38.9 percent to 73.4 percent from 1955 to 2015. Yet since the mid-1990s this progress has stalled out and even reversed slightly. Meanwhile, other advanced economies have seen women enter their labor forces unabated. The U.S now ranks 21st out of 24 OECD countries in prime-age female labor force participation. (See Figure 2.)

Figure 2

Research suggests this decline is largely due to a lack of work-life policies at the national level, and that the availability of paid leave increases the labor force participation rate of women. An influential examination of the economics of paid leave in Europe by University of Virginia economist Christopher Ruhm finds that paid family and medical leave programs raised the employment-population ratios of women by 4.2 percent.

Paid leave is not just a policy that would improve the individual lives of those who struggle to balance their responsibilities as a worker and as a caregiver. Paid leave also would boost U.S. economic growth and further equalize labor market disparities between men and women. The people who are left on the sidelines aren’t just missing out on income for themselves and their families, but they represent missing productive capacity for the entire economy.


What U.S. Labor Department appointee Puzder doesn’t know about the minimum wage and how labor markets work

When the U.S. Senate begins hearings on the appointment of Andrew Puzder—President Trump’s choice to head the Department of Labor—it is important to consider his qualifications for leading a federal agency tasked with overseeing and enforcing the nation’s labor laws. Beyond his experience as chief executive of CKE Restaurants Holdings Inc., the privately held owner of several fast-food chains (among them Carl’s Jr.), Puzder has been an outspoken critic of labor regulations including minimum wage laws, overtime protections, and health and safety regulations.

Through the record of his op-eds, lobbying work on the behalf of the National Restaurant Association, and blog posts, policymakers and the public can get a clear picture that some of his opinions and beliefs are simply at odds with the facts or at the very least ignorant of recent evidence. In this issue brief, I compare some of Puzder’s widely publicized claims about the very labor regulations he would be tasked with upholding and enforcing, should he be approved by the Senate.

Download File
U.S. Labor Department appointee, the minimum wage, and labor markets

Read the full PDF in your browser

Minimum wage

Claim: “Instead of creating a living wage, the fight for dramatic minimum-wage increases could leave millions with no wage at all.”1

Puzder has opined about the consequences of raising the minimum wage more than any other topic. In this statement above and others like it he claims that even moderate minimum wage increases will lead to massive jobs losses. Rather than offering credible academic evidence, he typically bases these claims on simple platitudes such as “make something more expensive and employers will use less of it.”2

Yet there is an emerging consensus among economists that moderate increases in the minimum wage have no detectable negative impact on employment. This finding stems from research that examined every state-level minimum wage increase since the early 1990s and compares what happens to employment in low-wage sectors such as restaurants and among teenagers in counties that lie along a state border (where the minimum wage went up) versus counties on the other side of the state border.3 This careful research design amounts to an apples-to-apples comparison and does not make the mistake of comparing employment trends across states that have dramatically different population trends and economic bases. Several additional papers find similar results.4

Similarly, a host of economists have offered more realistic models of the labor market—models that recognize the natural dynamism of the so called labor-matching process between workers and employers. One of the key reasons that economists believe that moderate minimum wage increases do not lead to job losses stems from the observation that the typical textbook model of the labor market where employers are simple price takers and instantaneously match perfectly observable supply and demand curves hardly approximates the “real world.” Indeed, under these same models, a minimum wage increase actually kills job vacancies rather than jobs because employees stay longer in their current positions rather than moving to other jobs across the street.

Instead, workers value their jobs more under a higher wage and put in more effort, resulting in higher productivity and a lower firing rate. Empirical research bears this out, as turnover-rates fall dramatically in the face of a minimum wage increase.5 Ultimately, Puzder’s views on the minimum wage do not take into account new and important credible economic research.

Healthcare

Claim: “The evidence that Obamacare is having a negative impact on hiring is unequivocal, abundant and consistent with common sense.”6

Puzder also has written extensively about the costs of the employer-mandate component of the Affordable Care Act. Not surprisingly, he opposes this regulation, basing his views on the burdensome costs that restaurant owners and other low-wage employers will have to pay. Yet in the course of his arguments he misrepresents some basic facts about employment data that are published by the U.S. Bureau of Labor Statistics, which is part of the Department of Labor that he seeks to lead.

Puzder erroneously claims that the vast majority of large employers are switching from hiring full-time workers to part-time workers to avoid the 30-hour-per-week threshold for the employer mandate to provide heath care under the Affordable Care Act. He looks at one six-month period of BLS data in 2014 and concludes that the only new jobs added were part time jobs.7 This claim seemed so unfounded that I simply looked at the record of job creation since the last quarter of 2013—the quarter in which the so-called “look back period” could plausibly begin before the mandate actually took effect at the beginning of 2014—through to the end of 2016. The data show just the opposite of what Puzder claims. (See Figure 1.)

Figure 1
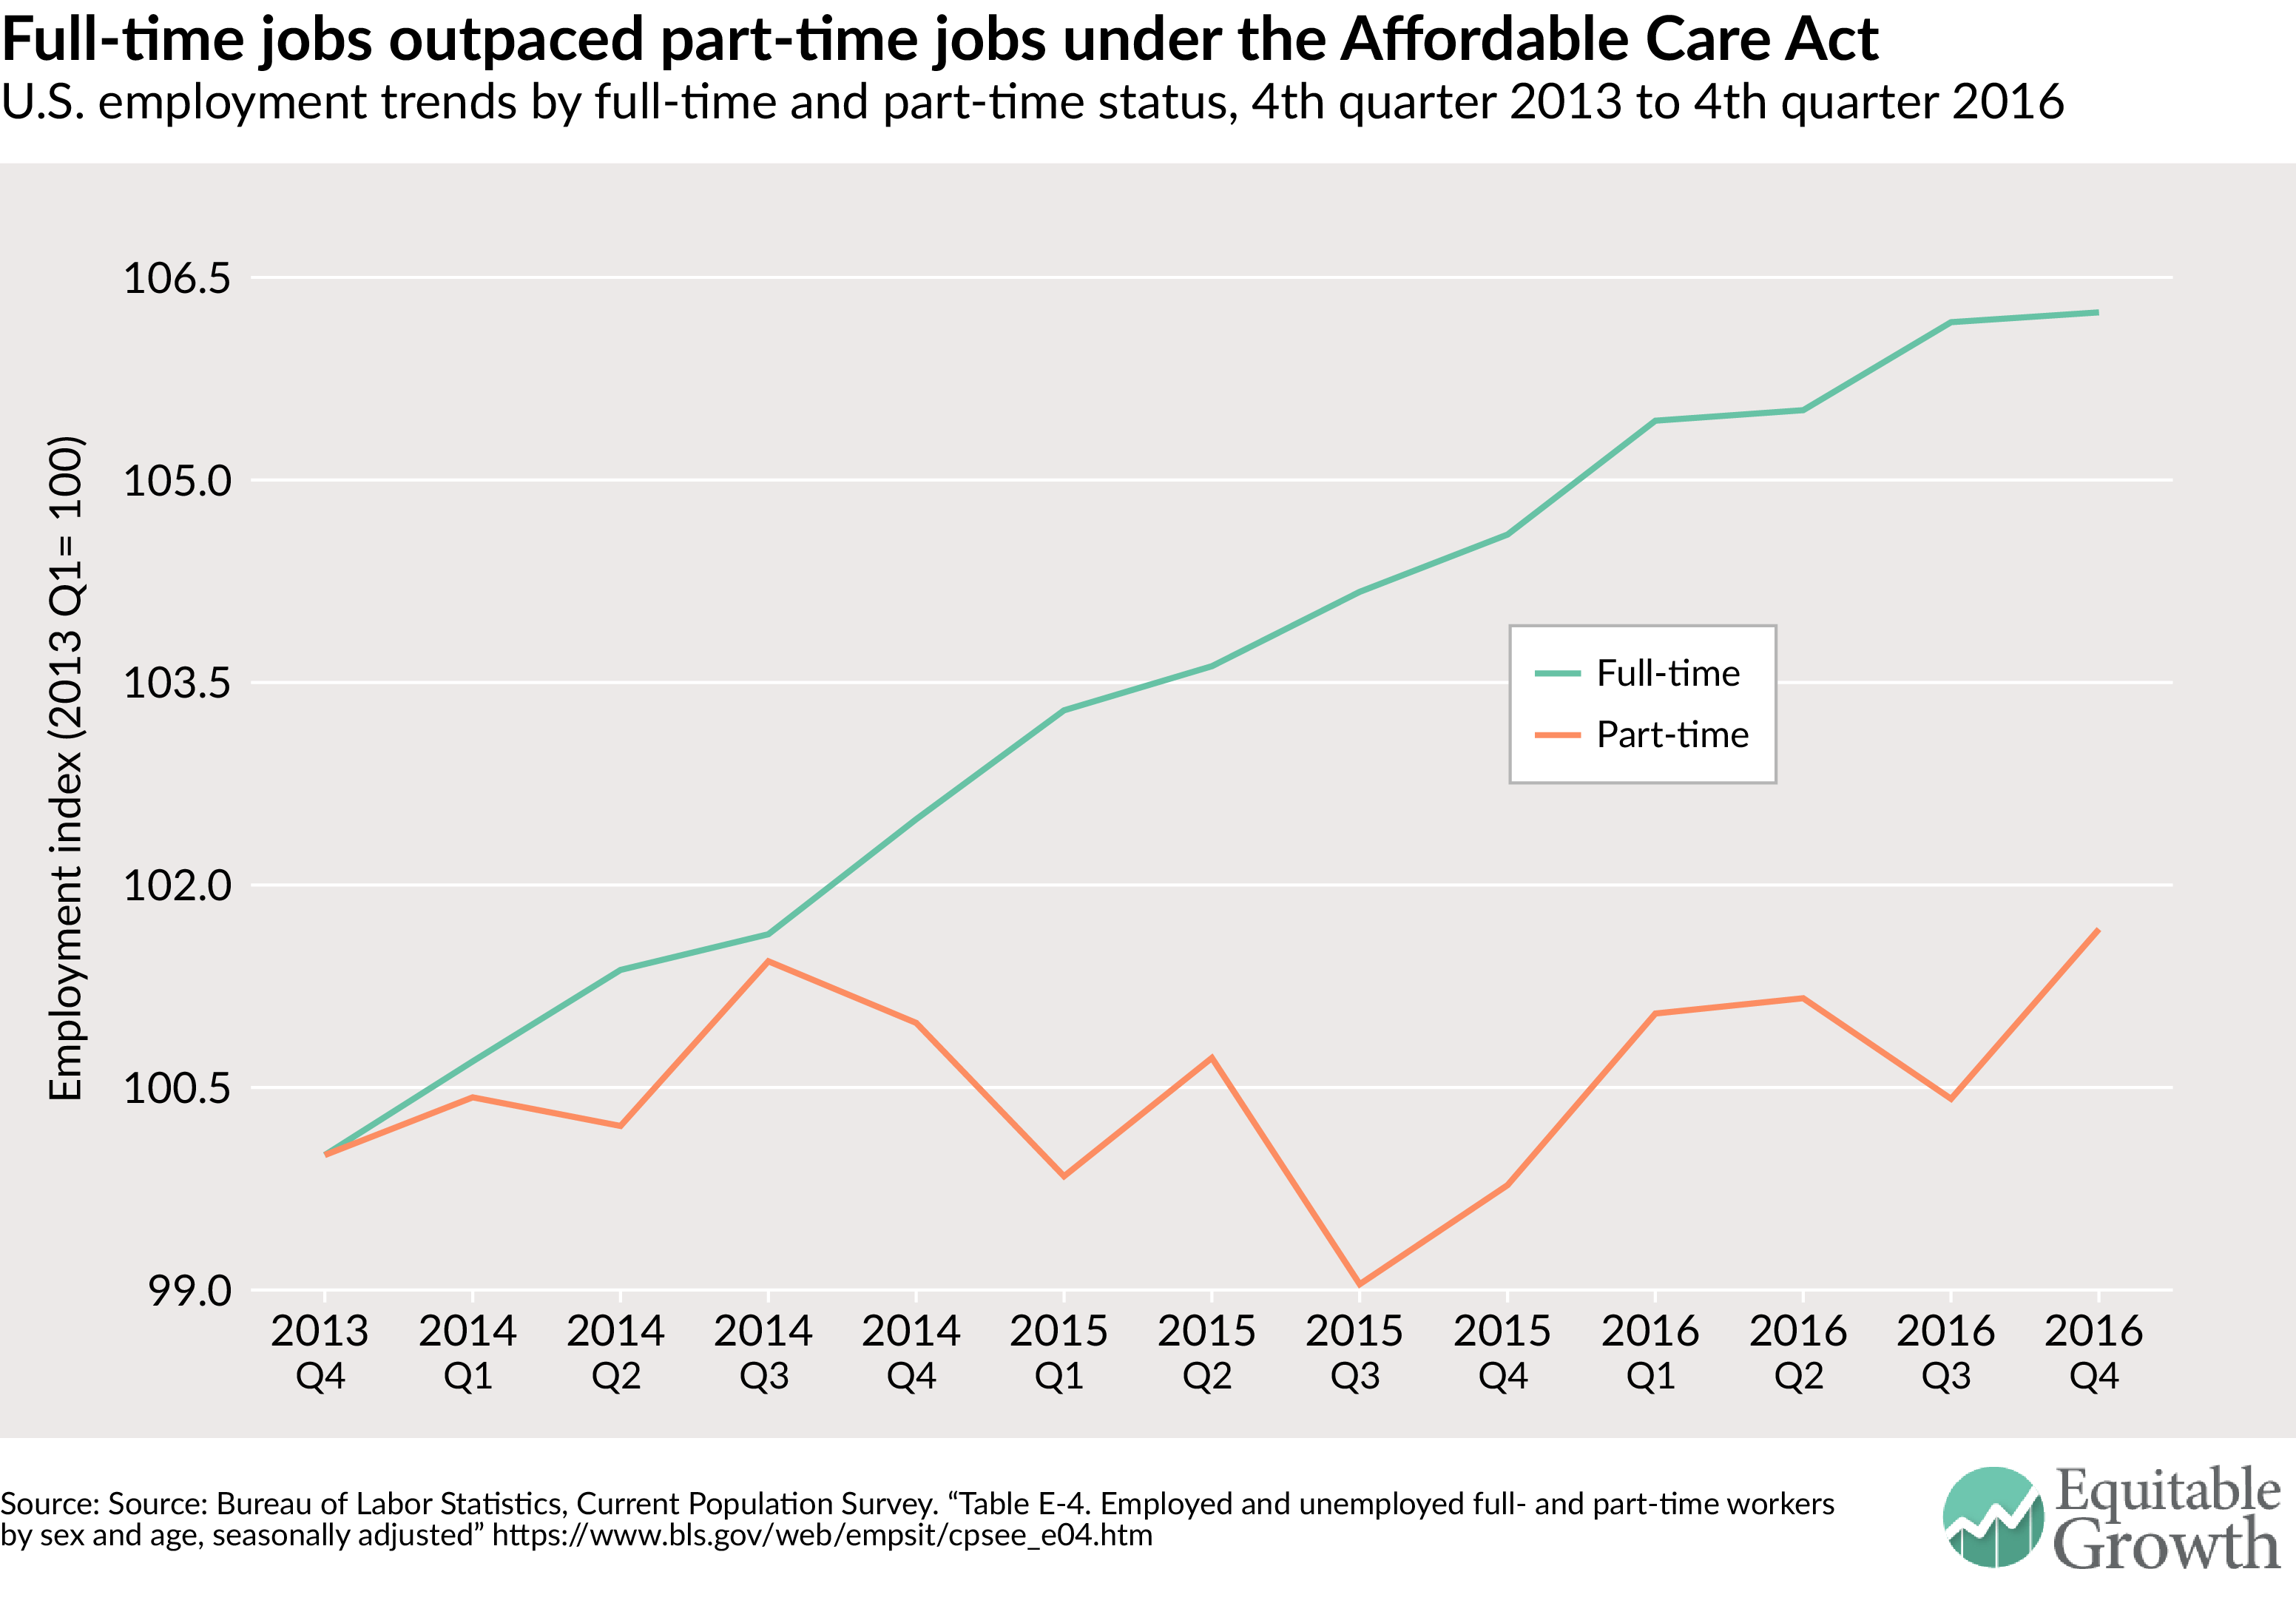
More specifically, based on a basic interpretation of this data, we can see that contrary to Puzder’s claim, the pace of job creation was faster for full-time workers than part-time workers, growing 6.2 percent since the 4th quarter of 2013, compared to 1.7 percent, respectively. If employers were sharply shifting toward part-time work, then we would expect to see the opposite trend.

Even though the data betray the point the Puzder was trying to make, he still bases his opposition to the employer mandate based on a faulty and simplistic understanding of the labor market. He views workers as perfectly interchangeable units that lack the possibility for learning on the job or improving productivity. He writes:

“The logic for businesses is simple. If you have three employees working 40 hours per week they will produce 120 labor hours. Five employees working 24 hours per week also produce 120 labor hours. Employers must offer the three full-time employees health insurance or pay a penalty. They have no such obligation to the five part-time employees, making part-time employment less costly.”8

One reason why employers haven’t shifted completely away from full-time work is that full-time workers tend to be better, more experienced workers who, in return for more hours, are ultimately more productive.

Recent research in the very industry Puzder bases his expertise on bears this out. In a recent paper, I compared the labor practices of full-service restaurants in two metropolitan regions with vastly different labor regulations—San Francisco—which has a $15 minimum wage, an employer healthcare mandate, and paid sick leave—and the Research Triangle in North Carolina, where no local mandates are allowed.9 Based on interviews with restaurant owners and managers from a variety of sizes and price levels, several things stood out.

First, employers in San Francisco conducted more careful searches for highly skilled employees who invested in their own training and were ultimately more productive. Employers there were more likely to talk about their workers as professionals, rather than replaceable units. Turnover rates in San Francisco in the restaurant industry were markedly lower than in North Carolina as a result. Second, many employers in North Carolina, who are allowed to paid tipped workers a wage as low as $2.13 per hour, built a business model that accepts an extremely high turnover rate and invests little in improving worker productivity. Moreover, restaurant managers in North Carolina were more likely to view workers as disposable and easily replaceable.

The upshot: policymakers need to consider more carefully Puzder’s understanding of at least these two aspects of his prospective job heading up the Department of Labor—the importance of the minimum wage for broad-based wage growth in the U.S. economy, the very basic evidence about the impact of workers’ benefits on the creation of full-time and part-time jobs, and the importance of higher wages and benefits on economic productivity and employer profits.

—T. William Lester, Associate Professor of City and Regional Planning, University of North Carolina-Chapel Hill

JOLTS Day Graphs: December 2016 Report Edition

Every month the U.S. Bureau of Labor Statistics releases data on hiring, firing, and other labor market flows from the Job Openings and Labor Turnover Survey, better known as JOLTS. Today, the BLS released the latest data for December 2016. This report doesn’t get as much attention as the monthly Employment Situation Report, but it contains useful information about the state of the U.S. labor market. Below are a few key graphs using data from the report.

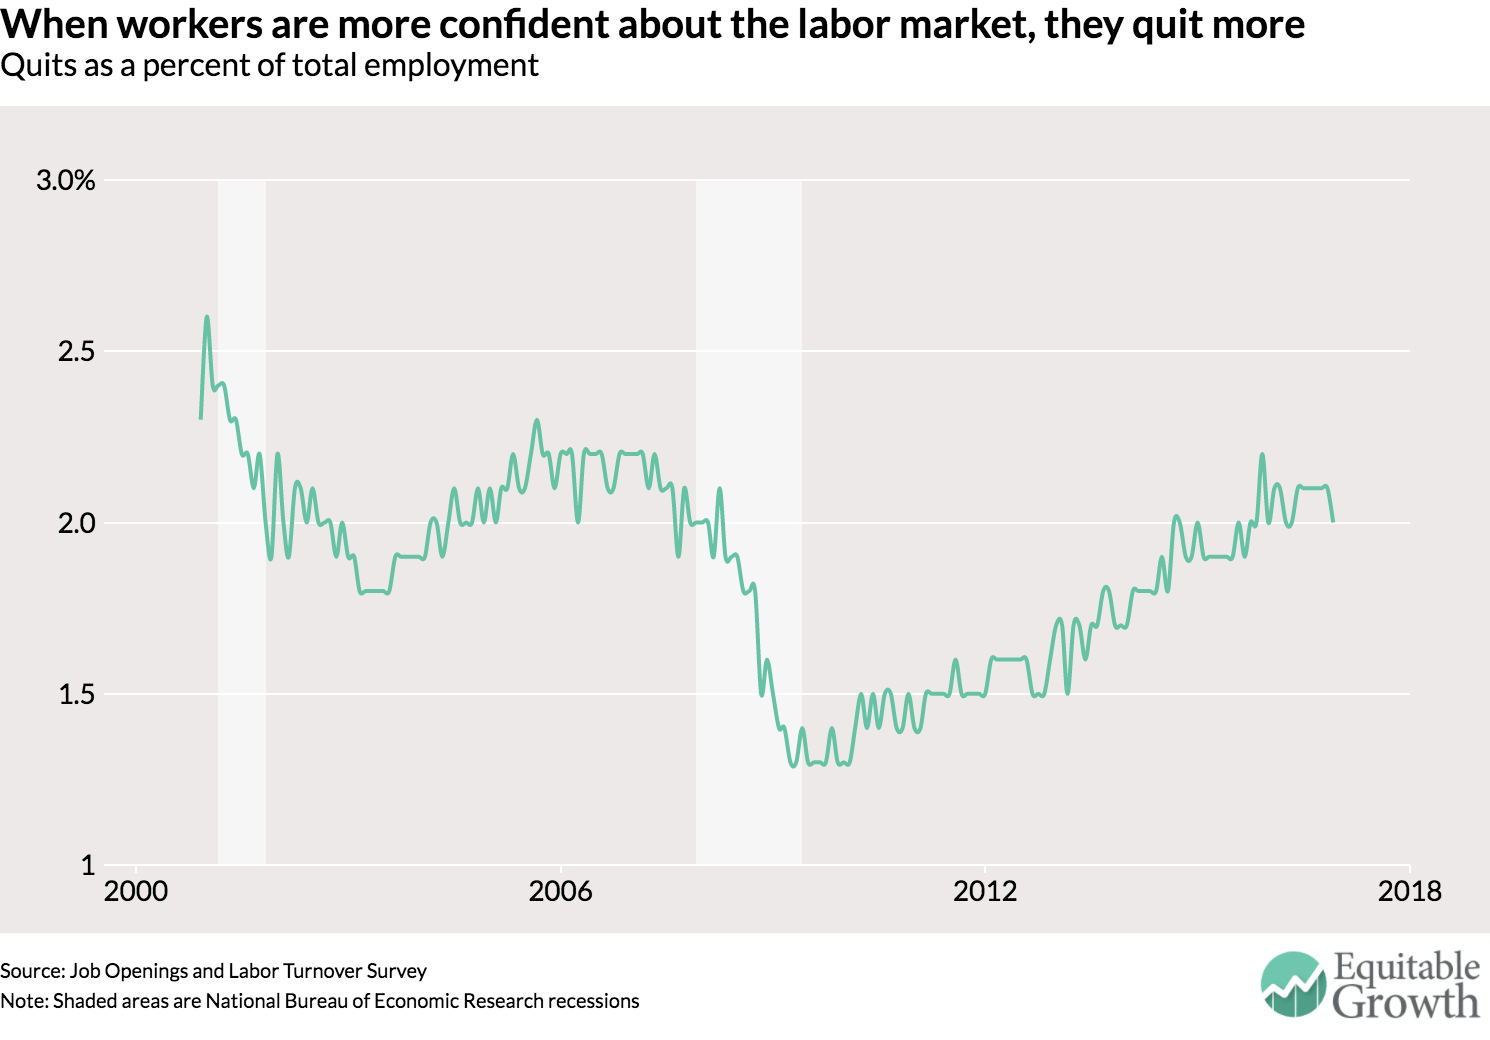
The quits rate dropped in December in 2 percent. The quits rate is at pre-recession levels, though other data show quitting and job-switching was more common during the late 1990s.

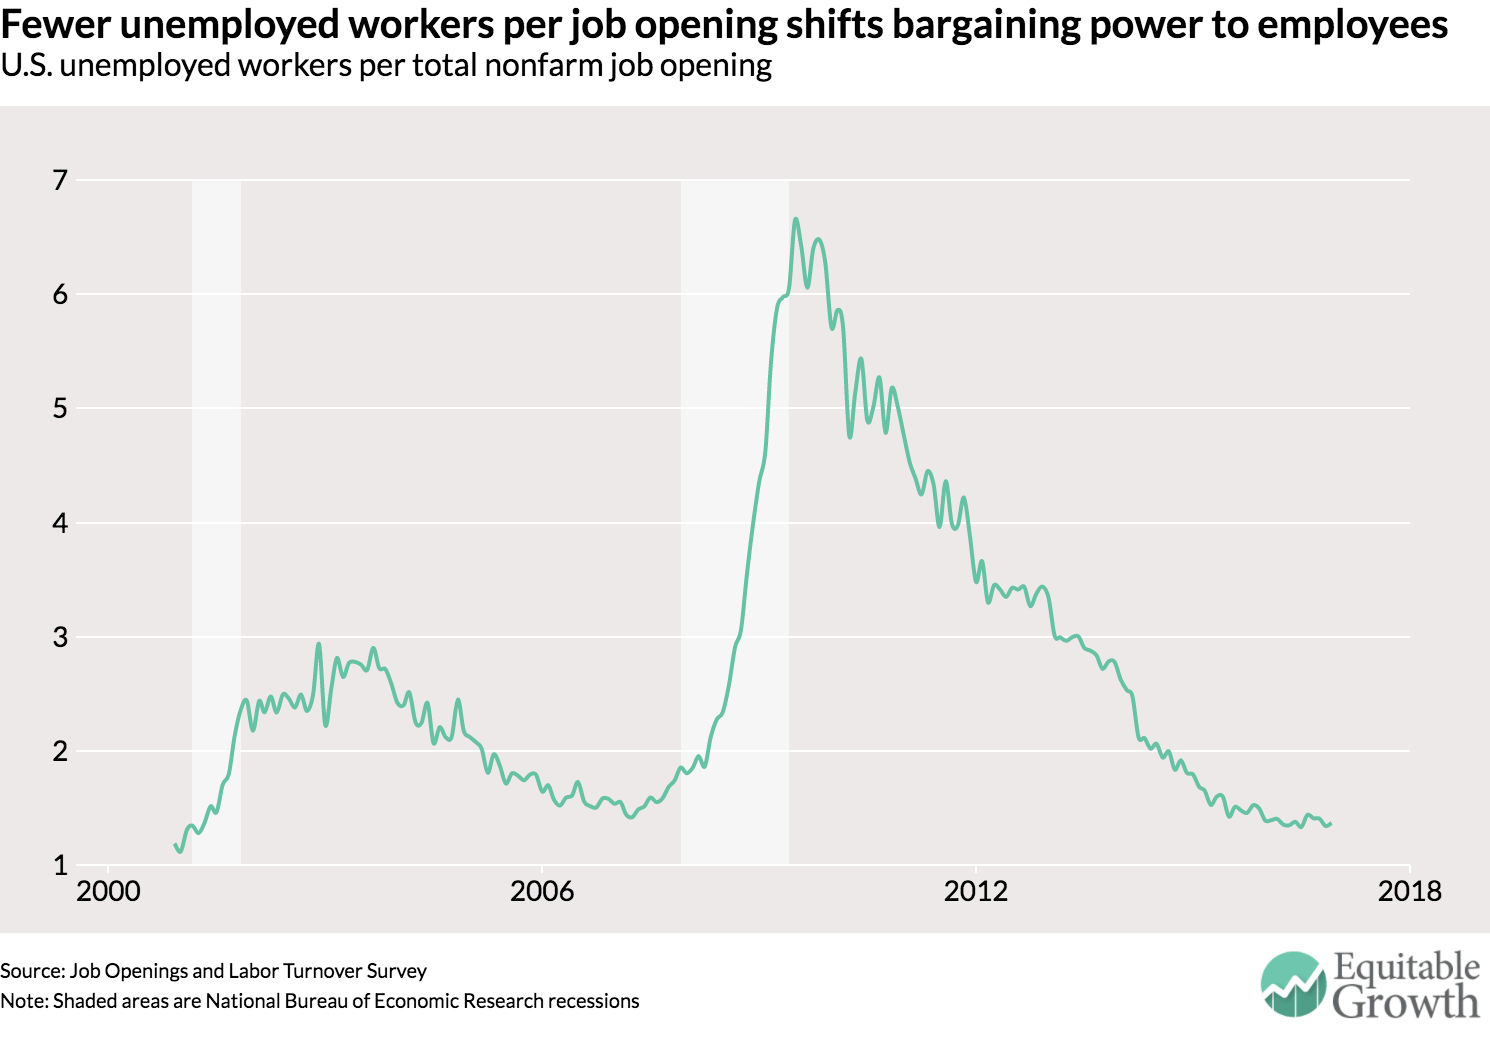
The decline in the unemployment-to-job-opening ratio has slowed in recent months. If this is due to an increasing labor force, then the slowdown might have a silver lining.

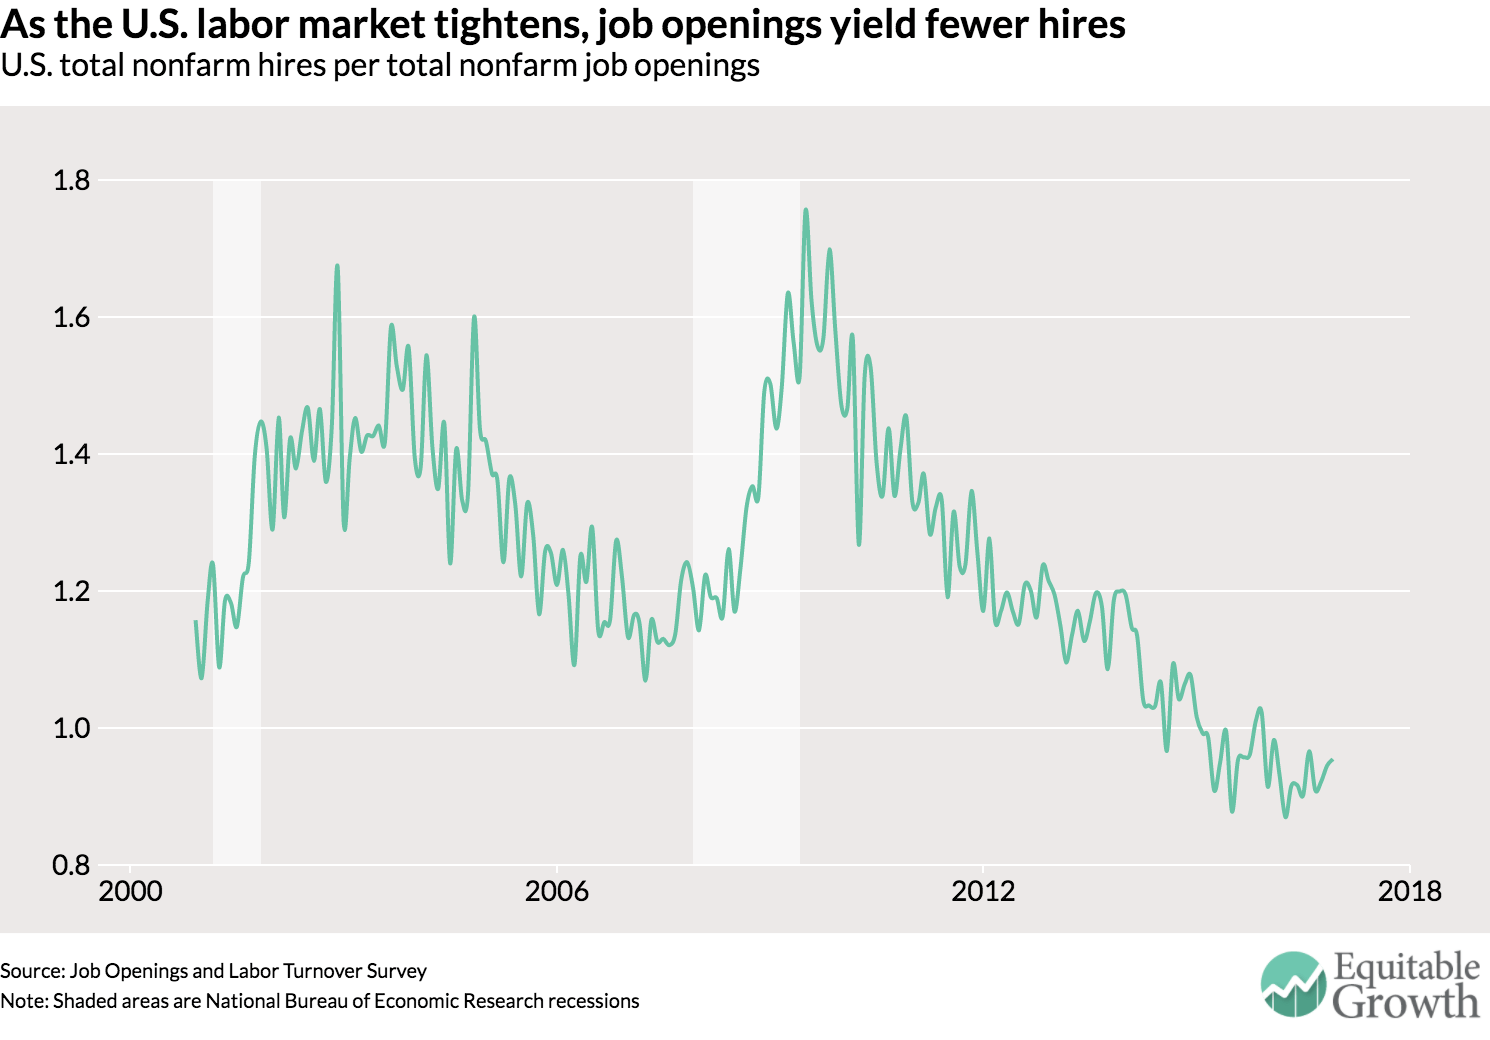
The vacancy yield was essentially unchanged in December, but the overall trend is downward as the labor market tightens. If job openings continue their strong growth, then the decline in the yield of few hires per job openings could continue for quite some time.