A potentially new and rising concern: inflation inequality in the United States

One dollar bills in a tip jar at a car wash in Brooklyn, NY.

The rich are different from you and me. They have different consumption baskets.

At least that is the tentative conclusion that some scholars are making in their recent research on the differences in consumption and prices across the U.S. income distribution. Differential inflation rates might not sound like the most exciting topic in the world, but differences in changes in prices and how these differences would impact the level of inequality, the relative gains from increased international trade, and the value of government transfer programs are meaty topics.

In a paper released today as part of the Equitable Growth working paper series, Stanford University post-doctoral fellow Xavier Jaravel looks at how changes in the income distribution affect differences in product innovation. In other words, Jaravel wants to see if more income at the top means more innovation in products that high-income people buy. He ends up finding that’s exactly what happens, with the result being an inflation rate for high-income households about 0.65 percentage points per year lower than for low-income households.

Another paper, released by the National Bureau of Economic Research earlier this year finds very similar results. Looking at similar data to Jaravel, Benjamin Faber and Thibault Fally of the University of California, Berkeley find a significant difference in the kinds of goods purchased by households in the top 20 percent by income versus those in the bottom 20 percent. Households in the top one-fifth consume more goods from large companies. High-income households tend, for example, to buy more brand name goods than low-income households. The authors say this happens because high-income consumers value higher-quality goods, and large firms can produce a large amount of high-quality goods more cheaply than smaller firms.

This difference ends up having some relevance in certain situations. If income starts flowing more toward high-income households, for example, then companies will have an incentive to increase the quality of their goods. Since larger firms are better at quality production, the prices at large firms will be relatively lower. This would mean that the inequality of inflation-adjusted income would be even larger due to a lower inflation rate for high-income households.

Similarly, if international trade is liberalized, more international competition boosts the share of imported goods, which, in Faber and Fally’s model, will tend to be from higher-quality larger firms. The result is that the richer gain more from the price declines brought on from trade, making the consumer benefits from international trade less progressive than previous studies had indicated.

If both these papers are generally correct, then the differences in inflation also have another implication. If the prices faced by those at the bottom and middle of the income distribution grow faster than the average prices reported in the Consumer Price Index or the Personal Consumption Expenditure price index, then U.S. government safety-net programs should grow at a faster pace. The growth of many programs is tied to overall inflation measures, so they may not be keeping up with the pace of inflation that low-income households actually experience.

Of course, such adjustments should wait until we have far more evidence on this possibility. Given the numerous ways that inequality in inflation could influence our understanding of the economy, this is evidence policymakers and researchers should be very interested in.

Product innovations and inflation in the U.S. retail sector have magnified inequality

Customers shop for organic groceries at the Whole Foods Market Arroyo Parkway store in Pasadena, California.

Do product innovations affect economic inequality? In a new working paper published today, I find that shifts in income distribution in the United States lead to product innovations that target high-income households, which increases purchasing-power inequality. Such product innovations have both a direct effect on purchasing power across income groups because they target specific groups, as well as an indirect effect through competition with products already in the marketplace.

In short, wealthier households are more likely to spend on product categories where product innovations are more common and where competition is increasing, while low- and middle-income households are more likely to purchase products that face less competitive pricing pressures in the marketplace. For economic policymakers, this dynamic has important implications for the price indexation of government programs that provide support for low- and middle-income families.


New Working Paper
The unequal gains from product innovations: Evidence from the US retail sector


Here’s the new fact

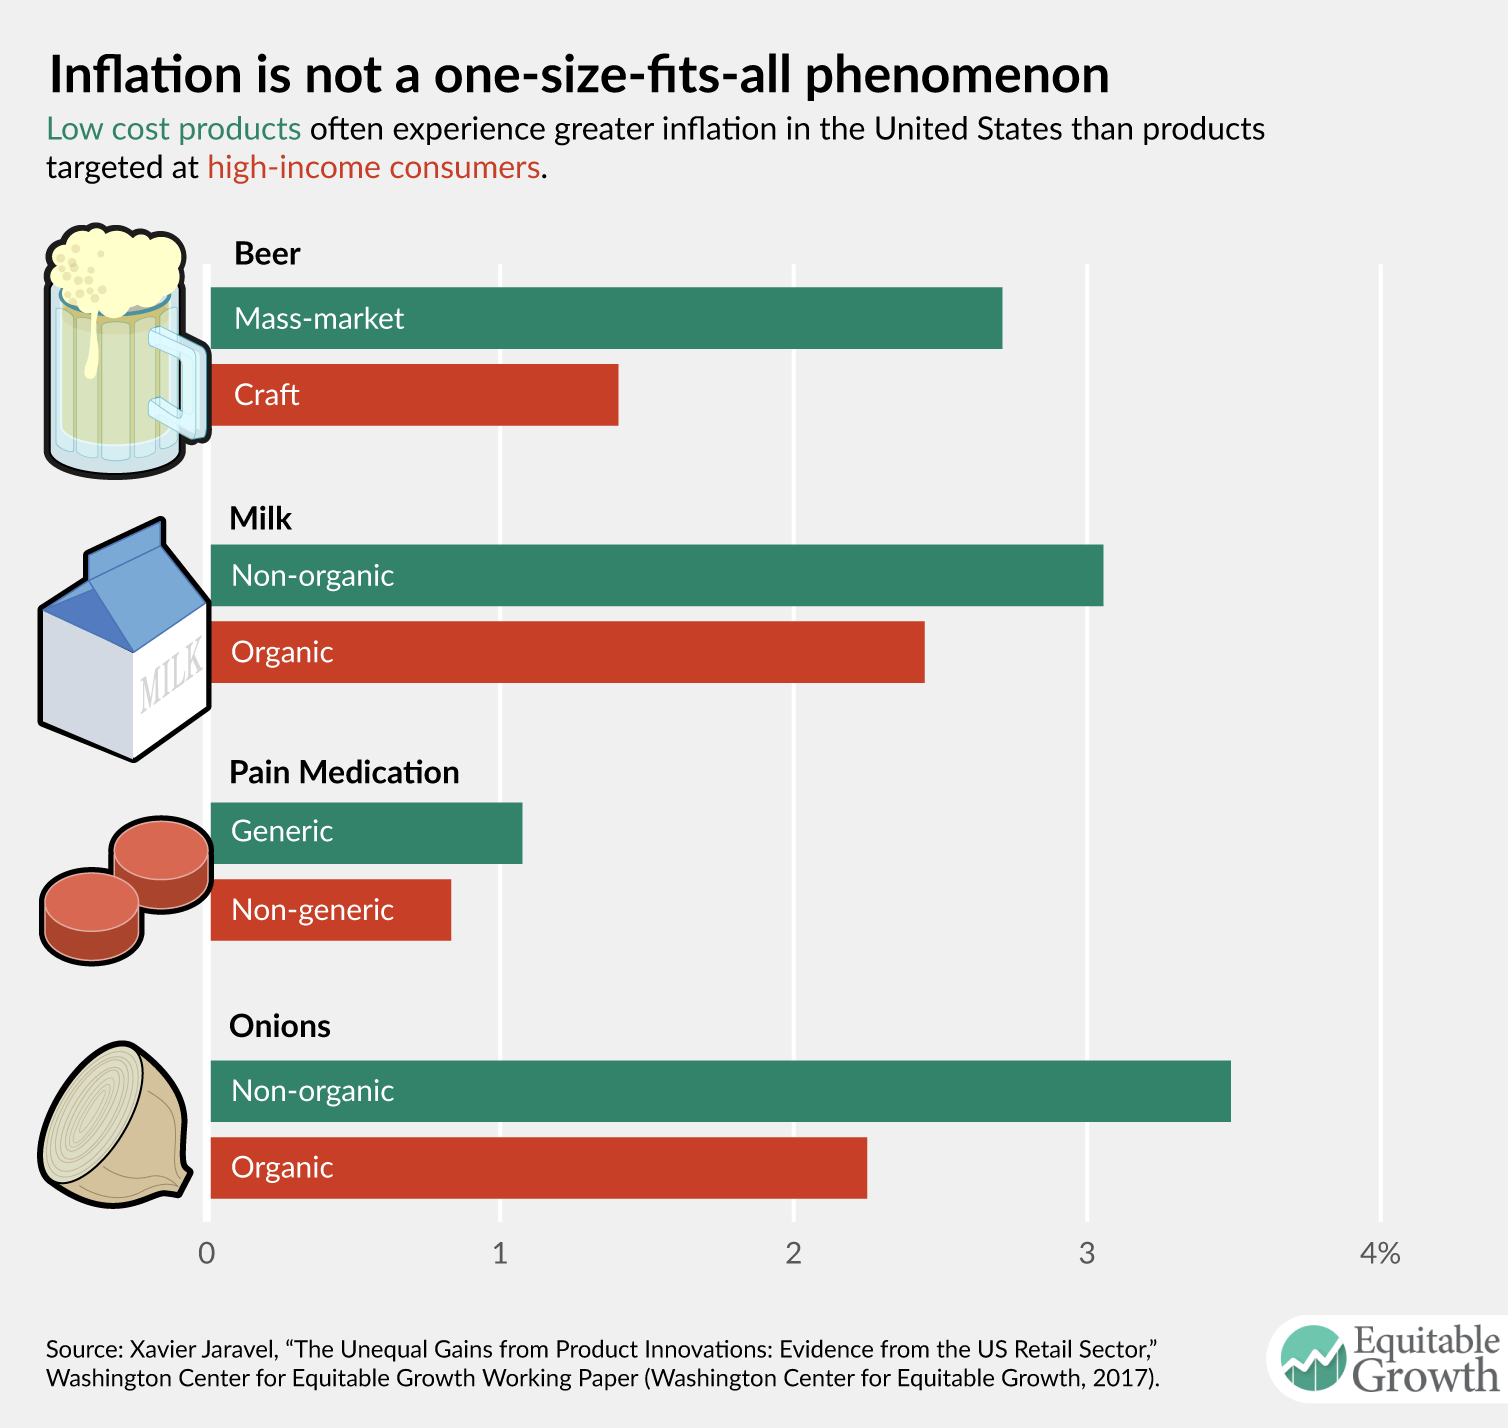
In the first part of my analysis, I measure how the introduction of new products and price changes on existing products affect economic inequality in a setting where very detailed data are available. I examine scanner data recorded at cash registers in the U.S. retail sector between 2004 and 2015—covering broad product categories, including food, alcohol, beauty and health, general merchandise, and household supplies, all of which account for 15 percent of household expenditures. I find that product categories predominantly consumed by high-income households—such as organic food, craft beer, and branded drugs—feature higher levels of product innovations (measured by entry of new products) and lower levels of inflation (measured using price changes on already existing products).

The accompanying infographic charts how this dynamic plays out in the marketplace for four everyday consumer products. (See Figure 1.)

Figure 1

Taking into account the 3 million products in the database, these price effects are large. In the U.S. retail sector, annual inflation was 0.65 percentage points lower for households earning more than $100,000 per year, relative to households making less than $30,000 per year. The current methodology used by statistical agencies, including the U.S. Department of Labor’s Bureau of Labor Statistics, cannot capture this difference, which arises primarily because income groups differ in their spending patterns along the quality ladder within detailed item categories. (BLS currently collects data measuring income-group-specific spending patterns across broad item categories, leading to aggregation bias.)

Explaining the new fact

In the second part of my analysis, I find that the patterns of product innovations and inflation inequality in the U.S. retail sector resulted from the response of firms to so-called market-size effects. Specifically:

  • The demand for products consumed by high-income households increased because of growth and rising income inequality.
  • In response, firms introduced more new products catering to such households.
  • As a result, already existing products in these market segments lowered their price due to increased competitive pressure.

To establish empirically the causal effect of increasing demand on firms’ product innovations, I study the effect of changes in demand resulting from shifts in the national income and age distributions over time. I find that increasing demand in a market segment leads to the introduction of more new products and lower inflation for already existing products due to increasing competitive pressure. For instance, in the case of craft beer, new varieties of craft beer are constantly being introduced, and this increase in competition keeps inflation low for existing varieties of craft beer, while competition is more stable and inflation is higher for more longstanding products in the market such as mass-produced beer.

Implications

The results of the analysis suggest that two trends are at work in the U.S. economy today. First, economic inequality has increased faster than is commonly thought because of the dynamics of product innovations and inflation. And second, rising income inequality has an amplification effect because when high-income households get richer, firms strategically introduce more new products catering to these consumers, which increases inequality further.

One limitation of the analysis is that it primarily covers the U.S. retail sector only from 2004 to 2015. Yet I find a similar trend of lower inflation for higher-income households when considering the full consumption basket of U.S. households going back to 1953 using data from the Consumer Price Index and the Consumer Expenditure Survey.

Moreover, the results from the U.S. retail sector have direct implications for the indexation of various government safety-net programs that are currently indexed to the food Consumer Price Index such as the U.S. Department of Agriculture’s Supplemental Nutrition Assistance Program (also known as food stamps). Based on the sample of goods examined in my research, I find that indexation of the benefits on the food Consumer Price Index implies an increase in nominal food stamp benefits of 24.8 percent between 2004 and 2015. In contrast, indexation of the benefits on the relevant food price index for households eligible for supplemental nutrition assistance would imply a much higher increase of 35.5 percent because these households effectively face a higher food inflation rate.

—Xavier Jaravel is a post-doctoral fellow in economics at Stanford University.

Download File
031417-jaravel-product-innovation

Read the full PDF in your browser

Should-Read: Paul Demko: White House analysis of Obamacare repeal sees even deeper insurance losses than CBO

Should-Read: Paul Demko: White House analysis of Obamacare repeal sees even deeper insurance losses than CBO: “A White House analysis of the GOP plan to repeal and replace Obamacare shows even steeper coverage losses than the projections by the Congressional Budget Office…

…according to a document viewed by POLITICO on Monday…. 26 million people would lose coverage over the next decade, versus the 24 million CBO estimates. The White House has made efforts to discredit the forecasts from the nonpartisan CBO…. 17 million for Medicaid, six million in the individual market and three million in employer-based plans. A total of 54 million individuals would be uninsured in 2026 under the GOP plan, according to this White House analysis. That’s nearly double the number projected under current law…

Must-Read: Mark Thoma et al.: The Republican American Health Care Act

Must-Read: Mark Thoma et al.: The Republican American Health Care Act


Mark Thoma: Why the Republican Health Care Plan Is Destined to Fail: “Healthcare often involves large, unexpected expenses…

…An individual may not have saved enough or be able to borrow enough…. In the face of such uncertainty–not even knowing who will need healthcare and when–pooling money into an insurance fund and then sharing the risk… is… natural…. But health insurance markets have… “adverse selection.” When people are pooled together in an insurance fund some will have very high expected medical costs…. For… [those more likely to remain] healthy, that… [can be] a bad deal–the premiums are more than their expected health spending…. Many… won’t purchase insurance (and the emergency room is available for serious problems, and if the bill is big enough someone else will end up paying). That leaves more people with high expected health costs in the insurance pool, leading to higher premiums and more dropouts, a process that continues until only the highest cost patients are left and the premiums are unaffordable.

One way to stop this spiral to market collapse is a mandate that keeps healthy people in the insurance pool. The mandate in… the Republican proposal… creates a [stronger] incentive to go without insurance…. It’s hard to see how this will work….

But the most problematic aspect of delivering healthcare in the private marketplace is that consumers do not have the information they need to make informed healthcare choices…. In this regard, Professor Arrow made an interesting comment in an interview in 2009….

The market won’t work—it doesn’t work well in the health context. But something else supplements the market, and the thing I put stress on in the paper are the elements that put a non-economic influence on the market: professional commitments to provide a service, to engage in services that aren’t self-serving. Standards of caring decided by non-economic actors. And one problem we have now is an erosion of professional standards. In a way, there is more emphasis on markets and self-aggrandizement in the context of healthcare, and that has led to some of the problems we have today.

Another way to overcome the information problem is to let an informed agent make decisions on your behalf…. HMO’s…. But HMOs make less money when consumers receive more care, and consumers do not trust HMO-type institutions….

Once the need for government involvement to overcome market failures is accepted, and to me, it seems impossible to deny, the question is how well a particular healthcare proposal addresses these problems…. The Republican plan does not even seem to recognize the full extent of the problems in healthcare markets, and when it does, the remedies are far from adequate. Anyone who is serious about a delivering broad-based, affordable healthcare insurance should give it two bigly thumbs down.


Edwin Park: CBO: 24 Million People Would Lose Coverage Under House Republican Health Plan: “The plan… would effectively end the ACA’s Medicaid expansion starting in 2020…

…repeal the ACA’s marketplace tax credits and subsidies, substituting a highly inadequate tax credit in 2020, and immediately end the ACA’s individual and employer mandates to buy and provide health coverage…. The plan would retain most of the ACA’s market reforms and consumer protections…. [The plan has] a deeply flawed, ineffective alternative to the individual mandate….

Federal Medicaid spending would be cut by $880 billion or 17.6 percent over the next ten years, relative to current law…. CBO’s estimate of a 24 million increase in the number of uninsured under the House bill is only 8 million lower than CBO’s 32 million estimate of the ACA repeal bill that President Obama vetoed in January 2016…. At the time, congressional Republican leaders dismissed the 32 million estimate because it didn’t account for their “replacement” coverage provisions, which they hadn’t yet agreed upon…. CBO estimates that this “replacement” bill would offset only 25 percent of the coverage loss expected under the earlier repeal bill…


Jacob Leibenluft: [CBO: Millions Would Pay More for Less Under House GOP Health Plan][]: “While dismissing CBO’s analysis, Republicans have pointed to one of its numbers…

…that average individual market premiums will fall by 10 percent by 2026…. They… misunderstood…. The premium decrease… is the average change in the sticker price of health insurance, without accounting for the House plan’s large reductions in tax credits…. Average premiums fall, [but] what many people actually pay will rise…. A 40-year-old with an income of $26,500… could buy a health plan in 2026 with a sticker price somewhat less than under current law, but would have to pay $700 more in premiums…. Despite promises by President Trump and others, deductibles and other cost-sharing would rise substantially—further increasing how much families pay out of pocket….

The drop in average premiums occurs partly because older adults are likelier to lose coverage because they can no longer afford it, removing them from the average. Average premiums would rise 20 to 25 percent for 64-year-olds, while dropping 20 to 25 percent for 21-year-olds…. Unsurprisingly, older people would be the most likely to find individual market coverage unaffordable. “A larger share of enrollees in the non-group market,” CBO concludes, “would be younger people and a smaller share would be older people.” That fact alone will reduce average premiums because older people have higher health costs and premiums than younger people…


Alvin Chang: The CBO’s nonpartisan report on the Republican ACA replacement plan, explained in 6 charts: “It’s an attack on the poor… a devastating report for the Republican plan, and it can be summed up in one chart:

NewImage

[Plus:]

NewImage NewImage NewImage NewImage NewImage

Must-Read: CBO: American Health Care Act

Must-Read: CBO: American Health Care Act: “CBO and JCT estimate that, in 2018, 14 million more people would be uninsured under the legislation than under current law…

…Later, following additional changes to subsidies for insurance purchased in the nongroup market and to the Medicaid program, the increase in the number of uninsured people relative to the number under current law would rise to 21 million in 2020 and then to 24 million in 2026… in large part from changes in Medicaid enrollment—because some states would discontinue their expansion of eligibility, some states that would have expanded eligibility in the future would choose not to do so, and per-enrollee spending in the program would be capped. In 2026, an estimated 52 million people would be uninsured, compared with 28 million who would lack insurance that year under current law….

In CBO and JCT’s assessment, however, the nongroup market would probably be stable in most areas under either current law or the legislation. Under current law, most subsidized enrollees purchasing health insurance coverage in the nongroup market are largely insulated from increases in premiums because their out-of-pocket payments for premiums are based on a percentage of their income; the government pays the difference…. Under the legislation… subsidies to purchase insurance, which would maintain sufficient demand for insurance by people with low health care expenditures, and grants to states from the Patient and State Stability Fund… would, in the agencies’ view, lower average premiums enough to attract a sufficient number of relatively healthy people to stabilize the market….

The ways in which federal agencies, states, insurers, employers, individuals, doctors, hospitals, and other affected parties would respond to the changes made by the legislation are all difficult to predict, so the estimates in this report are uncertain. But CBO and JCT have endeavored to develop estimates that are in the middle of the distribution of potential outcomes.

Must- and Should-Reads: March 13, 2017


Interesting Reads:

Must-Read: Kevin Drum: Trump OMB Director Claims Obama “Manipulated” the Unemployment Figures

Must-Read: Why are economists who work for Trump still received in polite society? John Taylor, Mike Boskin, Greg Mankiw, Glenn Hubbard, Ed Lazear, Ben Bernanke, Harvey Rosen, Marty Feldstein, Alan Greenspan, George Shultz: this mess is on your side of the fence–you clean it up. Please.

Kevin Drum: Trump OMB Director Claims Obama “Manipulated” the Unemployment Figures: “Along comes OMB Director Mick Mulvaney…

…to add yet another ugly accusation:

We thought for a long time, I did, that the Obama administration was manipulating the numbers in terms of the number of people in the workforce to make the unemployment rate, that percentage rate, look smaller than it actually was…. The BLS did not change the way they count, I don’t think, but you can have a long conversation when you’ve got a numerator and a denominator, how to arrive at a percentage…

Should-Read: Ben Thompson: Breaking Down the Father on BBC Being Interrupted by His Children

Should-Read: Ben Thompson: Breaking Down the Father on BBC Being Interrupted by His Children: “There seemed to be a special resonance to this clip of a father in South Korea…

…commenting on the removal of once-President Park Geun-hye, only to be interrupted on live TV by his kids breaking into his home office. If I might say so myself, I am uniquely qualified to break this video down: I’ve been on TV from a home office, I have children, and, crucially, I am a man (who like Robert E Kelly, our protagonist, lives in Asia)….

I tweeted today, “There but for the Grace of God Go I”. You know what though? Being Professor Kelly seems like a pretty good gig: a nice house, a nice look, an irrepressible daughter, a shockingly mobile baby, and a wife that will do anything to help him succeed.

Plus he gets to be on the BBC.

Should-Read: Aaron Carroll: The AHCA Doesn’t Make Sense

Should-Read: Two possibilities:

  1. Paul Ryan and company are simply not competent–somebody put a real, highly punitive continuous coverage requirement into the ObamaCare Repeal bill; somebody else said “that’s too punitive” and changed it; and nobody did the addition.

  2. Paul Ryan and company want this bill–if passed–to lead to an adverse selection meltdown of their (or, rather, Trump’s) health care exchanges.

Is there a third alternative?

Aaron Carroll: The AHCA Doesn’t Make Sense: “I’m having a really hard time with this…

…The Republicans hate the individual mandate. I get that…. They also, however, understand the need for some sort of carrot/stick to get healthy people to buy insurance so that we don’t get adverse selection and see the private insurance market enter a death spiral. So they need to replace it…. I’m not saying that you can’t replace the individual mandate.

Many… believe that too few healthy people are joining the exchanges…. To fix that, we could increase the size of the mandate penalty (stick), increase the size of the subsidies to make insurance cheaper (carrot), or both (carrot and stick). The AHCA plan, though… eliminates the stick… reduces the carrot… puts in a… 30% insurance markup if people lose continuous coverage…. That’s a tiny, tiny penalty in the scheme of things. Let’s say I’m single and I’m in my late 20’s, and insurance costs me $3000. With the promised $2000 subsidy, I’d have to pay $1000 more to get insurance. Or… I could just forego it this year, and if I need it next year, it will cost me $3900 (I will owe $1900). In just one year, I make money. If I skip a number of years, I can save even more. I’m not sure this is much of a stick….

Once I’m out of the market, I’m left alone. It’s not until I re-enter that I’m hit with the penalty. The longer I stay out, the longer I avoid the pain. It’s an inducement to remain uninsured. We know what needs to happen to reduce adverse selection. We need to make the carrots and/or sticks stronger. This seems to do the opposite. I don’t get it.