False promises about corporate taxes and American workers

A man walks past the former Bethlehem Steel in Bethlehem, Pa.

Republicans in Congress and in the Trump administration have turned to tax reform, touting it as crucial for investment, job creation, and economic growth that will benefit American workers. While most policymakers agree that tax reform is overdue, true reform seems far less likely than poorly designed corporate tax cuts, and economic research shows that the results from such tax cuts are likely to be deeply disappointing to American workers. The benefits from these corporate tax cuts would accrue to corporate shareholders and senior managers—the same groups that have prospered the most in recent decades, while wages for middle-class Americans have stagnated.

If policymakers actually want to help American middle-class workers with tax cuts, they should simply direct those tax cuts to the taxes these workers pay. Income and payroll taxes are by far the dominant source of workers’ federal tax payments. There is no question that workers pay nearly all payroll and labor income taxes, including the portion of the payroll tax ostensibly paid by employers since workers pay for the employer portion of the payroll tax in the form of lower wages.

How would corporate tax cuts affect the middle class? For corporate tax cuts to benefit workers, the resulting increase in corporate after-tax profits would need to fuel new investments, those new investments would need to increase the productivity of labor, and the higher productivity would need to boost wages. But why rely on indirect mechanisms to help workers when we have far more direct tools? If the aim is to help workers, then policymakers should go straight to the taxes that fall on them. Workers would get nearly 100 percent of payroll and labor income tax cuts.

Research shows that corporate tax cuts are far more likely to end up in the hands of those at the top of the income distribution. All major models from the Joint Committee on Taxation, the Congressional Budget Office, the U.S. Department of Treasury, and the nonpartisan Tax Policy Center put the vast majority of the corporate tax burden on capital or shareholders. And there is little to no empirical evidence that corporate tax cuts increase investment and wages across countries; research suggesting as much has rarely found a place in peer-reviewed publications, and early implausible results have been subsequently questioned or overturned.

Further, much of the U.S. corporate tax base at present is excess profits, which are profits above the normal level accruing due to intangible sources of economic value and market power. U.S. Treasury economists now calculate that three-quarters of the corporate tax base is excess profits, often in the hands of very few superstar companies. Giving a tax cut to this part of the tax base just makes excess profits even larger, without stimulating capital investment or wages.

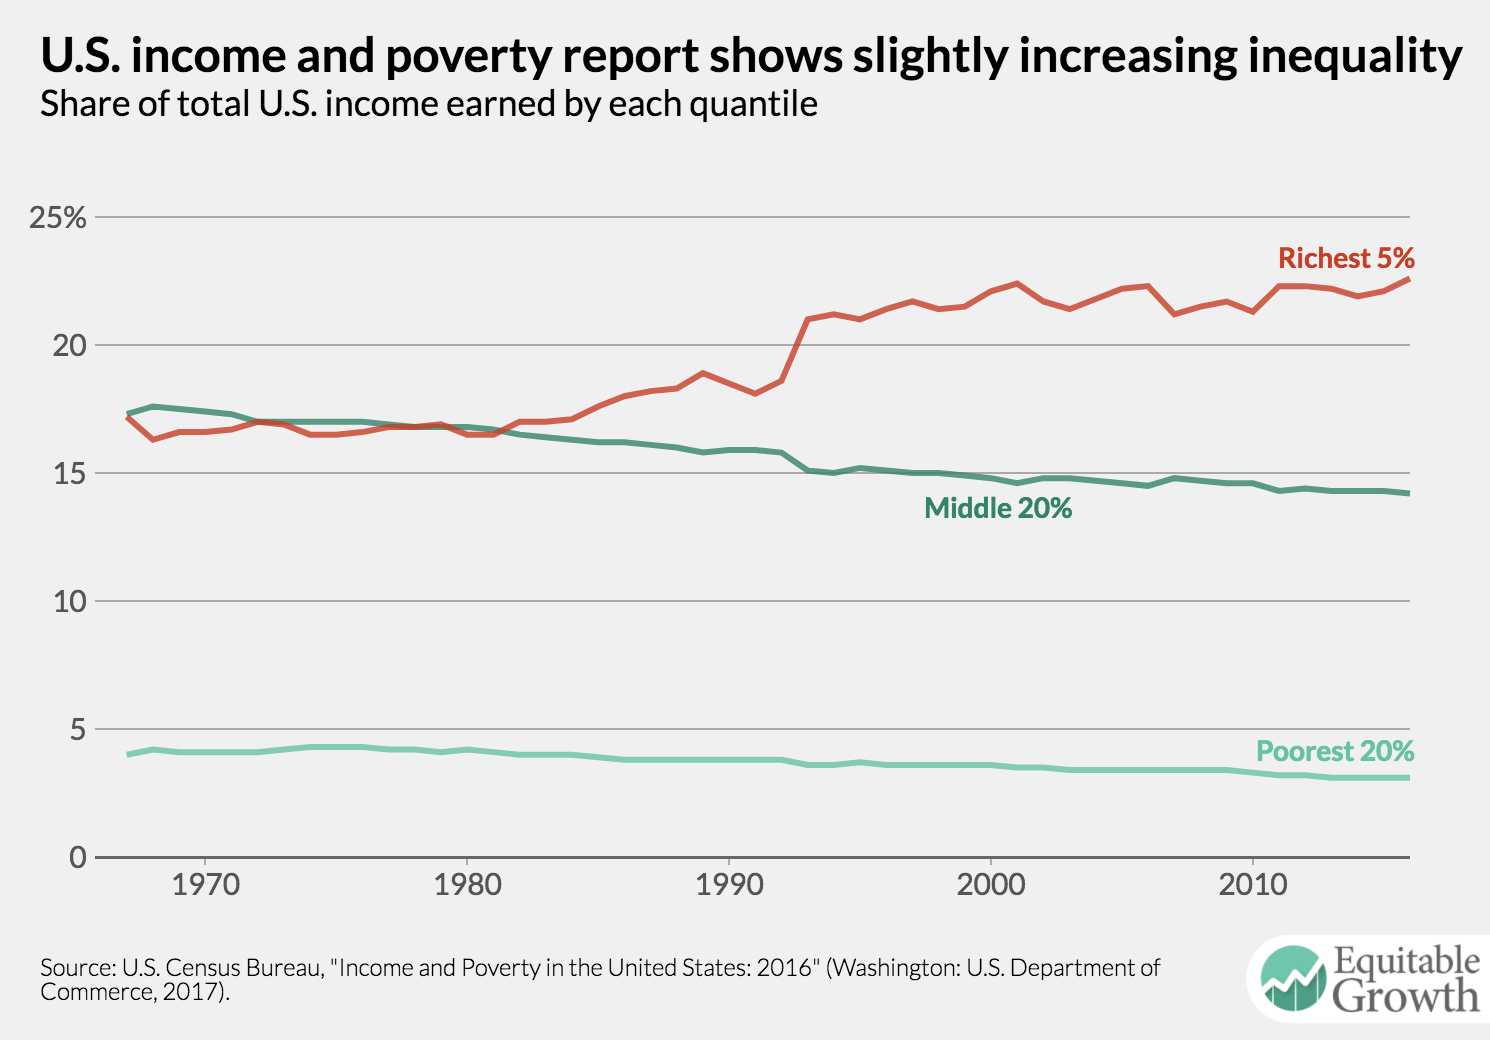
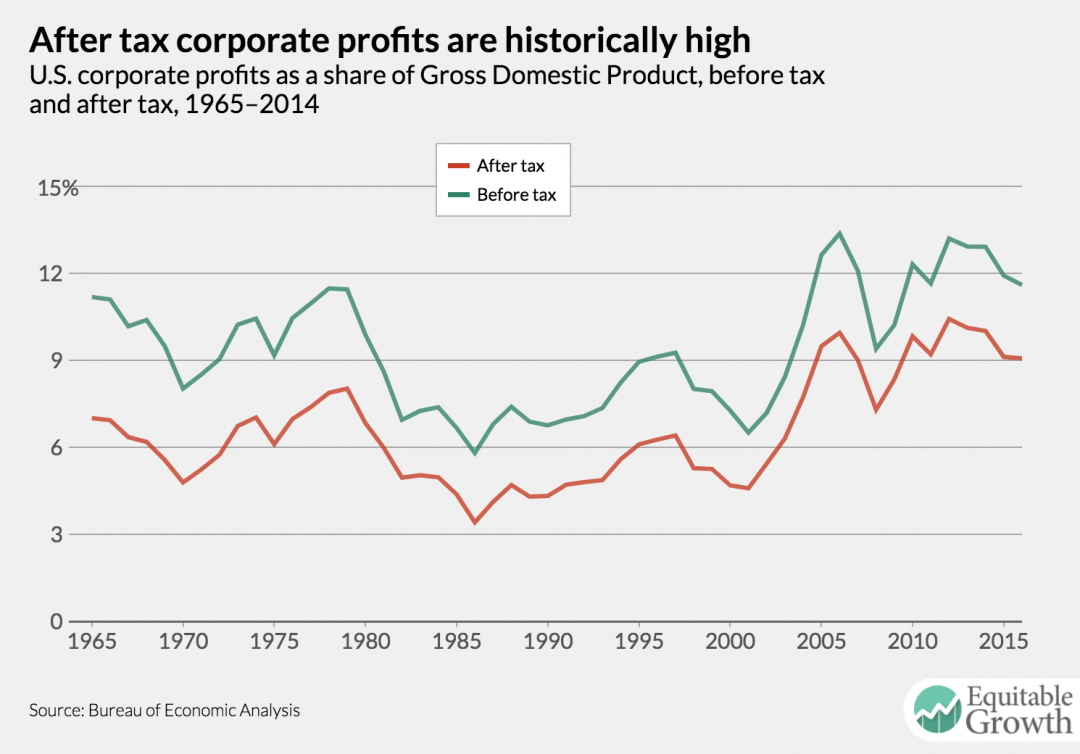
If burgeoning corporate after-tax profits were the key to investment and wage growth, then the previous 15 years should have been a paradise of wage growth, as after-tax profits in recent years have been about 50 percent higher than in decades prior (as a share of Gross Domestic Product), and higher than at any point in the past half-century. (See Figure 1.)

Figure 1

Are policymakers really to believe that low after-tax profits are the key economic problem that tax reform should address? Those arguing for corporate tax cuts typically cloak their arguments under the guise of competitiveness. But this is nonsense. Our multinational companies are the most competitive on the planet. The United States has a disproportionate share of the Forbes 2000 list of global companies, and after-tax profits are at record levels. Further, our multinational companies are so skillful at exploiting loopholes to lower their tax bills that they often achieve effective tax rates in the single digits. Business tax reform should not lower tax collections from the country’s corporations—collections that are already 1 percent of GDP lower than corporate tax collections in other countries.

To be clear, there is a pressing need for corporate tax reform. Such reform could lower headline rates somewhat if policymakers were serious about protecting the corporate tax. Evidence suggests that the U.S. government is probably losing more than $100 billion each year due to corporate profit shifting to tax havens, and a similar amount of revenue is being lost as business activity moves into pass-through form. This leaves a lot of room for true tax reform to simultaneously close loopholes and lower rates. But the rates that have been suggested—rates as low as 15 percent or 20 percent—would not deliver substantial economic benefits for the middle class and would instead result in huge revenue losses for the federal government and a much lighter tax burden for those at the top of the income distribution. Further, there is no indication that these proposals will be serious about corporate tax-base protection.

So far, tax cuts seem to be far more important to Republican policymakers and the Trump administration than tax reform, and the planned tax cuts are heavily skewed toward those at the top at the expense of future generations of taxpayers. To help middle-class workers, give them the tax cuts, and keep business tax reform—and tax reform as a whole—at least revenue neutral.

— Kimberly Clausing is the Thormund A. Miller and Walter Mintz Professor of Economics at Reed College.

Latest official estimates underreport extent of inequality in the U.S.

Photo by flickr user Daniel X. O’Neil

The release today of the U.S. Census Bureau’s annual report on income and poverty underscores why better official measures of economic inequality are sorely needed. Official measures released by the Census Bureau and based on the Current Population Survey underreport the level and trend of inequality. The federal government should follow the lead of academic economists who are taking a more rigorous approach to measuring income—an approach that has allowed them to detect rapid increases in the income of very high earners that the federal government’s statistics have missed.

To be sure, the Census Bureau’s annual report for 2016 is one of the most high-profile official products of the federal government that attempts to quantify economic inequality. These estimates are calculated using the Annual Social and Economic Supplement of the Census’ Current Population Survey. The CPS is one of the best sources of economic data available on the earnings of U.S. workers, but it has limitations and cannot be relied on to estimate incomes at the very top of the income distribution.

According to today’s data, the share of income earned by the poorest 20 percent of Americans declined from about 4 percent of the total in 1967 to 3.1 percent in 2016. The middle 20 percent clearly lost ground over the same period of time. And there was a relatively modest rise in the share of income taken by the richest 5 percent of the population: from 17.2 percent in 1967 to 22.6 percent in 2016 (see Figure 1).

Figure 1

But these estimates of inequality by the Census Bureau do not tell the full story. Another dataset compiled by the academic team of economists Thomas Piketty at the Paris School of Economics and Emmanuel Saez and Gabriel Zucman at the University of California, Berkeley finds that the share of income garnered by the top 5 percent was much higher to begin with, 25.7 percent in 1967, and climbed more sharply to 36.1 percent of all income by 2014. Their estimates are based on a dataset they created called Distributional National Accounts. (See Figure 2.)

Figure 2

The Distributional National Accounts data suggest a much more unequal United States and a far steeper rise in inequality over the past four decades. Unfortunately, these data are closer to the truth than the Census estimates because they incorporate higher-quality administrative data and include more sources of income. It is especially unfortunate because the Census Bureau’s report is one of the few official data sources for tracking inequality, but for methodological reasons—most of which are outside the agency’s control—this official indicator is missing important trends.

Official U.S. economic measurement must improve

Without accurate measurement, policymakers cannot determine whether the laws and regulations they enact result in more broad-based economic prosperity. The three economists who developed the Distributional National Accounts prototype measurement point the way forward. Although there are many differences between their estimates and official estimates from the Census Bureau, two factors explain most of the discrepancy. First, the academic team uses administrative data to supplement the CPS survey data. Second, the Distributional National Accounts measurement uses a more complete definition of income. Here’s why both factors are so important to improving the measurement of the U.S. economy.

Survey data versus administrative data

The Census Bureau’s inequality estimates are based on data from the Current Population Survey. The Annual Social and Economic Supplement to the survey, conducted every March, provides economic data that is widely used by researchers, policymakers, and pundits. The CPS is a high-quality survey that goes out to more than 75,000 households, but even with such a relatively large sample size, it is difficult to capture the incomes of the truly rich, as they represent a tiny slice of the population and may be less likely than others to respond to a survey. As a result, measures of income in the CPS become less reliable as you look at higher and higher income slices of the U.S. population.

The academic team behind Distributional National Accounts addresses this weakness in the CPS by incorporating administrative tax data from the U.S. Internal Revenue Service. This gives them access to actual income reported to the IRS for every filer in the country. They can therefore construct more accurate estimates of income for top earners, all the way into the top 0.001 percent. This turns out to be extremely important because the fortunes of the merely rich and the truly rich have diverged considerably.

How much has the share of national income changed for the top 10 percent, the top 1 percent, and the top 0.1 percent of earners between 1967 and the end of 2016? The top 10 percent experienced an increase of a mere 15 percent in their share of total economic income, while the top 1 percent gained 37 percent and the richest 0.1 percent of earners more than doubled their share of total income, from 4.4 percent to 9.3 percent—a staggering 114 percent increase. (See Figure 3.)

Figure 3

The Census Bureau, relying on considerably less comprehensive data from the CPS, is only able to document the top 5 percent of income earners, and we know from the tax data that the CPS considerably underestimates income in that segment. Without incorporating administrative data, a full accounting of inequality in the United States is impossible. Importantly, this is not the Census Bureau’s fault. They do not have access to the full tax data that Piketty, Saez, and Zucman do, though they do have access to a more limited extract with less income detail. Nor is the IRS arbitrarily withholding data: U.S. law puts strict limits on how tax return data can be shared. If the federal government is ever to produce strong inequality statistics, these limits may have to be revisited in ways that preserve confidentiality while allowing improved measures of economic outcomes.

Measures of income

A second way in which the Census Bureau estimates miss the mark is in their chosen definition of income. The agency tracks money income, a measure that includes most sources of raw income that an earner might accrue before taxes are levied. It doesn’t include nonmonetary compensation such as the value of employer-provided health care. Finally, the agency takes a mixed approach to government transfers. Some are included as income such as Social Security income, while noncash benefits are excluded such as supplemental nutrition assistance.

Once again, the approach taken by Piketty, Saez, and Zucman is instructive. There are two significant distinctions in how Distributional National Accounts measure income. First, they peg their estimates to the National Income and Product Accounts. These accounts, produced by the U.S. Bureau of Economic Analysis, track the total economic output of goods and services in the United States to produce Gross Domestic Product. Add the income of every individual in the Distributional National Accounts dataset together, and it matches income concepts in the National Income and Product Accounts.

This matching requires the academic team to make some decisions that may seem odd at first glance. The three economists take all government spending on public education, for example, and allot it to individuals in the dataset. The average person may not think about this money as being part of their income, but it is a government benefit that subsidizes the income of those with children; for those without children, it helps to create a more educated and hopefully better society. Pegging the dataset to the National Income and Product Accounts ensures that all income is accounted for and gives a more complete picture of how government policy impacts inequality.

Second, Piketty, Saez, and Zucman provide measures for income before and after government taxes and transfers. Measuring inequality before and after government taxes and investments in social welfare programs is an important part of understanding how policy affects inequality. Among the wealthiest economies in the world, the United States is not very notable for its pre-tax and transfer level of inequality. France and Germany, for example, have similar levels of inequality, but the United States does much less redistribution with its tax code and social welfare programs. The upshot: The French and German economies are much less unequal after government programs are accounted for than the U.S. economy.

How do government taxes and transfers affect the share of income held by, say, the top 5 percent in the United States? The gap between pre-tax and post-taxes and transfers income has been widening since the early 1990s, and currently this gap accounts for about a 7 percentage point difference for this income group. (See Figure 4.)

Figure 4

This before-and-after information is absolutely necessary if policymakers are to understand how their policies affect economic inequality. If there is only one measure of inequality, it may be difficult to deduce whether fluctuations are caused by policy or some exogenous factor.

Today’s data release by the U.S. Census Bureau is an important product because it represents one of the nation’s few official measures of inequality. But it is insufficient if we are to truly understand how inequality has changed and how it affects today’s economy. Legislators and employees of statistical agencies alike should pursue ways of improving our data infrastructure for tracking inequality.

JOLTS Day Graphs: July 2017 Report Edition

Every month the U.S. Bureau of Labor Statistics releases data on hiring, firing, and other labor market flows from the Job Openings and Labor Turnover Survey, better known as JOLTS. Today, the BLS released the latest data for July 2017. This report doesn’t get as much attention as the monthly Employment Situation Report, but it contains useful information about the state of the U.S. labor market. Below are a few key graphs using data from the report.

The quits rate moved up slightly to 2.2 percent in July. But it remains locked in the same range it’s been in since the beginning of the year.

The ratio of unemployed workers to job openings declined in July and is now at its second-lowest recorded level: 1.13 workers per vacancy.

The number of hires per job opening—known as the vacancy yield—has settled at around 0.9 after falling throughout this recovery.

The Beveridge Curve in July looks to be very close to its pre-recession trend.

Should-Read: Barbara Biasi and Petra Moser: Effects of Copyrights on Science: Evidence from the WWII Book Republication Program

Should-Read: Barbara Biasi and Petra Moser: Effects of Copyrights on Science: Evidence from the WWII Book Republication Program: “In 1942, the American Book Republication Program (BRP) allowed US publishers to reprint exact copies of German-owned science books… https://papers.ssrn.com/sol3/Papers.cfm?abstract_id=2542879

…leading to a 25-percent decline in the price of BRP books. We use two alternative identification strategies to study the effects of this change on downstream science, and find that the reduction in access costs led to a substantial increase in the number of new scientific articles and books that used BRP books. A comparison across fields suggests that access costs matter most for disciplines, in which knowledge production is less intensive in physical capital, such as mathematics. To investigate the mechanism by which copyrights have affected science, we collect data on library holdings. These data indicate that lower access costs allowed a new set of poorer libraries to buy BRP books and make them available in their locations. Two alternative measures of scientific output – changes in the number of new PhDs in mathematics and changes in the number of US patents that use BRP books – confirm the main results…

Posted in Uncategorized

Should-Read: Peter A. Hall and David Soskice, eds. Varieties of Capitalism: The Institutional Foundations of Comparative Advantage

Should-Read: Peter A. Hall and David Soskice, eds. Varieties of Capitalism: The Institutional Foundations of Comparative Advantage: “The institutional differences that characterize the ‘varieties of capitalism’ found among the developed economies… http://www.oxfordscholarship.com/view/10.1093/0199247757.001.0001/acprof-9780199247752

…‘Liberal market economies’ and ‘coordinated market economies’… variations on economic performance and many spheres of policy‐making, including macroeconomic policy, social policy, vocational training, legal decision‐making, and international economic negotiations… institutional complementarities across… labour markets, markets for corporate finance, the system of skill formation, and inter‐firm collaboration on research and development that reinforce national equilibria and give rise to comparative institutional advantages, notably in the sphere of innovation where LMEs are better placed to sponsor radical innovation and CMEs to sponsor incremental innovation….

A firm‐centred comparative political economy that can be used to assess the response of firms and governments to the pressures associated with globalization… the role of business interests and of economic systems built on general or specific skills in the development of social policy….

Relationship between national legal systems, as well as systems of standards setting, and the political economy…

Posted in Uncategorized

Must-See: Bin Yu: Three principles for data science: predictability, stability, and computability

Must-See: Why “three principles”? Why not “five principles”?

Bin Yu: Three principles for data science: predictability, stability, and computability: “September 12, 2017 :: 4:10pm to 5:00pm :: 190 Doe Library” https://bids.berkeley.edu/events/three-principles-data-science-predictability-stability-and-computability

Bin Yu: Three principles for data science: predictability, stability, and computability: “Prediction is a useful way to check with reality… http://delivery.acm.org/10.1145/3110000/3105808/p5-yu.pdf?

…Good prediction implicitly assumes stability between past and future. Stability (relative to data and model perturbations) is also a minimum requirement for interpretability and reproducibility of data driven results (cf. Yu, 2013). It is closely related to uncertainty assessment. Obviously, both prediction and stability principles cannot be employed without feasible computational algorithms, hence the importance of computability

https://www.youtube.com/watch?v=xqBW8QKs9q4

Should-Read: Michael Boskin (March 6, 2009): Obama’s Radicalism Is Killing the Dow

Should-Read: This was remarkably off-base at the time. It reads even worse now. I don’t know which is worse: the endorsement of do-nothing climate policies, the refusal to face the fact that high-income tax cuts have not generated faster growth, or the “nation of takers” bs with respect to “paying no taxes”…

Why do Republican economists burn their reputations this way?

Michael Boskin (March 6, 2009): Obama’s Radicalism Is Killing the Dow: “our new president’s policies are designed to radically re-engineer the market-based U.S. economy… https://www.wsj.com/articles/SB123629969453946717

…Instead of combining the best policies of past Democratic presidents—John Kennedy on taxes, Bill Clinton on welfare reform and a balanced budget, for instance—President Obama is returning to Jimmy Carter’s higher taxes and Mr. Clinton’s draconian defense drawdown. Mr. Obama’s $3.6 trillion budget blueprint… more than doubles the national debt… reduces defense spending to a level not sustained since the dangerous days before World War II… and it would raise taxes to historically high levels….

Increasing the top tax rates on earnings to 39.6% and on capital gains and dividends to 20% will reduce incentives for our most productive citizens and small businesses to work, save and invest—with effective rates higher still because of restrictions on itemized deductions and raising the Social Security cap…. The president claims he is only hitting 2% of the population, but many more will at some point be in these brackets. As for energy policy, the president’s cap-and-trade plan for CO2 would ensnare a vast network of covered sources, opening up countless opportunities for political manipulation, bureaucracy, or worse….

The president’s proposed limitations on the value of itemized deductions for those in the top tax brackets would clobber itemized charitable contributions… exacerbate tax flight from states like California and New York…. New and expanded refundable tax credits would raise the fraction of taxpayers paying no income taxes to almost 50% from 38%. This is potentially the most pernicious feature of the president’s budget, because it would cement a permanent voting majority with no stake in controlling the cost of general government….

The European social welfare states present a window on our potential future: standards of living permanently 30% lower than ours. Rounding off perceived rough edges of our economic system may well be called for, but a major, perhaps irreversible, step toward a European-style social welfare state with its concomitant long-run economic stagnation is not.

Should-Read: Diane Coyle: Inequality, revisited

Should-Read: Piketty’s elasticity of substitution between capital and labor is, in his model, produced by the constancy of the rate of profit near 5%/year in spite of wide swings in the capital-output ratio. You can’t say that substitution parameter is wrong without providing an alternative explanation for the constancy of the rate of profit. Yet very few of Piketty’s critics even attempt that:

Diane Coyle: Inequality, revisited: “Recently I’ve been dipping into The Contradictions of Capital in the 21st Century: The Piketty Opportunity, edited by Pat Hudson and Keith Tribe… http://www.enlightenmenteconomics.com/blog/index.php/2017/09/inequality-revisited/

…There is a reasonable consensus among the contributors to these various collections that Piketty’s theorising is flawed (in particular depending on an empirically invalid assumption about the substitution between capital and labour), that his application of a theory about productive capital to the data including housing wealth and financial capital is troubling, and that his call for a global wealth tax is (as Avner Offer puts it in his essay in this book) ‘utopian’. Equally, pretty much all would agree that Piketty, with co-authors, has done a terrific service in putting together the database, and in getting inequality on the agenda of both economists and policymakers.

Pat Hudson[‘s]… challenge to Capital in the 21st Century is its omission of globalisation and technology as drivers of inequality–if one is thinking about policies to mitigate inequality, r>g isn’t much help. She pinpoints financial markets, and regulatory and political beliefs, as key points of intervention–in other words, the specifics Piketty ignores in his generalisations. Avner Offer focuses on housing, and limiting its tendency to make wealth more unequal through credit controls. The main sections of the book aim to particularise the analysis of inequality by looking at the trends, institutions and politics of different countries – one section on western economies, one on major economies elsewhere. As Luis Bértola points out here, Piketty is very Eurocentric. Having these different national perspectives is a useful contribution…

Previewing tomorrow’s annual income and poverty report

Dollar bills in New York.

The U.S. Census Bureau will release its annual report, “Income and Poverty in the United States,” on Tuesday this week. The report summarizes results from the March edition of the Current Population Survey and presents a wealth of information on the income of individuals and families in the United States. This report is also of interest because it contains an official estimate of inequality in the United States by the Census Bureau, one of the few official estimates that the federal government publishes. Unfortunately, the Census Bureau estimate suffers from several flaws and highlights the urgent need for a better official measurement of inequality.

Figure 1 shows the historical trend line of the Census Bureau’s estimate of the percent of total income held by the top 5 percent of the population. The trend jumped in the early 1990s but has been relatively steady since then and currently shows the top 5 percent earning about 22 percent of all income. But this is a severe underestimate. Figure 1 also shows the estimates made in the Distributional National Accounts dataset constructed by the economists Thomas Piketty, Emmanuel Saez, and Gabriel Zucman. Their work, which incorporates far more accurate tax data and makes several other improvements on the Census estimate, shows that the income share of the top 5 percent has risen steadily and is now about 36 percent of all income.

Figure 1

It’s not only that official estimates get the overall level of inequality wrong. The trend of the Census estimates is also misleading, showing little change over the past two decades. As policymakers start to consider ways to reduce inequality in the United States, accurate measurement of the phenomenon is more important than ever. We can’t evaluate the efficacy of anti-inequality policy if our official measurements of inequality don’t reflect the correct level or trend.

The Distributional National Accounts estimates were constructed entirely from datasets that are produced by the U.S. government, so creating better measures is possible. Poor intra-agency data sharing is largely responsible for the current state of affairs. U.S. code prevents most agencies from handling tax data, so agencies that have an interest in tracking the distribution of wealth are unable to do so. Congress should consider revising these restrictions. The Commission on Evidence-Based Policymaking, a bipartisan effort by Congress, suggested exactly this in their final report. Now Congress must act.

Must-Read: Pedro Nicolaci da Costa: Fed may pause rate hikes if inflation weakness persists

Must-Read: Every year since 2007 the Fed has been too optimistic and forecast that its interest rates will be higher than has turned out to be the case. Every single year. 2-11 = 1/2048:

Pedro Nicolaci da Costa: Fed may pause rate hikes if inflation weakness persists: “The Federal Reserve is embarking on an annual summer ritual: Downgrading its overly optimistic forecasts for economic growth… http://www.businessinsider.com/fed-may-pause-rate-hikes-if-inflation-weakness-persists-2017-7

…Janet Yellen’s testimony to Congress this week… acknowledging that a recent decline in inflation further below the central bank’s 2% target may not, in fact, be as fleeting as policymakers had hoped…. The latest figures are clearly heading in the wrong direction. Consumer prices held flat in June despite expectations for a 0.1% increase and the annual rate, which the Fed watches closely, registered just 1.6%. The Fed’s preferred measure of inflation, the personal consumption expenditures index, has also been slipping…. Not one but two regional Fed banks have just downgraded their growth estimates….

The Fed has frequently been overly optimistic about its predictions for rate hikes in the post-recession era. This rather stunning chart from Deutsche Bank’s Torsten Slok is rather instructive:

Fed may pause rate hikes if inflation weakness persists Business Insider