The disoriented series of economic events over the past decade may seem unprecedented, but there are very few new things under the macroeconomic sun. Not even the upcoming unwinding of the Federal Reserve’s bond buying spree that it went on to help fight the Great Recession is something brand new.
The Federal Open Markets Committee—the policymaking arm of the Federal Reserve System—is expected to announce its plans to wind down its balance sheet, built up during its large-scale asset purchasing programs beginning in 2009 during the depths of the Great Recession. By shedding the assets it bought via its “quantitative easing” programs, the U.S. central bank will be reducing the amount of excess reserves—those over and above the required amount—that it requires banks to hold with it. But this is not the first time that excess reserves were drawn down. Just as this unwinding will soon occur less than a decade after the end of the Great Recession, the previous one happened in the shadow of the Great Depression.
A new paper looks at the rise and fall of excess reserves in the aftermath of the 20th century’s largest recession. Recently released as a National Bureau of Economic Research working paper, the research is by economists Matthew Jaremski of Colgate University and Gabriel Mathy of American University. Interestingly, the excess reserves in the 1930s were not directly created by the Federal Reserve system, as they were during the response to the Great Recession. Instead, the two economists find that the excess reserves were primarily created by increased flows of gold into the United States. Neither the Federal Reserve nor the U.S. Treasury Department intervened in foreign exchange markets to “sterilize” the effects of the gold flows, which means those reserves were implicitly created by government policy.
Jaremski and Mathy note that the financial system at that time was set up so that increases in gold inflow would necessarily lead to increases in bank reserves, as private gold could no longer be used as money, but it wasn’t necessarily clear how much these flows increased excess reserves. What Jaremski and Mathy find is that there was a very strong flow of gold into to excess reserves. A 10 percent increase in gold flow was associated with an 8.8 percent increase in excess reserves. In other words, unsterilized gold flowing into the United States was an effective, and a kind of proto-quantitative, easing program.
The unwinding of that program was similarly a passive affair when it came to government programs. Jaremski and Mathy find that the excess reserves were wound down mostly via flows of gold out of the country and the increases in income generated from the economic recovery after the 1937–1938 recession. The result was a gradual reduction in the size of the Federal Reserve’s balance sheet.
Today, as the two economists note, the Federal Open Markets Committee’s plan to unwind excess reserves is expected to be gradual. The committee has signaled that the Fed’s balance sheet will be passively reduced as current assets are held to maturity, not actively sold off. But the unwinding this time may be more difficult to achieve, as excess reserves were roughly 15 percent of U.S. Gross Domestic Product in 2014 but only about 4 percent of GDP in 1935. What’s more, even though the Fed has signaled the unwinding will be gradual, that very process might spook asset markets. At the same time, the eventual size of the Fed’s balance sheet is unknown. These are just two questions about how the unwinding of the Fed’s balance sheet will go.
The announcement from the Federal Open Markets Committee about its balance-sheet policies (assuming it does arrive tomorrow afternoon) will start shedding light on the answers to these questions. But hopefully the committee will keep in mind another important lesson from the recovery from the Great Depression—that of 1937—as they move forward.
…Low interest rates did not cause the housing bubble of the early 2000s and higher interest rates would have been ineffective at preventing it. To deflate an asset bubble interest rates would have to be raised to levels that would cause enormous damage to the labor market. Fortunately, the Federal Reserve has numerous tools besides rate increases that would be more effective and inflict less collateral damage on the nonfinancial side of the economy…
…It’s more interpretively charitable than other popular theories about Trump’s supporters—e.g., that they are authoritarians or xenophobes—which portray them as victims of irrational fears and aversions…. Economic theories of Trump’s election were resisted on the grounds that Trump voters in the primaries were not predominantly members of the working class: their median income was considerably higher than that of most Americans, and was comparable to the income of Republicans in general…. However, economic explanations don’t necessarily require that Trump’s supporters were themselves in dire economic straits. They may simply have heard about economic problems that seemed to require “change.”…
What type of change did Trump voters want? Economic change seems to have been important, although other types of change were even more important. Among voters who rated the condition of the economy as “poor,” Trump prevailed, 79 percent to 15 percent. But he lost, 42 to 52, among those who rated the economy as the most important issue. In contrast, among voters who viewed immigration as the most important issue, Trump won, 64 to 32. And among those most concerned about terrorism, he won, 67 to 39….
Sociotropic voting originally meant economic voting that’s guided by perceptions of the state of the economy as a whole, not by voters’ own financial situation. As opposed to “pocketbook voters”…. When you read interviews with actual voters… you’ll find the interviewees thinking hard about whether given policies, parties, and politicians serve the common good. Rarely will you find them contemplating how policies, parties, or politicians might serve the voters’ own interests. To be sure, the common good, in many voters’ estimation, usually includes the interests of “people like me.” But rarely do they seem to think of politics in terms of “me” alone….
If the sociotropic effects of public policies aren’t self-evident, then where do people’s perceptions of them originate? An obvious answer is that they originate with an array of specialists, ranging from academic experts to policy wonks to pundits, who spend their waking lives thinking about social and economic problems, politics, and government. These thoughts are relayed—primarily through the mass media…. That’s just an elaborate hypothesis, and unfortunately there is little research to back it up (or refute it). The possibility that ideas guide politics eludes most political scientists because they haven’t recognized the implications of sociotropic voting….
We’re swimming in mediated messages about politics, so it stands to reason that these messages might influence our opinions; introspection suggests that they do…. Given the conservatism of Trump voters and their age—Fox News viewers skew older—the Martin and Yurukoglu study suggests that exposure to Fox News Channel may be a crucial reason for Trump’s victory…. To suggest that Trump voters were, to a significant extent, acting in accordance with what they learned about American society from Fox, and perhaps from talk radio, is to view them as rational human beings confronted with a complex world and doing what they can do deal with it well. We are all in the same situation. But why would anyone deal with this situation by choosing to watch Fox?… Stay tuned…
This is a weekly post we publish on Fridays with links to articles that touch on economic inequality and growth. The first section is a round-up of what Equitable Growth published this week and the second is the work we’re highlighting from elsewhere. We won’t be the first to share these articles, but we hope by taking a look back at the whole week, we can put them in context.
Equitable Growth round-up
Tax reform is unlikely to benefit workers, argues Kimberly Clausing. Cutting corporate tax rates is an indirect mechanism with no guarantee it will translate into higher wages for workers, versus cuts to payroll and labor income tax cuts.
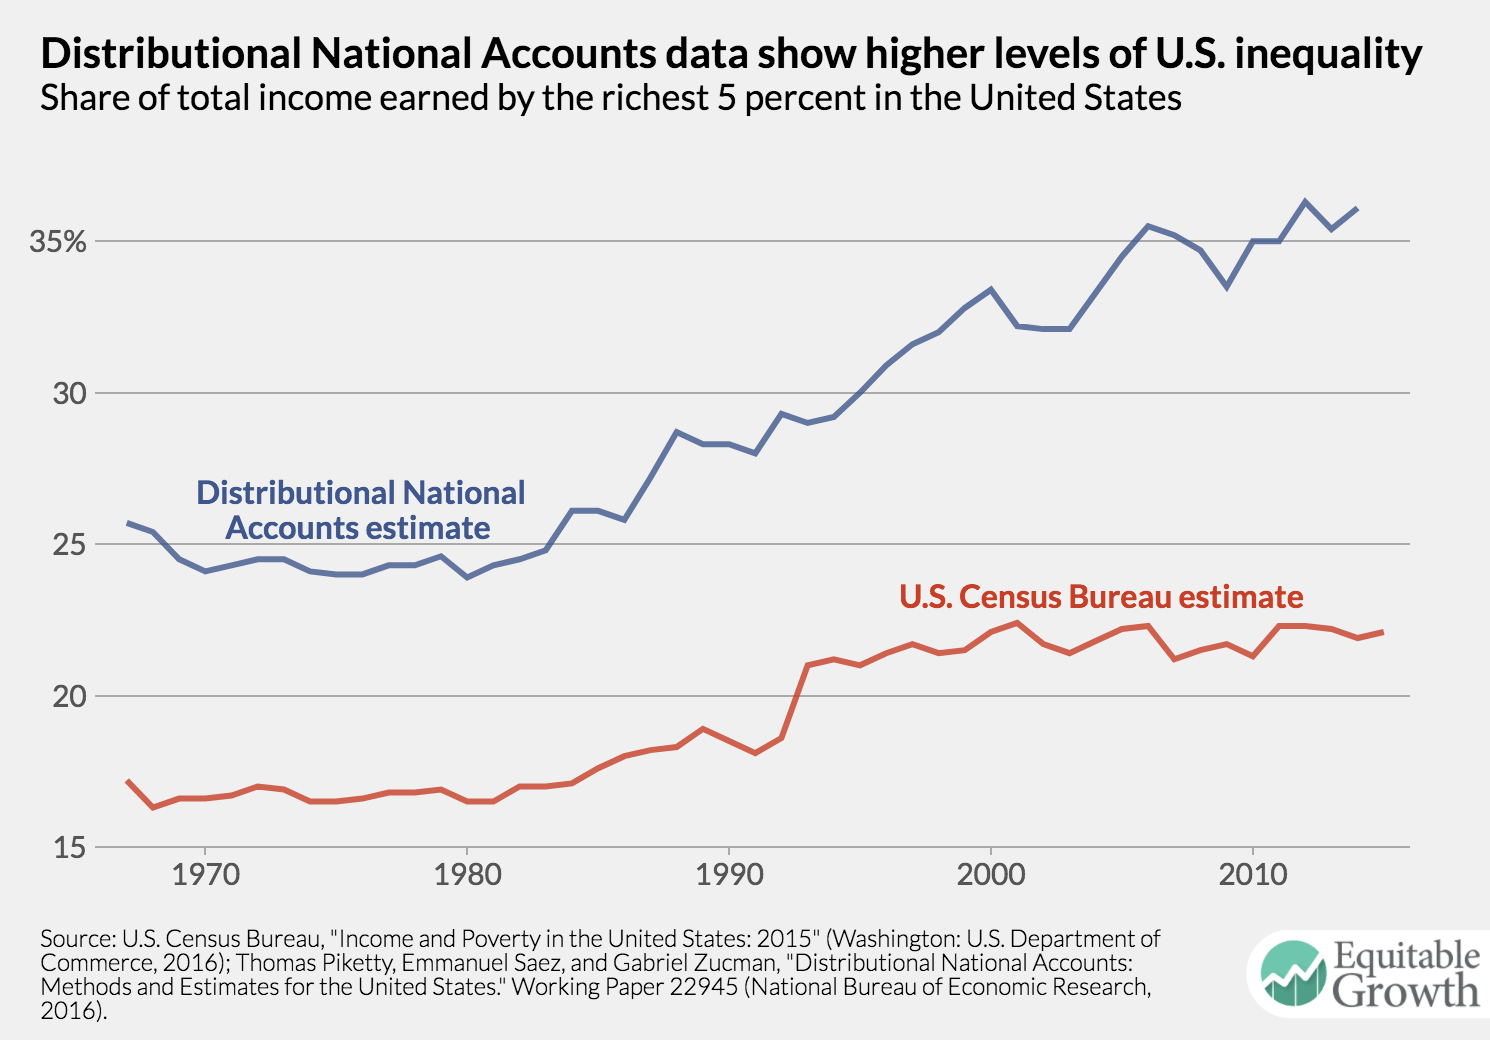
The release this week of the U.S. Census Bureau’s annual report on income and poverty underscores why better official measures of economic inequality are sorely needed, write Heather Boushey and Austin Clemens. The incorporation of higher-quality data and inclusion of more sources of income into the official measurement of inequality would allow for a better understanding of how income and wealth inequality are growing and changing.
Nick Bunker discusses a new working paper that examines the rise in price markups by companies in the United States as an indicator of increasing market power and the macroeconomic implications of that rise, including the decrease in wages for less-educated workers, falling labor force participation, and a decline in aggregate output.
The U.S. Bureau of Labor Statistics released new data on hiring, firing, and other labor market flows from the Job Openings and Labor Turnover Survey, better known as JOLTS. Check out the key graphs from the report chosen by Equitable Growth staff.
In a new brief, Greg Leiserson shows how the tax rate on business-level capital income is much lower than the 35 percent statutory rate. In fact, the average effective marginal tax rate is only 8 percent under current law.
Links from around the web
What do people mean when they say we need to revive antitrust? Matt Yglesias rounds up the most common policy ideas and areas of consensus/debate on this hot topic. [vox]
Why do workers pay twice as much in taxes as wealthy investors? Ben Steverman breaks down how income from wages versus investments is taxed, how we got here, and what tax reform might mean for these rates. [Bloomberg]
Were we closer than we ever realized to having a universal basic income in the United States? Ezra Klein and Dylan Matthews reveal that Hillary Clinton’s presidential campaign seriously considered adopting the policy in its platform—but couldn’t make the numbers work. [vox]
There’s a record-high level of job openings according to the latest numbers from the U.S. Department of Labor. But that doesn’t necessarily mean the labor market is tighter, explains Eric Morath. A number of factors, including the ease of posting jobs on the internet and a skills mismatch, could explain openings continuing to outpace hiring. [wsj]
New analysis of the Panama Papers by researchers Annette Alstadsaeter, Niels Johannesen, and Gabriel Zucman finds that global wealth inequality is even worse than it appears in standard, publicly available economic data due to the use of offshore tax havens. [business insider]
Oh. And clock speed. The AN/FSQ-7 operated at 75khz. The A-11 is a 6-core 24 mhz processor:
2000 100 billion square meter buildings, each a hundred-stories—300 meters high—and 3 kilometers long and wide
3000 times today’s global annual product
300 petawatts of power—60,000 time sthe world’s currnet generating capacity
for the late-1950s vacuum tubes to match one iPhoneX…
And we haven’t even gotten started on the hardware architecture, or on the software and maintenance support necessary to emulate an iPhoneX at speed back in the late 1950s…
Should-Read: David Card and A. Abigail Payne: High School Choices and the Gender Gap in STEM: “Women who graduate from university are less likely than men to specialize in science, technology, engineering, or math (STEM)… http://www.nber.org/papers/w23769.pdf
…High school students in Ontario, Canada… the province’s university admission system… the dynamic process leading to this gap…. Most of the gender gap in STEM entry can be traced to differences in the rate of STEM readiness; less than a fifth is due to differences in the choice of major conditional on readiness….
Decompose the gap in STEM readiness… into… the gender gap in the fraction of high school students with the necessary prerequisites… [and] differences in the fractions of females and males who enter university. The gender gap in the fraction of students with STEM prerequisites is small. The main factor is the lower university entry rate by men–a difference that is due to the lower fraction of non-science oriented males who complete enough advanced level courses to qualify for university entry….
Differences in course-taking patterns and preferences for STEM conditional on readiness contribute to male-female differences in the rate of entering STEM, but that the main source of the gap is the lower overall rate of university attendance by men…
Should-Read: Nancy MacLean: DEMOCRACY IN CHAINS: THE DEEP HISTORY OF THE RADICAL RIGHT’S STEALTH PLAN FOR AMERICAhttp://amzn.to/2voi3qD: “As 1956 drew to a close, Colgate Whitehead Darden Jr., the president of the University of Virginia, feared…
…second Brown v. Board of Education ruling, calling for the dismantling of segregation in public schools with “all deliberate speed.” In Virginia, outraged state officials responded with legislation to force the closure of any school that planned to comply…. Darden… could barely stand to contemplate the damage…. Even the name of this plan, “massive resistance,” made his gentlemanly Virginia sound like Mississippi. On his desk was a proposal, written by the… chair of the economics department… James McGill Buchanan [who] liked to call himself a Tennessee country boy. But Darden knew better….
Without mentioning the crisis at hand, Buchanan’s proposal put in writing what Darden was thinking: Virginia needed to find a better way to deal with the incursion on states’ rights represented by Brown. To most Americans living in the North, Brown was a ruling to end segregated schools—nothing more, nothing less. And Virginia’s response was about race. But to men like Darden and Buchanan, two well-educated sons of the South who were deeply committed to its model of political economy, Brown boded a sea change on much more…. Federal courts could no longer be counted on to defer reflexively to states’ rights…. The high court would be more willing to intervene when presented with compelling evidence that a state action was in violation of the Fourteenth Amendment’s guarantee of “equal protection”…. States’ rights… were yielding in preeminence to individual rights. It was not difficult for either Darden or Buchanan to imagine how [the Warren] court might now rule if presented with evidence of the state of Virginia’s archaic labor relations, its measures to suppress voting, or its efforts to buttress the power of reactionary rural whites by underrepresenting the moderate voters of the cities and suburbs of Northern Virginia. Federal meddling could rise to levels once unimaginable.
James McGill Buchanan was not a member of the Virginia elite. Nor is there any explicit evidence to suggest that for a white southerner of his day, he was uniquely racist or insensitive to the concept of equal treatment. And yet, somehow, all he saw in the Brown decision was coercion. And not just in the abstract. What the court ruling represented to him was personal. Northern liberals… who looked down upon southern whites like him,… were now going to tell his people how to run their society. And… he and people like him with property were no doubt going to be taxed more…. What about his rights? Where did the federal government get the authority to engineer society to its liking and then send him and those like him the bill? Who represented their interests in all of this?
I can fight this, he concluded. I want to fight this. Find the resources, he proposed to Darden, for me to create a new center on the campus of the University of Virginia, and I will use this center to create a new school of political economy and social philosophy… an academic center… with a… political agenda: to defeat the “perverted form” of liberalism that sought to destroy their way of life, “a social order,” as he described it, “built on individual liberty,” a term with its own coded meaning but one that Darden surely understood. The center, Buchanan promised, would train “a line of new thinkers” in how to argue against those seeking to impose an “increasing role of government in economic and social life.” He could win this war, and he would do it with ideas.
While it is hard for most of us today to imagine how Buchanan or Darden or any other reasonable, rational human being saw the racially segregated Virginia of the 1950s as a society built on “the rights of the individual,” no matter how that term was defined, it is not hard to see why the Brown decision created a sense of grave risk among those who did. Buchanan fully understood the scale of the challenge he was undertaking and promised no immediate results. But he made clear that he would devote himself passionately to this cause.
Some may argue that while Darden fulfilled his part—he found the money to establish this center—he never got much in return. Buchanan’s team had no discernible success in decreasing the federal government’s pressure on the South all the way through the 1960s and ’70s. But take a longer view… a different picture… a testament to Buchanan’s intellectual powers and… the ideological origins of the single most powerful and least understood threat to democracy today: the attempt by the billionaire-backed radical right to undo democratic governance…. A quest that began as a quiet attempt to prevent the state of Virginia from having to meet national democratic standards of fair treatment and equal protection… would, some sixty years later, become… a stealth bid to reverse-engineer all of America, at both the state and the national levels, back to the political economy and oligarchic governance of midcentury Virginia, minus the segregation…
…has become the academic version of Pokemon Go this week. I now offer one small contribution of my own…. Hardly enemies of democracy in the paper, Nutter and Buchanan see their task (as Buchanan did for his whole career) as offering analyses that could inform the deliberations of the democratic process…. MacLean sees this paper as an attempt by the two scholars to undermine public education in Virginia in order to keep the effects of pre-Brown segregation while still complying with the law….
They also never mention race in the paper, as she acknowledges, but their use of the technical language of economics and their race-neutrality is seen by her as evidence of their attempt to generate racist outcomes by stealth…. One might also note that supporting Brown also means that one is thwarting the desires of democratic majorities…. It’s fascinating that she sees the foundation of the arguments of democracy’s supposed opponents as a rejection of a Supreme Court decision that told local and state majorities that they couldn’t have the segregated schools they wanted…
Yep. That’s an extraordinary own goal by Horwitz: The true democracy is the Herrenvolk democracy…
Must-Readhttp://www.bradford-delong.com/2017/07/must-read-noah-smith-noahpinion-the-liberty-of-local-bullies-the-liberty-of-local-bullies-i-have-not-been-surprise.html: A propos of Nancy MacLean’s Democracy in Chainshttp://amzn.to/2tGUUeN: My view is that Brown v. Board of Education was not the major cause of James Buchanan’s decision to try to build and U VA President Colgate Darden’s decision to fund the “Virginia School of Political Economy”—Public Choice as a discipline that had only one wing, a right one, and that would, as the late Mancur Olson liked to say, “never be healthy until [or because?] its left wing was as strong as its right, and it was no longer an ideological movement masquerading as an academic sub discipline”.
But BvBoA was certainly a trigger, and support was always very welcome from those whose concerns about appropriate governmental decentralization, limited powers, and checks and balances started and ended with preserving white supremacy.
Joseph E. Stiglitz: Where Modern Macroeconomics Went Wrong: “This paper provides a critique of the DSGE models that have come to dominate macroeconomics during the past quarter-century… http://www.nber.org/papers/w23795
Barbara Biasi and Petra Moser: Effects of Copyrights on Science: Evidence from the WWII Book Republication Program: “In 1942, the American Book Republication Program (BRP) allowed US publishers to reprint exact copies of German-owned science books… https://papers.ssrn.com/sol3/Papers.cfm?abstract_id=2542879
Michael Boskin (March 6, 2009): Obama’s Radicalism Is Killing the Dow: “our new president’s policies are designed to radically re-engineer the market-based U.S. economy… https://www.wsj.com/articles/SB123629969453946717
Amanda Bayer and Cecilia Elena Rouse: Diversity in the Economics Profession: A New Attack on an Old Problem: “The economics profession includes disproportionately few women and members of historically underrepresented racial and ethnic minority groups… https://www.aeaweb.org/articles?id=10.1257/jep.30.4.221
Patrick Tomlinson: How Being an Author Changed After the Affordable Care Act: “there has been one notable exception, one bright spark of hope for many authors, musicians, artists, comedians, and creatives of all stripes. That spark has been the Affordable Care Act…” https://www.tor.com/2017/09/12/how-being-an-author-changed-after-the-affordable-care-act/
Neha Agarwal et al.: Month of birth and child height in 40 countries: “Lokshin and Radyakin (2012) present evidence that month of birth affects child physical growth in India. We replicate these correlations using the same data and demonstrate that they are the result of a spurious relationship between month of birth, age-at-measurement and child growth patterns in developing countries….” http://www.sciencedirect.com/science/article/pii/S0165176517301842
George Dotsis: Option Pricing Methods in the Late 19th Century: “In the late 19th century… investors… had… sophisticated option pricing techniques for determining the prices of at-the-money and slightly out-of-the-money and in-the-money short-term calls and puts… viewed options mainly as instruments to trade volatility…” https://papers.ssrn.com/sol3/papers.cfm?abstract_id=2831362
Over the past several decades, the U.S. economy experienced changes in key economic metrics that don’t bode well for the welfare of most people. The labor share of income is down. So, too, is the capital share of income. Wages for less-educated workers also fell, as did the movement of workers between jobs. Could there be one key factor behind all of these trends—one aspect of the economy that policymakers could address to reverse these declines? That’s what a recent working paper argues, singling out the rise of companies’ market power as the root cause of so many economic woes.
But before Jan De Loecker of Princeton University and Jan Eeckhout of University College London can get to that argument, the authors have to document the increase in markups in the U.S. economy. A firm’s markup is simply the amount they can charge over the cost of providing the good or service they sell. A permanent increase in markups leading to a higher level of profits for companies operating in the economy is a good sign of increased market power. Most other studies that focus on calculating markups have focused on specific industries via case studies, but the two authors of this new working paper use a different process to calculate for the entire economy. Their data source is Compustat, a dataset from the financial services company, which covers all publicly traded firms from 1950 to 2014.
The two authors find a large increase in the average markup from 1980 to 2014—specifically an increase by a factor of 3.65. In 1980, the average markup was 18 percent and by 2014, the average was 67 percent. But interestingly, the increase is concentrated at the top of the markup distribution: The firm at the 90th percentile in 2014 had a markup of about 160 percent, compared to a markup of 40 percent for the 90th percentile firm in 1980. The markup at the median didn’t change much at all. In order to tie these increased markups with rising market power, the economists show how increases in markups are associated with higher profit levels, higher dividend payments, and a higher average market value—all of which would correspond to more market power in the economy.
The rest of the paper focuses on how models of the macroeconomy with increasing markups could explain declining inflation-adjusted wages for low-wage workers, declining labor market flows, and several other trends in the U.S. economy. When it comes to the labor market, their model results in higher markups and more market power, resulting in less overall demand for workers. In other words, the increased power that firms have in products and services markets would result in increased power for them in the labor market. And while De Loecker and Eeckhout don’t formally model the implications of market power for trends such as increased income inequality and lower interest rates, the links there are very possible as well.
One caveat with this paper is that the data they use only includes publicly traded firms, so it’s not clear if the rise in markups is also happening for privately held companies. Another is that while the working paper argues for the importance of documenting the rise of market power in the economy, it doesn’t try to explain why market power has increased. Better understanding why this is happening and its seemingly harmful consequences is more important than ever.
As Congress turns its attention to tax reform, dramatic reductions in the top statutory tax rates on business income are sure to be among the most important and most contentious elements of the debate. Under current law, the top statutory tax rate for traditional C corporations is 35 percent, and the top statutory tax rate for pass-through businesses is 39.6 percent. The Trump administration has proposed a top rate of 15 percent rate for both C corporations and pass-through businesses, and Republicans in the U.S. House of Representatives have proposed a top rate of 20 percent for C corporations and 25 percent for pass-through businesses.1
Proponents of these sharp rate cuts often justify them by arguing that they will increase investment and thus economic growth. In a wide class of economic models, however, the statutory tax rate on business income has no direct relationship to investment or growth. It is instead the effective marginal tax rate on capital that most closely relates to the level of investment. The effective marginal tax rate relevant for investment decisions includes the impact of business-level taxes, investor-level taxes, and lender-level taxes. Statutory tax rates on business income only influence the portion of the effective marginal tax rate attributable to business-level taxes.
The business-level federal effective marginal tax rate on capital depends on many complex provisions of the tax code in addition to the statutory tax rate, including the rules governing the depreciation of business assets, the availability of deductions for interest payments, and tax credits for research and development. The tax rate on an investment varies depending on whether the firm making that investment is a C corporation or a pass-through business, on the amount of the investment financed using debt or equity, and on the assets that make up the investment. Businesses that rely on intellectual property for most of their income, for example, face very different tax rates than those that derive most of their income from rents on real estate—reflecting differences in their ability to benefit from different business tax breaks and in their ability to obtain debt financing for their investments.
This issue brief answers a key question facing policymakers as they debate changes in business taxation: What is the business-level federal effective marginal tax rate on capital today? The analysis in this brief finds that the average effective marginal tax rate is only 8 percent under current law, far less than the statutory tax rates on business income.2 The rate would rise to only 13 percent if a tax break known as bonus depreciation expires in 2020, as scheduled under current law.
Even though little tax is imposed on capital income at the business level, taxes on business income still raise substantial revenues because a large portion of the business-income tax base consists of excess returns (returns above the risk-free rate such as those due to monopoly pricing power), income attributable to labor that was not paid out as wages, and luck. These sources of business income are not included in the definition of capital income used in this brief, consistent with the definition of the effective marginal tax rate on capital, discussed in greater detail below.
While the average business-level effective marginal tax rate is low, rates vary widely for investments in different assets and for investments financed with different proportions of debt and equity. The tax rate on investments in inventories, for example, is 28 percent—relatively close to the statutory rates on business income—while the tax rate on investments in intellectual property is negative-25 percent, meaning an investment would yield excess deductions or credits that could be used to offset taxes owed on other income subject to certain limitations. Similarly, the tax rate on equity-financed investment is 21 percent, while the tax rate on debt-financed investment is negative-54 percent.
Given the low average effective marginal tax rate, it makes little sense to prioritize cutting statutory tax rates. Cutting the statutory tax rates on business income would do relatively little to encourage additional investment and thus have relatively little effect on growth, even before considering the effects of increased deficits resulting from the rate cuts or additional policies to offset that cost. Moreover, the tax cut resulting from a reduction in the statutory tax rates on business income would be severely regressive.
Instead, the combination of a low average effective marginal tax rate and substantial variation in rates for different investments means that there is an opportunity to pursue a superior approach to reform that would focus on reducing the disparity in tax rates between investments and thus generate a more efficient mix of investment projects.
More concretely, rather than cutting statutory tax rates, Congress should pursue a revenue-neutral or revenue-increasing reallocation of the current tax benefits for debt to equity that reduces the disparities in the tax rates on investments in different types of produced capital: equipment, structures, inventories, and intangibles. Such a reallocation could also lower the tax rate on produced capital and increase the tax rate on land. These reforms would offer a more plausible path to economic growth than reductions in the statutory tax rates on business income.
Federal taxation of business income
Income derived from business activity is subject to a complicated set of interconnected taxes. U.S. businesses can be structured as either traditional C corporations or as pass-through businesses. Traditional C corporations pay corporate income tax on their profits. Pass-through businesses—including S corporations, partnerships, and sole proprietorships—are not subject to the corporate income tax. Instead, owners of pass-through businesses pay tax on their share of the businesses’ profits as part of the computation of their individual income-tax liability. The choice between corporate and pass-through form is largely at the discretion of the owners. While the two forms impose different legal requirements and result in different legal and tax treatments, both forms are common and appear in a wide range of industries.
Dividends paid by C corporations are subject to tax at the individual level, but dividends or other distributions from pass-through entities are generally not subject to tax at the individual level. Investors in any type of business who sell an ownership stake that has increased in value realize a capital gain and pay tax on the resulting income. Lenders to any type of business pay tax on interest payments received from the business.
The corporate income tax and the individual income tax rely on similar measures of business profits for determining the tax on corporate income and pass-through income, respectively. Profits are defined as receipts less the cost of goods sold, employee compensation, operating expenses such as accounting and legal services, depreciation, and interest payments.3 The corporate income tax has graduated rates, but the top rate of 35 percent applies to the overwhelming majority of corporate income. Income derived from pass-through businesses is subject to tax according to the progressive rate schedule for the individual income tax.
In addition to the statutory tax rate on business income, the key determinants of the effective marginal tax rate on capital are the rules governing cost recovery, interest deductibility, and the research credit. Each of these components is examined in turn below.
Cost recovery
Cost recovery refers to the quantity and timing of depreciation deductions allowed for capital expenditures such as the purchase of new equipment or buildings. If a business can immediately deduct the cost of a capital expenditure, then the investment is said to be expensed. If a business can deduct only a portion of the cost each year over a multiyear period, then the investment is said to be depreciated. Depreciation at a rate that corresponds to the decline in value of the asset over time is referred to as economic depreciation, and depreciation at a faster pace is referred to as accelerated depreciation. Economic depreciation is required for the proper measurement of income. Under a system of economic depreciation, depreciation deductions correspond to the decline in value of the assets owned by the business, and thus sales less operating expenses and depreciation yields an accurate measure of the income generated by the business. A tax system that follows economic depreciation and has no other special deductions or credits would impose a business-level tax on equity-financed investment equal to the statutory tax rate.
Under current tax law, most investment in equipment and structures is eligible for accelerated depreciation, and most investment in intangible assets such as research and development is expensed. Both accelerated depreciation and expensing reduce the tax rate applied to capital income because deductions are allowed before the corresponding loss due to a decline in the value of the underlying asset. Because a dollar today is worth more than a dollar tomorrow, the value of the reduction in tax today exceeds the value of the future increase in tax, even though the nominal amounts are the same. In contrast to the treatment of equipment and structures, no depreciation deductions are allowed for land or inventories.
To illustrate how these calculations work, consider a simplified example involving the business purchase of a truck. Suppose the truck is expected to last for 8 years. A business that purchased the truck for $20,000 might depreciate it for accounting purposes over that 8-year period, deducting $2,500 from income each year. In contrast, the tax code allows businesses to write off trucks over 5 years. The business could then deduct $4,000 each year for 5 years and recover the value of the investment in the truck over a shorter period.4 Because the deductions are accelerated relative to the decline in value of the asset, they serve to reduce the tax rate on the income generated by the asset.
Depreciation of most equipment and software investment is further accelerated as a result of a temporary provision of law known as bonus depreciation. Bonus depreciation, which has been in effect since 2008, allows businesses to expense a percentage of equipment and software investment and then depreciate the remainder under the usual schedule. Under current law, bonus depreciation is available at a 50 percent rate in 2017, 40 percent rate in 2018, and 30 percent rate in 2019. Bonus depreciation expires in 2020.
Interest deductibility
The measure of business profits subject to tax under either the corporate income tax or the individual income tax consists of receipts less the cost of goods sold, operating expenses, depreciation deductions, and interest payments. As discussed above, economic depreciation is necessary for the proper measurement of capital income, and accelerated depreciation serves as an investment incentive. In contrast, interest deductions serve to assign the legal responsibility for paying tax on capital income to the lenders financing the activity instead of the business owners. As such, they have no direct relationship to the measurement of capital income generated by the underlying business activity. Because the deductibility of interest allows businesses to provide a return to lenders without paying any tax on the income that generated that return at the business level, it reduces the taxation of capital at the business level.
Consider a hypothetical tax system with economic depreciation and full interest deductibility. A firm finances an investment project solely with debt and realizes a return equal to the interest rate paid on the loan. The deductible interest payments would exactly offset the income from the investment such that the business’s income for tax purposes would be zero in every year and thus there would be no business-level tax on that investment.5
If all businesses and lenders were taxable at the same rate, repealing interest deductibility for businesses and exempting interest income from tax would reassign the legal responsibility for paying tax to business owners rather than lenders without changing the overall level of tax, including both the business- and lender-level taxes. (In practice, interest deductions reported by businesses exceed taxable interest income reported by lenders, suggesting that substantial interest income is avoiding tax at both levels.) For the purposes of evaluating proposals for reduced statutory tax rates on business income, however, the distinction between taxation at the business level and the lender level is crucial. Reducing the statutory tax rate on business income reduces the value of the deduction for interest payments received by the business and thus increases the tax rate on debt-financed investment.
Research and development tax credit
Research and development expenses are generally expensed rather than depreciated over time, in line with the decline in value of the intellectual property created by those expenses. In addition, federal tax law also provides a credit for research expenses. Businesses can use one of two different formulas to compute the credit. The regular credit is equal to 20 percent of the amount by which research expenses exceed a base amount. The alternative credit is equal to 14 percent of the amount by which research expenses exceed 50 percent of average research expenses over the prior 3 years.6 For purposes of computing depreciation deductions, the cost of the asset is reduced by the value of the credit received. The credit serves to reduce the taxation of investments in intangible capital generated through research and development.
Effective marginal tax rates
The effective marginal tax rate on capital is the percentage of the pre-tax return paid in taxes on an investment that yields the minimum return required to obtain financing in the capital markets. This rate is not specified in statute, but rather is an analytic quantity that summarizes the impact of many different aspects of the tax system, including the statutory tax rate on business income, the generosity of cost-recovery rules, and the treatment of interest payments over the entire life of an investment project.
This brief presents estimates of the federal effective marginal tax rate on produced domestic capital imposed at the business level. For C corporations, this is the rate imposed by the corporate income tax. For pass-through businesses, this is the rate imposed on owners via the individual income tax, excluding the tax on interest paid by lenders. Produced capital—defined here as equipment, structures, inventories, and intangibles—consists of those types of capital for which the stock can vary in accordance with investment. In contrast, land—the other major type of capital—is available in relatively fixed supply. Domestic capital refers to firms’ investments located in the United States.7
Effective marginal tax rates are typically estimated by applying current tax law to hypothetical investments by C corporations and pass-through entities in a wide array of assets using different financing arrangements, and then aggregating these estimated tax rates for narrowly defined investment projects into averages for broad classes of assets, financing arrangements, and corporate or pass-through tax treatment. The methods used in this brief are similar to those used by other analysts, including the Congressional Budget Office, U.S. Treasury Department, and the Congressional Research Service.8
The effective marginal tax rate influences the size of the capital stock in a wide class of economic models and thus has direct relevance for judging the economic effects of the tax system. If this rate is zero for a particular type of investment, then the tax system imposes no tax on an investment of that type that yields the return required to obtain financing in capital markets. Thus, it neither increases nor decreases the financial incentive to engage in such investment.9 A negative tax rate indicates that an investment would yield excess deductions or credits that could be used to offset taxes owed on other income subject to certain limitations.
In addition to the effective marginal tax rate, numerous other tax rates also relevant for economic decisions can be defined and analyzed. The statutory tax rate on business income, for example, is relevant for avoidance behavior such as international profit shifting or shifting between the individual and business base. The effective average tax rate can be relevant for multinational corporations planning a single large investment that must decide in which country to make the investment.10 And several possible definitions of the average tax rate exist that measure the overall level of tax paid by business owners.11 This brief focuses on the effective marginal tax rate due its importance for the evaluation of claims about changes in the level of investment resulting from tax reform.
The estimates reported in this brief are broadly similar to those produced by other analysts when the definitions used are the same. Two definitions used in this analysis are noteworthy relative to those used by other analysts. First, while the business-level tax rate is frequently discussed in the context of corporate taxes, estimates of the effective marginal tax rates for pass-throughs typically do not draw the same distinction between the business-level and investor-level taxes. The distinction is made here because it is directly relevant to evaluating recent proposals for sharply reduced statutory rates on business income.
Second, analysts use widely varying definitions of intangible capital.12 This analysis, similar to that of the Congressional Research Service, uses a broad definition of intangible capital, including information technology, research and development, advertising, creative works, strategic planning, and firm-specific employee training. The U.S. Treasury Department typically uses a narrower definition, including only software, research and development, advertising, and creative works. In its most recent analysis, the Congressional Budget Office excluded intangible capital, apart from certain types of software.
Current effective marginal tax rates
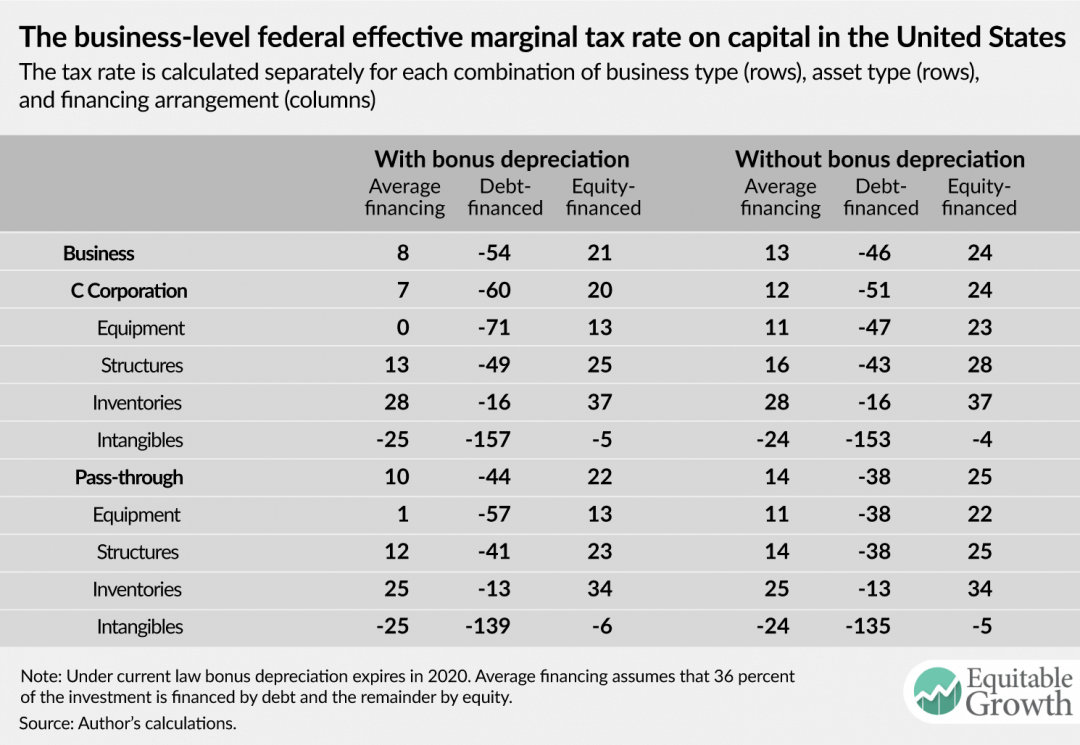
Table 1 below presents estimates of the business-level effective marginal tax rate on produced domestic capital under current law. The first three columns provide estimates assuming 50 percent bonus depreciation, and the second three columns provide estimates assuming bonus depreciation has expired. (Bonus depreciation is available at a 50 percent rate through 2017 and phases down to zero at the beginning of 2020.) The average effective marginal tax rate for produced domestic-business capital at the business level is 8 percent under current law today and 13 percent without bonus depreciation, as would be the case for current law in 2020. These rates reflect the average of strongly negative tax rates for fully debt-financed investment (negative-54 percent) and a positive tax rate for fully equity-financed investment (21 percent).
Table 1
Some caution should be applied in interpreting the tax rates for fully debt-financed investment shown in Table 1. Large negative tax rates indicate that an investment yields deductions or credits more than sufficient to eliminate the tax on that investment over its useful life, but a business may not be able to recognize the full benefit of those deductions or credits due to limitations on the deductibility of business losses. Moreover, it would be difficult, if not impossible, for a small or new business to finance an investment solely through debt. In the case of a large business, an investment could be financed solely with debt, though in that case there would be generally be an implicit transfer of risk onto the broader business. (The underlying methodology, as is standard for effective marginal tax rate computations, abstracts from risk.) The role of debt finance will be explored further in the next section.
The estimated effective marginal tax rates on capital are far below the statutory rates on business income. The underlying model assumes the statutory rate on corporate income is 34 percent, reflecting an assumed statutory rate of 35 percent and a 1 percentage point reduction attributable to the domestic-production activities deduction, and the statutory rate on pass-through income is 31 percent, reflecting an income-weighted average of the tax rate on pass-through income.13
The difference between the assumed statutory rates in the modeling and the effective rates is driven by four primary factors: accelerated depreciation of tangible investment, expensing of most intangible investment, largely unrestricted interest deductibility, and the research credit.
In the case of an equity-financed investment, the tax preference for interest is not relevant. The difference between the effective tax rate and the statutory tax rate reflects the value of accelerated depreciation, expensing, and the research credit. Accelerated depreciation and expensing cause federal tax law to understate income and thus result in tax at a lower rate. The research credit directly offsets tax, thus reducing the tax rate on eligible investment.
In the case of a debt-financed investment, it is useful to recall the hypothetical tax system with economic depreciation and interest deductibility discussed above. Under this system, a debt-financed investment would face no tax. Thus, offering accelerated depreciation reduces the tax rate below zero for a debt-financed investment, subsidizing the investment rather than taxing it. Moreover, the theoretical result that economic depreciation and interest deductibility jointly impose zero tax assumes deductibility of real (inflation-adjusted) interest payments. In practice, interest payments include both the real interest payment and an additional payment to compensate the lender for the decline in the value of the principal due to inflation. As the U.S. tax system allows for the deduction of nominal interest payments, it further subsidizes debt-financed investments at the business level.
The tax rate on investments financed by a mix of debt and equity reflects an average of the pure debt and pure equity cases. One useful way to think about the economics of this case is that the debt-financed portion of the investment is exempt from tax at the business level as a result of economic depreciation plus interest deductibility. Yet the debt-financed portion entitles the business to an additional tax benefit attributable to the excess of actual depreciation deductions over economic depreciation on that portion of the investment—and this benefit can be used to further shelter the return on the equity-financed portion of the investment. Thus, by using debt finance, equity owners can effectively shelter an additional portion of their return on investment from tax.
Table 1 above presents estimates of tax rates by form of business and asset type. The business-level effective marginal tax rate is slightly higher for pass-throughs than for C corporations, though this finding is primarily the result of a different weighting of investments across asset types rather than higher tax rates for each asset type. Consistent with other analyses, the effective marginal tax rate is highest for inventories, which are not depreciated, and lowest for intangibles, which are generally expensed and often eligible for the research credit. But the results in Table 1 are highly sensitive to assumptions about the use of debt finance, as will be discussed in the next section.
The role of debt finance
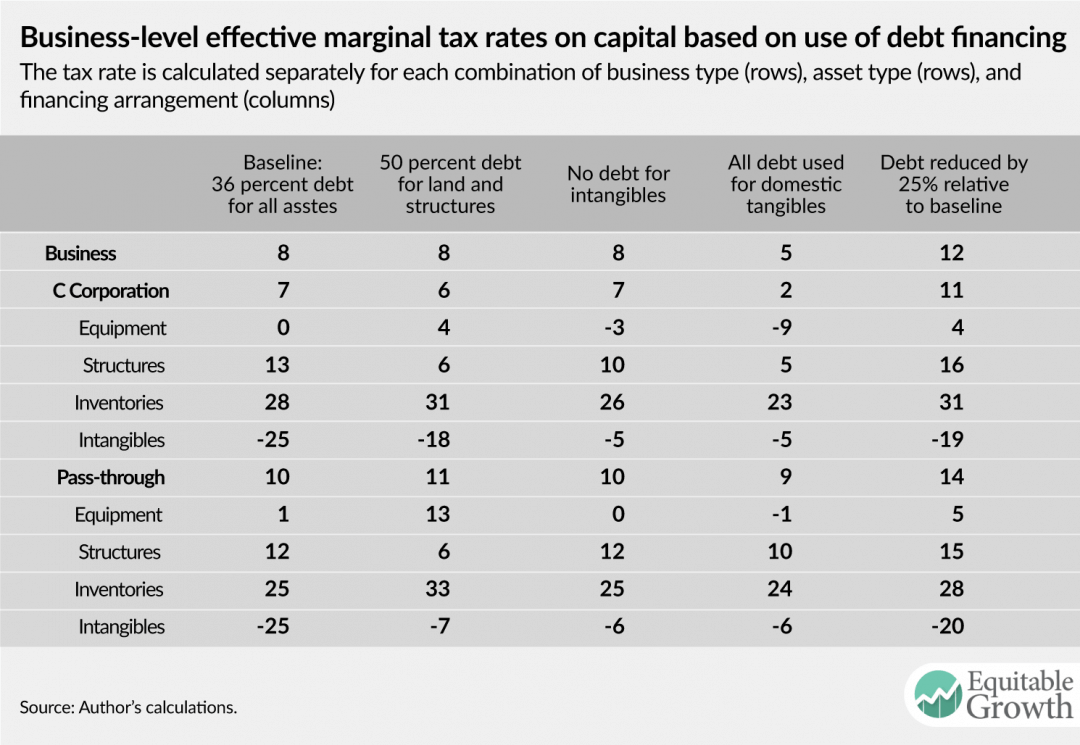
Estimated effective marginal tax rates on capital are highly sensitive to the assumptions about the use of debt finance. Table 2 below shows effective marginal tax rates under the baseline assumption about the use of debt finance and four alternatives. Under the baseline assumption used above in Table 1, all investments are financed with the same share of debt. The first column of Table 2 repeats the baseline estimates. The second column reports estimates assuming debt is used to finance 50 percent of land and structures. The share of debt financing for all other asset types is reduced to hold fixed the aggregate quantity of debt. The third column reports estimates assuming debt is fully allocated to tangible investment. The fourth column reports estimates assuming debt is fully allocated to domestic tangible investment (debt issued in the United States is not used to finance firms’ overseas investments). The fifth column uses the base case assumption of equal use of debt finance across types of investments but reduces the share of debt finance for all investments by 25 percent. Note that while the table only reports tax rates on produced domestic capital, the underlying model includes land and foreign investment. Thus, the aggregate quantity of debt implicit in the tax rates reported in Table 2 varies across columns, as debt assigned to asset classes not shown—land and foreign investment—changes.
Table 2
Findings about the relative tax rate on different assets are highly sensitive to assumptions about the use of debt finance. Assuming 50 percent of investment in land and structures is financed with debt results in nearly equal tax rates on equipment and structures, rather than a 13 percentage point gap between the tax rates. Allocating a greater share of debt to tangible assets rather than intangible assets results in a modest reduction in the effective marginal tax rate for tangible assets. Allocating a greater share of debt to domestic investment more substantially reduces the rate for domestic-produced assets. Finally, reducing the share of debt finance across the board results in a modest increase for all assets.
The variation in tax rates apparent in Table 2 also highlights the extent to which there is no single tax rate on investments, even for a particular mix of assets. The tax rate on a project will depend on the financing arrangements for that project. The importance of debt in avoiding business-level taxes can be seen by examining how these provisions apply to real estate partnerships.
Case study: Real estate partnerships
Statistics on the rental income of partnerships in the real estate industry provide a useful illustration of how accelerated depreciation and interest deductibility operate to shelter capital income from tax at the business level and thus generate low effective marginal tax rates. Moreover, as real estate partnerships account for more than $2 trillion of depreciable assets (judged at book value), these results are relevant for the broader economy.14
Real estate partnerships reported $524 billion in gross rents, $484 billion in rental expenses, and $2 billion in gains from the sale of rental property in 2014, the most recent year for which data are available. Net income from rental activities for tax purposes was thus $43 billion.15 Of the rental expenses, interest payments accounted for $114 billion and depreciation deductions for $109 billion.
Because depreciation for tax purposes differs from economic depreciation, it would not be appropriate to use the $43 billion in income reported on tax returns plus interest payments as an estimate of the economic income generated by the sector. Instead, estimating the economic income of these businesses requires an adjustment to the reported depreciation values. Using the ratio of economic depreciation to tax depreciation reported in the National Income and Product Accounts for sole proprietorships and partnerships to adjust the depreciation reported on real estate partnership tax returns yields an estimate of $59 billion for economic depreciation in the sector.16 This approximation suggests the economic income generated by rental partnerships—on behalf of equity owners and lenders—was about $208 billion, equal to the net income reported on tax returns plus interest and tax depreciation less economic depreciation. Thus, the taxable income reported from real estate activities was only 21 percent of the economic income generated by the sector.17 Of course, as partnerships are pass-through entities, the tax paid on the taxable share depends on the characteristics of the partners.
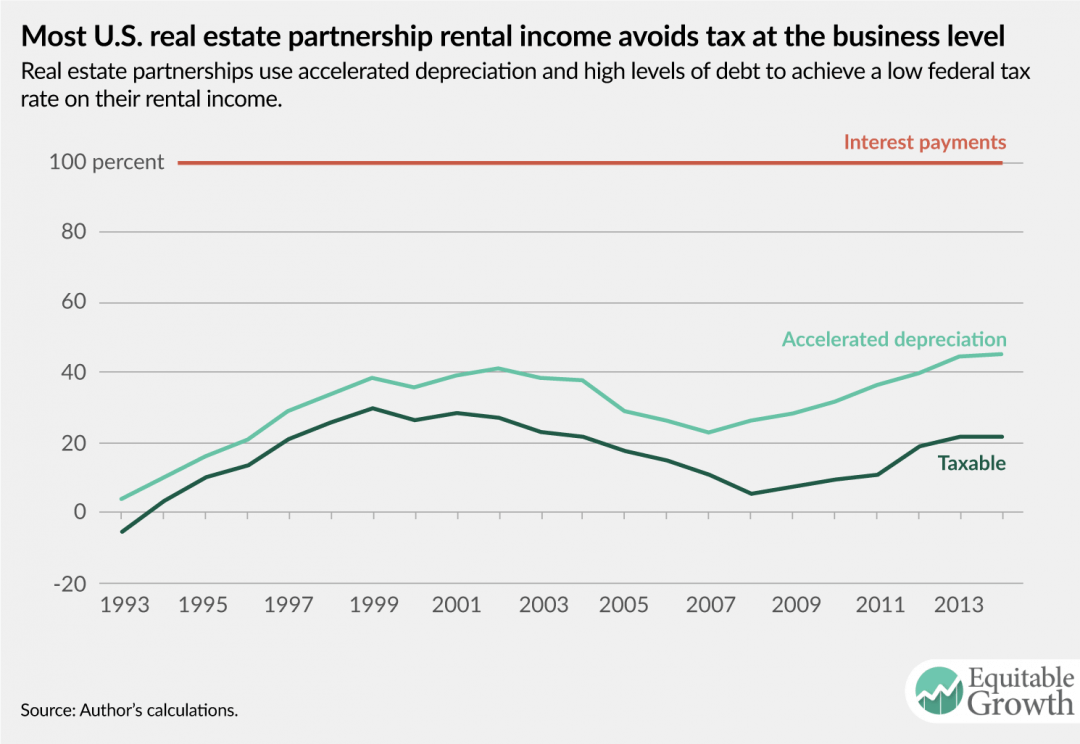
Figure 1 shows the same calculation for the years 1993 to 2014. Average net income at the business level for rental partnerships is only 16 percent of the economic income generated by these businesses over this period.
Figure 1
While interest payments reflect a permanent avoidance of business-level tax, accelerated depreciation allowances only change the timing of tax payments. Thus, for a specific investment project, an additional dollar of depreciation allowances today results in a dollar less of depreciation allowances in the future. But depending on the pattern of investment returns and asset sales over time, the aggregate taxable share of income for all partnerships could remain less than economic income less interest payments in all years.
Moreover, real estate partnership tax returns suggest that tax rates similar to those reported in this brief may overstate the tax paid on investments in that industry. The largest single source of income reported by these partnerships in many years is not rental income, but section 1231 gains. These gains are likely generated in large part by the sale of rental property, and the tax rates applied to such gains are often substantially lower than the rates that apply to rental income. The modeling underlying the estimates reported in this brief rules out the sale of business property and assumes that the tax rate applicable to business income is constant over time. Thus, if depreciation deductions are increased by a dollar today and reduced by a dollar in the future, then the tax savings today and the additional tax in the future are the same before discounting. If, instead, businesses benefit from depreciation deductions today at a higher tax rate and then sell assets later while facing a lower tax rate, accelerated depreciation can be worth more than the modeling assumes.
Finally, while this brief focuses on produced capital consisting of equipment, structures, inventories, and intangible assets, the rental industry relies to a substantial extent on land, which is available in relatively fixed quantity. Real estate partnerships report land equal to roughly one-third of the value of depreciable assets, judged at book value. A substantial fraction of the income reported by rental partnerships thus reflects returns on land rather than returns on produced capital. In fact, assuming debt financing of roughly 60 percent—a higher share than assumed in the tax rate estimates presented in this brief but not unreasonable given the estimates in Figure 1 above—the business-level effective marginal tax rate on structures would be about zero, and the effective marginal tax rate on land would be about 10 percent for both C corporations and pass-through businesses. These tax rates suggest that nearly all the rental income reported on real estate partnership returns is a return to land, excess returns, or labor income—not to investments in structures.
Implications for tax reform
Business-level federal effective marginal tax rates on capital income are quite low: 8 percent under current law and 13 percent if bonus depreciation expires. Rates are strongly negative for debt-financed investment, at negative-54 percent, and positive for equity-financed investment, at 21 percent. Moreover, other recent research suggests that the overwhelming majority of the corporate tax base consists of excess returns and labor income, not the risk-free return on produced capital.18
In light of these findings, the case for reductions in the statutory business tax rate as a means of spurring additional capital investment is weak. A reduction in the business tax rate would come at a very high cost, as it would apply to the entire business tax base, including excess returns and labor income, as well as to returns on investments made in the past.19 The impact on capital investment would be highly attenuated, as debt-financed investments face a negative rate at the business level, and thus a rate cut would increase the tax rate on such investments by reducing the value of the deductions they generate. Moreover, as lowering the cost of capital is the channel through which a reduced effective marginal tax rate can increase investment, deficit-financed tax cuts that increase the cost of capital can be actively counterproductive.
While the average rate is low, there is substantial variation in tax rates across asset types and financing arrangements. If 36 percent of each investment is financed with debt—the baseline assumption about the use of debt finance in this brief—then inventory investment is taxed at 28 percent, and intangible investment is taxed at a rate of negative-25 percent. Equipment is taxed at a near-zero rate, and structures are taxed at a rate of 13 percent. If, instead, 50 percent of investment in structures is financed with debt, then the effective marginal tax rate on such investment is only 6 percent. The tax rate that would apply to any real-world investment would almost certainly differ from any of these tax rates, as it would rely on financing and legal arrangements different from any of the scenarios presented.
A better approach to reform would therefore focus on reducing the disparities in tax rates across types of produced capital and across financing arrangements. This variation is largely driven by variation in the extent to which tax depreciation is accelerated relative to economic depreciation and variation in the use of debt finance. Well-designed reform should thus pursue a revenue-neutral or revenue-increasing reallocation of the current tax benefits for debt to equity that reduces the disparities in the tax rates on investments in different types of produced capital. Such a reallocation could also lower the tax rate on produced capital and increase the tax rate on land. These reforms would offer a more plausible path to economic growth than reductions in the statutory tax rates on business income.