Weekend reading: “Discussing distributional tables” edition

This is a weekly post we publish on Fridays with links to articles that touch on economic inequality and growth. The first section is a round-up of what Equitable Growth published this week and the second is the work we’re highlighting from elsewhere. We won’t be the first to share these articles, but we hope by taking a look back at the whole week, we can put them in context.

Equitable Growth round-up

The Federal Reserve announced on Wednesday that it would start shrinking its balance sheet. This is not the first time it has unwound a large amount of its excess reserves. There may be lessons from the U.S. central bank’s experience in the 1930s.

As issues of market concentration and power become more prominent, analysts thinking about how to update U.S. antitrust policy have to consider whether to tweak existing doctrine or create a new one. Liz Hipple looks at a set of policy proposals that tries to take a “both/and” approach.

Distribution tables are the most common way of analyzing how tax reforms could affect income distribution. Many analysts argue that traditional distribution tables are flawed because they don’t account for the consequences of economic growth. Greg Leiserson rebuts that view and argues in favor of using “static” tables for evaluating tax reform plans.

As U.S. policymakers consider reforms to the tax code, Nisha Chikhale points out why they shouldn’t forget the Earned Income Tax Credit. She takes a look at a bill that would significantly increase the value of the tax credit for low- and moderate-income workers.

Links from around the web

The decline in the start-up firms across the U.S. economy is now a well-documented and troubling trend. Ben Casselman reports on how rising concentration and stronger market power for older companies may be responsible for the dearth of new companies. [nyt]

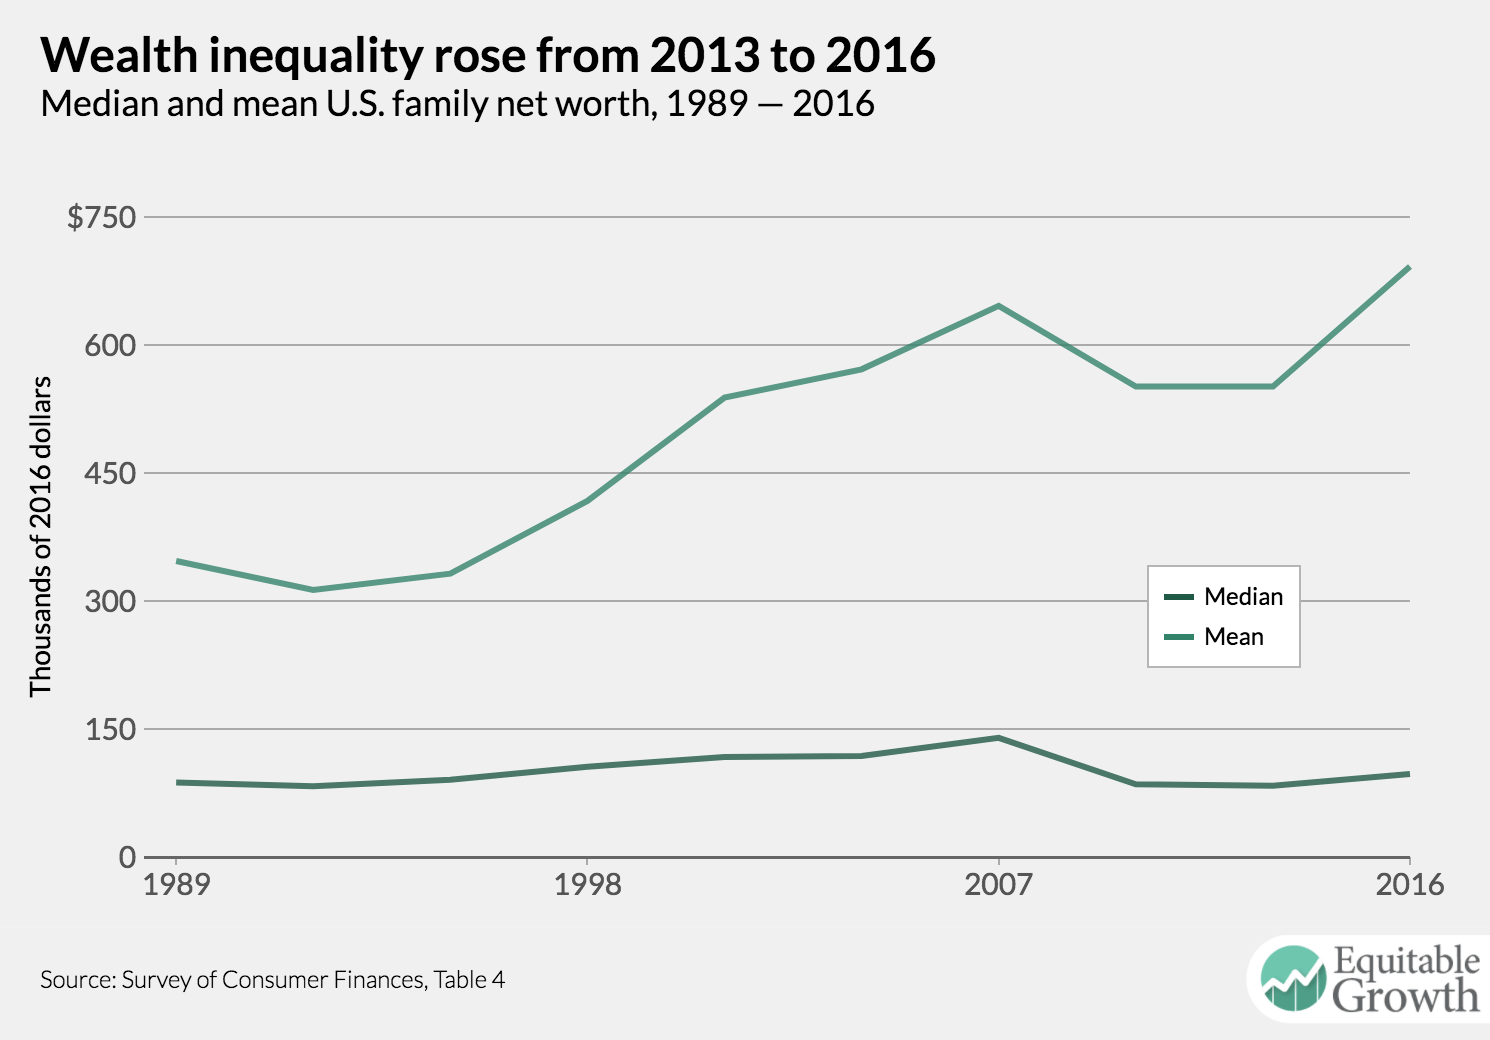
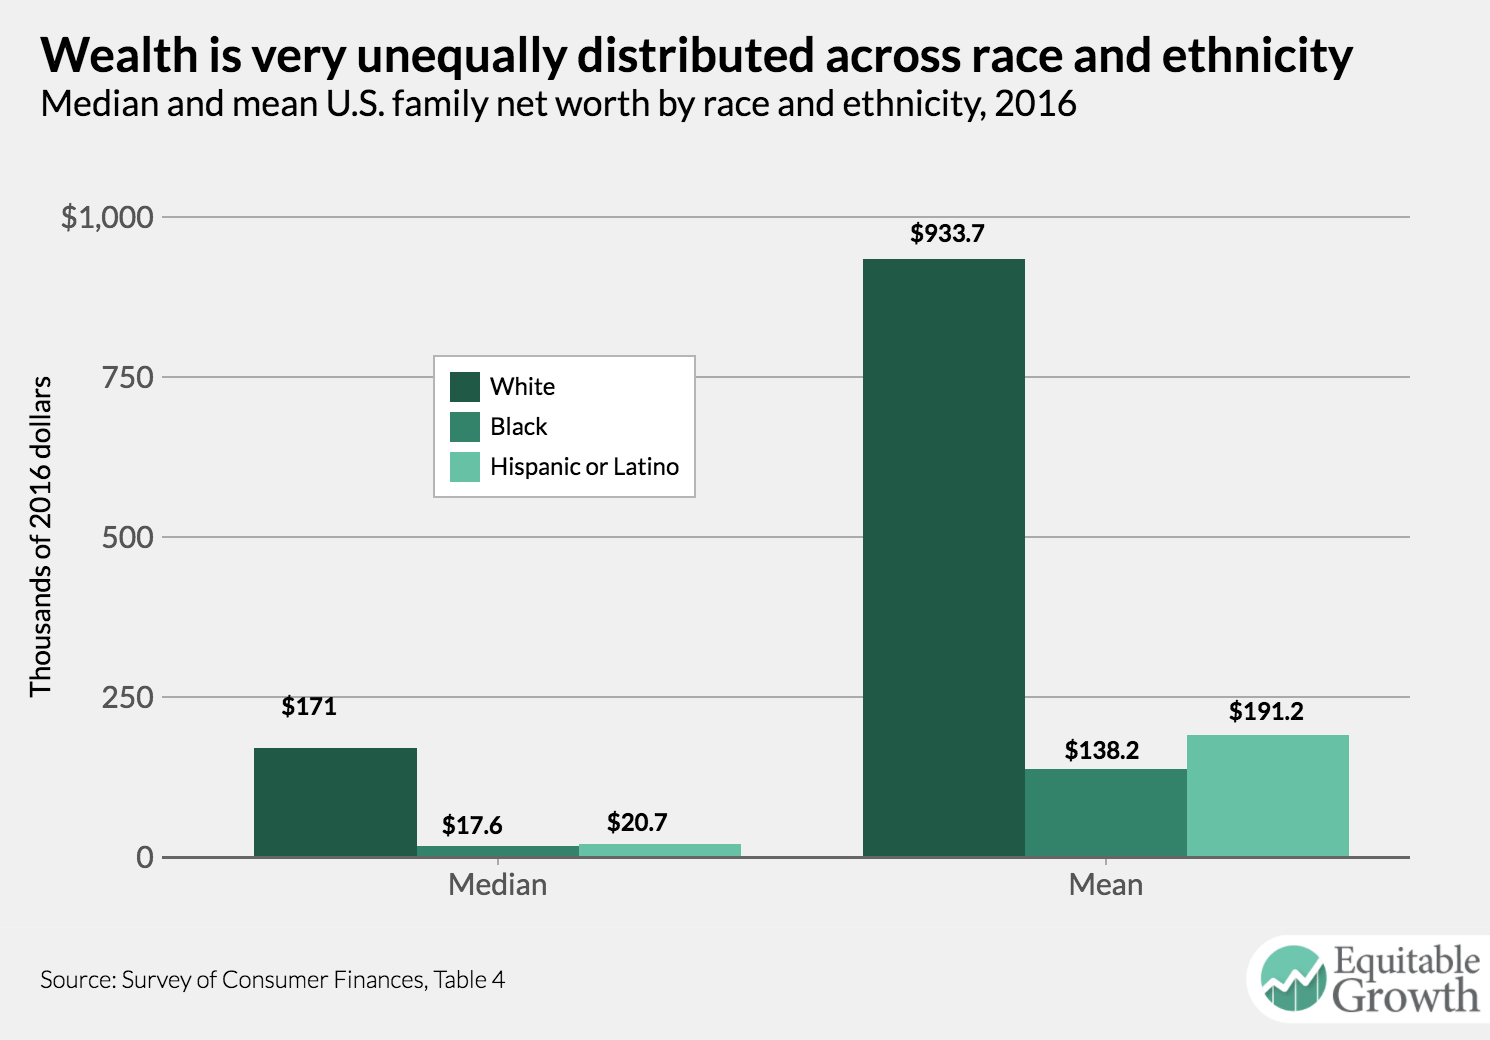
The median white family in the United States has 13 time more wealth than the median black family. Gillian White reports on a new book that argues efforts to combat this wealth gap via self-sufficiency and “black capitalism” have fallen flat. [the atlantic]

The statutory U.S. corporate income tax rate masks over a lot of variance in how much taxes companies in different industries pay. Jordan Weissmann argues that many of the current proposals to reform the corporate tax will make this variation even more severe. [slate]

Do Americans change their opinions when they are exposed to information about trends in economic inequality? Leslie McCall and Jennifer Richeson discuss their research, which shows such information changes people’s feelings about economic opportunity. [wapo]

As the Federal Reserve unwinds the financial assets it accumulated during its quantitative easing, some economists and investors fear a smaller balance sheet might be a drag on the economy. David Beckworth argues that the effect shouldn’t be very large, looking at the effects of QE2 and QE3. [macro musings]

Friday figure

Figure is from “Expanding the Earned Income Tax Credit is worth exploring in the U.S. tax reform debate,” by Nisha Chikhale

Should-Read: Joseph E. Stiglitz: The Revolution of Information Economics: The Past and the Future

Should-Read: Joseph E. Stiglitz: The Revolution of Information Economics: The Past and the Future: “The economics of information has constituted a revolution in economics… http://www.nber.org/papers/w23780

…providing explanations of phenomena that previously had been unexplained and upsetting longstanding presumptions, including that of market efficiency, with profound implications for economic policy. Information failures are associated with numerous other market failures, including incomplete risk markets, imperfect capital markets, and imperfections in competition, enhancing opportunities for rent seeking and exploitation. This paper puts into perspective nearly a half century of research, including recent advances in understanding the implications of imperfect information for financial market regulation, macro-stability, inequality, and public and corporate governance; and in recognizing the endogeneity of information imperfections. It explores the consequences of recent advances in technology and the policy challenges and opportunities they present for competition policy and policies regarding privacy and transparency.

The paper notes the role that information economics played in stimulating other advances in economics, including contract theory and behavioral economics. It reinvigorated institutional economics, showing how institutions mattered, in some cases explaining institutional features that could not be well-understood in the conventional paradigm, and in others showing how institutional responses to market failures might or might not be welfare enhancing.

The paper argues that the new paradigm provides a markedly different, and better, lens for looking at the economy than the older perfect markets competitive paradigm…

Posted in Uncategorized

Should-Read: Matthew Yglesias: The economy really is broken — but we know how to fix it

Matthew Yglesias: The economy really is broken — but we know how to fix it: “The top 5 percent includes all the members of Congress and all of the donors and lobbyists and business leaders whom members of Congress speak to… https://www.vox.com/2017/9/19/16319416/broken-economy

…It also includes all the Federal Reserve governors and regional bank presidents and all the business leaders whom they speak to. It includes the top editors of all the major media outlets and most of the star talent. For that matter, it also includes most of the leading economic experts at top universities. All else being equal, of course, political elites prefer lower unemployment to higher. But it simply isn’t instinctively urgent in elite circles the way a financial market panic is. When the economy was crashing in the fall of 2008, the American political system went into emergency mode. When things had stabilized by the summer of 2009, emergency mode ended. But for the bottom 95 percent or so, the emergency didn’t really end until years later.

Yet policymakers spent this whole period in a kind of haze of inflation paranoia carried over from the 1970s. Tim Geithner in his memoirs says that even at the peak of the crisis, it was important for the Fed to “signal that they’ll eventually hit the brakes, and that they’ll remain vigilant about inflation going forward,” even though creating an expectation of future catch-up inflation would actually have boosted the economy at the bottom. The Obama administration pivoted to deficit reduction in early 2010 based on vague green shoots of recovery. And Republicans were, of course, worse, preaching austerity at the worst possible time. Janet Yellen’s Federal Reserve is raising interest rates to slow job creation in order to head off the possibility of future inflation even though actual inflation remains below target. Meanwhile, Kevin Warsh — the Republican most likely to replace Yellen — spent years warning that the Fed was doing too much to aggressively boost job creation.

For the economy to work for normal people, the federal government needs to be obsessed with avoiding recessions and making them as short as possible. If that means short bursts of inflation during supply-side shocks, or reduced bank profits due to restrictions on lending, or high deficits to stimulate the economy, we need to be willing to make those trade-offs. Wage earning is the backbone of the mainstream economy, and when unemployment is high, not only do a few million people lose out on the chance to work but tens of millions more lose the chance to bargain for wages…

Should-Read: Jacob Levy: Black Liberty Matters

Should-Read: Jacob Levy: Black Liberty Matters: “‘How is it that we hear the loudest yelps for liberty among the drivers of negroes?’… https://niskanencenter.org/blog/black-liberty-matters/

…This was Samuel Johnson’s bitter rhetorical question about the American revolution, and the conflict it identifies has never been far from the surface of American political and intellectual life…. The language of freedom in American political discourse has very often been appropriated for the defense of white supremacy. We have often heard the loudest yelps for liberty among those trying to protect the terror and apartheid states of the Jim Crow south, the quasi-serfdom of sharecropping, segregated schools, miscegenation laws, and the suppression of black votes. Particular types of freedom or particular strategies for limiting governmental power—freedom of association, religious liberty, federalism, bicameralism, and so on—all came to be identified at one point or another primarily as ways to prevent the federal government from breaking the power of white rule….

None of this means that liberty is not a worthwhile, and true, ideal…. [But] those who proclaim their commitment to freedom have all too often assessed threats to freedom as if those facing African-Americans don’t count—as if black liberty does not matter…. Two recent and awkwardly-connected controversies within, and about, American libertarianism.

Nancy MacLean Missed the Story on Libertarianism’s Race Problem: The more prominent is the debate about Nancy MacLean’s book on James Buchanan, the Nobel Prize-winning economist and a founder of public choice theory…. She treats Buchanan as the architect of a decades-long conspiratorial strategy to advance a political agenda that was both anti-democratic and compatible with (indeed possibly supportive of) the maintenance of Jim Crow…. The claims MacLean makes are untrue about Buchanan. But the history of the postwar libertarian movement is rich with moments of flirtation or outright entanglement with the defenders of white supremacy… the explicit sympathy for the Confederacy… Murray Rothbard’s support for Strom Thurmond… Lew Rockwell’s celebration of the beating of Rodney King… the racism… under Ron Paul’s name in… the 1980s and 90s… the insistence on discussing the Civil Rights Act primarily in terms of freedom of association (as if white supremacy in the Jim Crow south were just a private taste that some people indulged), and an interest in freedom of speech that focuses disproportionately on the freedom to indulge in racially-charged “political incorrectness” could all figure in such a book….

But there are ways to neglect black liberty that are subtler than the white nationalism of the Confederatistas. Think about the different ways that market liberals and libertarians talk about “welfare” from how they talk about other kinds of government redistribution…. The white welfare state of the 1930s-60s that channeled government support for, e.g., housing, urban development, and higher education through segregated institutions has a way of disappearing from the historical memory; the degrees earned and homes bought get remembered as hard work contributing to the American dream….

Returning for a moment to the overt white nationalists allows us to also think about the other recent dispute about libertarian politics: the embarrassingly large number of people associated with the racist alt-right who once identified as libertarians, or (even worse) still do. Some of this is just the inevitable sociology of the fringe…. But… the capture of the language of freedom by the defenders of white supremacy and the Confederacy is a major fact about American political language and its history, and there’s a small but vocal group of self-identified libertarians who participate in it and perpetuate it…. Reimagining libertarian politics in light of the truth that black liberty matters will take a lot of intellectual and moral work…

Should-Read: Ann Marie Marciarille: Eat Out Much?

Should-Read: Ann Marie Marciarille: Eat Out Much?: “With 16 dead and well over 400 documented as infected, it is fair to say San Diego is in the midst of an epidemic of Hepatitis A… http://www.marciarille.com/2017/09/eat-out-much.html

…Other cities with large populations of homeless individuals should be afraid, very afraid. I’m looking at you: Detroit, Salt Lake City, Santa Cruz, and others. It is significant that there already appears to be a satellite outbreak in Santa Cruz. We are, at present, witnessing the second largest U.S. based Hepatitis A outbreak in decades…. Public health authorities have had to try to reach customers of a popular tourist restaurant who may have been exposed through contact with a kitchen worker, who may have been exposed through a partner.  I note that responsible articles go out of the way to elaborate that restaurant transmission is not a common occurence, though a drop off in business at the particular restaurant has already been reported…. Fear of Hepatitis A  transmission in California has officially made the leap from what I call “them to us.”…

Then why are we so laissez-faire? First, it is and was invasive to require physical health examination of all food service workers for contagious diseases, even in the 1920’s. Second, it costs money, whether born by public health authorities or by food service employers and it is money spent examining a low wage workforce with high employment turnover. Third, we do not want to acknowledge that our health as food service product consumers is deeply intertwined with the health status of the food service industry worker’s health. Admitting otherwise punctures two popular American myths — the first that we are all almost completely in control of our own health and disease status as individuals and that your lack of health insurance or lack of easy access to health maintenance care is your problem and not mine.

I always ask my students who contend that the individual choice to obtain health insurance and health care is just that — an individual choice — if they eat out much.

Should-Read: Jacob Leibenluft: Like Other ACA Repeal Bills, Cassidy-Graham Plan Would Add Millions to Uninsured, Destabilize Individual Market

Should-Read: Jacob Leibenluft et al.: Like Other ACA Repeal Bills, Cassidy-Graham Plan Would Add Millions to Uninsured, Destabilize Individual Market: “Cassidy-Graham Block Grant and Medicaid Per Capita Cap Cut Federal Funding for Most States by 2026… https://www.cbpp.org/research/health/like-other-aca-repeal-bills-cassidy-graham-plan-would-add-millions-to-uninsured

…[Million dollars in 2026:] Alabama +1713, Alaska -255, Arizona -1600, Arkansas -1102, California -27823, Colorado -823, Connecticut -2324, Delaware -724, District of Columbia -431, Florida -2691, Georgia +1685, Hawaii -659, Idaho +177, Illinois -1420, Indiana -425, Iowa -525, Kansas +821, Kentucky -3062, Louisiana -3220, Maine -115, Maryland -2162, Massachusetts -5089, Michigan -3041, Minnesota -2747, Mississippi +1441, Missouri +545, Montana -515, Nebraska +203, Nevada -639, New Hampshire -410, New Jersey -3904, New Mexico -1350, New York -18,905, North Carolina -1099, North Dakota -211, Ohio -2512, Oklahoma 1118, Oregon -3641, Pennsylvania -850, Rhode Island -625, South Carolina +804, South Dakota +218, +Tennessee 1642, Texas +8234, Utah +313, Vermont -561, Virginia 268, Washington -3333, West Virginia -554, Wisconsin +252, Wyoming -90…

Expanding the Earned Income Tax Credit is worth exploring in the U.S. tax reform debate

Sen. Sherrod Brown, D-Ohio, co-sponsor of the GAIN Act, speaks on Capitol Hill in Washington.

In recent years, lawmakers on both sides of the congressional aisle have proposed expanding refundable tax credits for low-income workers across the United States such as the Earned Income Tax Credit, which provides them with additional earnings through the tax code. But a new proposal by Rep. Ro Khanna, D-CA, and Sen. Sherrod Brown, D-OH, hopes to go much further to make up for decades of stagnant wages.

The Grow American Income Now, or GAIN, Act proposed by Rep. Khanna and Sen. Brown would expand the Earned Income Tax Credit not only for low-wage working families with children but also for middle-income families and childless workers by increasing the income level for EITC eligibility. The EITC already is one of the country’s largest poverty-fighting cash-transfer programs—as a result of the program’s expansion in the early 1990s and then again under the American Recovery and Reinvestment Act of 2009—designed to explicitly boost the living standards of low-wage workers and families, but research shows the program could be even more successful if expanded further.

Last year, economists Hilary Hoynes and Jesse Rothstein of the University of California, Berkeley examined (open access version) how well the EITC accomplished its goals of redistribution, encouraging work, and limiting administrative costs and noncompliance. Hoynes and Rothstein argued then that policymakers could make the tax credit more progressive by expanding it for workers without children. This is one major revision that the GAIN Act has taken on board. In addition, the proposed bill would lower the qualifying age for the EITC from 25 years to 21 years, expanding eligibility to an even larger group of low-wage workers. What’s more, the GAIN Act proposes to nearly double the EITC for working families and increase the credit for childless workers almost sixfold.

As would be expected for such an ambitious proposal, it would be very expensive. The nonpartisan Tax Policy Center estimates the proposal would cost $1.4 trillion from fiscal year 2017 to fiscal year 2026. Under the proposal, the maximum tax credit available increases to $12,131 for families with three or more qualifying children; $10,783 with two qualifying children; $6,528 with one qualifying child; and $3,000 with no qualifying children. (See Figure 1.)

Figure 1

The proposed legislation also would allow for recipients to receive EITC advances capped at $500 each taxable year, which is subtracted from their total credit when they file their annual tax return. As Congress takes on tax reform in the next few months, there is sure to be talk of reforming the EITC. The GAIN Act is an interesting proposal and is worth exploring as part of tax reform to boost low- and moderate-wage workers’ earnings.

U.S. tax cuts for the rich won’t deliver gains for everyone

Speaker of the House Rep. Paul Ryan, R-Wis., left, and Senate Majority Leader Mitch McConnell, R-Ky., right, look on as President Donald Trump speaks during a meeting with Congressional leaders and administration officials on tax reform.

Distribution tables—estimates of who wins and who loses from changes in tax law—are central to any debate about tax reform. Such analyses frequently show the plans put forward by Republican politicians to be severely regressive, delivering large income gains for high-income families and little for the overwhelming majority of families. The blueprint for tax reform released by House Republicans in 2016, for example, would increase after-tax incomes for the top 1 percent of families by 13 percent in the first year after enactment but would increase incomes for the bottom 95 percent of families by less than half of 1 percent.

In response, proponents of regressive tax plans often assert—either implicitly or explicitly—that distribution analysis is flawed and fails to account for the benefits of the additional economic growth that the plans would purportedly generate. This view is mistaken. A traditional distribution analysis provides an approximation of the change in economic well-being resulting from a change in tax law. Distribution analysis is thus useful precisely to determine whether tax reform delivers gains for people across the income distribution or only for those at the top.

In the special case of revenue-neutral reform—an ostensible target for current reform efforts in Congress—distribution tables capture the primary gains from increases in economic efficiency in their estimates of changes in after-tax income. In the case of revenue-losing reform, distribution tables overstate the gains from reform, as apparent increases in after-tax incomes will ultimately need to be clawed back through offsetting tax increases or spending cuts. Only in the case of revenue-raising reform will distribution tables understate the gains. Thus, in the most likely cases for tax legislation this fall, distribution tables will either reflect or overstate the gains from any increases in economic efficiency, to the extent they exist at all.

Simply stated, invocations of growth cannot be used to wave away regressive distribution results. Reforms such as the 2016 House Republican blueprint would boost incomes for high-income families at the expense of working- and middle-class families. As Republicans in Congress and the Trump administration continue to develop a proposal for tax reform, it is worth revisiting in this column—and an accompanying issue brief—why traditional distribution tables are precisely the analytical tool they will need to determine if their tax reform plan does, in fact, deliver equitable growth.

Distribution analysis estimates the change in tax burden resulting from a change in tax law assuming no change in behavior. These estimates of the change in the tax burden can then be used to compute a range of summary statistics, including the average tax change, the percentage change in income, or the percent of families getting a tax cut or tax increase for various subgroups of the population.

Critics of distribution analysis often point to the assumption that behavior does not change when tax reform is enacted as a flaw in the analysis. Yet the assumption that behavior is unchanged provides a better approximation of the change in economic well-being resulting from a proposal than allowing behavior to change because the behavioral responses have little direct value to the people changing their behavior.

Why are the behavioral changes of little direct value to families? Because families generally do the best they can in the economic circumstances in which they find themselves; modest changes in behavior due to tax reform do not change their own well-being much at all. If the behavioral changes were to matter a great deal, then it would imply that families were knowingly making choices against their own interest—such as turning down good job offers—before tax reform.

While distribution analysis is appropriately conducted under an assumption of fixed behavior, that does not mean there are no potential economic benefits from behavioral changes that result from tax reform. Gains are possible, but they primarily manifest through their impact on the government budget. For instance, if people change their consumption patterns in response to a new limitation on an unjustified tax expenditure that finances a rate reduction, then those changes will generally improve the government’s fiscal position. This improvement in the government’s fiscal position will make it possible for legislators to provide what appears to be a net tax cut under the assumption of unchanged behavior at no cost to the government. In other words, if a revenue-neutral tax reform plan generates increases in economic efficiency, then the distribution analysis will show a net tax cut even if the cost of the tax reform to the government is zero.

It is precisely legislators’ choices about how to design a tax plan that will determine how that free-to-the-government tax cut is allocated across the income distribution. Indeed, it should not be surprising that the impact of changes in public policy are determined by legislators’ choices about how to change public policy. Recognizing that the potential gains in economic well-being for U.S. families derive from how legislators choose to distribute tax cuts made possible by improvements in the government’s fiscal position appropriately places the focus on the choices legislators make.

Focusing on growth in economic output rather than changes in well-being as measured by distribution analysis not only ignores the potential for tax reform to have different impacts across the income distribution, but also overstates the economic gains from reform by counting increased output as a benefit without accounting for the costs of generating that output. Indeed, the greater risk in the coming months is not that distribution analysis will understate the gains from tax reform, but rather that distribution analysis will overstate the gains and understate the regressivity due to its treatment of increased borrowing should policymakers turn from revenue-neutral tax reform to tax cuts.

Issue brief: If U.S. tax reform delivers equitable growth, a distribution table will show it

The Capitol is seen at dawn in Washington.

Overview

Distribution tables—estimates of who wins and who loses from changes in tax law—are central to any debate about tax reform. Such analyses frequently show the plans put forward by Republican politicians to be severely regressive, delivering large income gains for high-income families and little for the overwhelming majority of families. The blueprint for tax reform released by House Republicans in 2016, for example, would increase after-tax incomes for the top 1 percent of families by 13 percent in the first year after enactment but would increase incomes for the bottom 95 percent of families by less than half of 1 percent.1

Download File
If U.S. tax reform delivers equitable growth, a distribution table will show it

Read the full PDF in your browser

In response, proponents of regressive tax plans often assert—either implicitly or explicitly—that distribution analysis is flawed and fails to account for the benefits of the additional economic growth that the plans would purportedly generate.2 This view is mistaken. A traditional distribution analysis provides an approximation of the change in economic well-being resulting from a change in tax law. Distributional analysis is thus useful precisely to determine whether tax reform delivers gains for people across the income distribution or only for those at the top.

In the special case of revenue-neutral tax reform—an ostensible target for current reform efforts—distribution tables capture the primary gains from increases in economic efficiency in their estimates of changes in after-tax income. In the case of revenue-losing reform, distribution tables overstate the gains from reform because apparent increases in after-tax incomes will ultimately need to be clawed back through offsetting tax increases or spending cuts. Only in the case of revenue-raising reform will distribution tables understate the gains. Thus, in the most likely cases for tax legislation this fall, distribution tables will either reflect or overstate the gains from any increases in economic efficiency, to the extent they exist at all.

Simply stated, invocations of economic growth cannot be used to wave away regressive distribution results. Reforms such as the 2016 House Republican blueprint would boost incomes for high-income families at the expense of working- and middle-class families.

Focusing on changes in economic output rather than on the distribution of economic gains and losses not only ignores the potential for tax reform to have different impacts for people up and down the income ladder, but also overstates the economic gains from reform by counting increased output as a benefit without accounting for the costs of generating that output. Indeed, the greater risk in the coming months is not that distribution tables will understate the gains from tax reform, but rather that distribution tables will overstate the gains of reform and understate its regressivity if policymakers turn to tax cuts rather than tax reform and include a slate of temporary policies such as a one-time tax on overseas profits.

As Republicans in Congress and the Trump administration continue to develop a proposal for tax reform, it is worth revisiting why traditional distribution tables are precisely the analytical tool they will need to determine if their tax reform plan does, in fact, deliver equitable growth. This brief first explains why static distribution tables are informative about the improvements in economic well-being resulting from revenue-neutral tax reform. It then identifies three reasons that distribution tables may overstate the gains from reforms. Specifically:

  • Distribution tables typically do not impose budget balance on the policy changes they assess, which means that in the case of deficit-financed tax cuts, a distribution table will show gains attributable to increased borrowing even though that borrowing must ultimately be financed with spending cuts or tax increases that would make families worse off.
  • Timing gimmicks can affect distribution tables just as they can affect revenue estimates. A one-time tax on the repatriation of overseas corporate profits, for example, could reduce the apparent regressivity of a tax cut if distribution tables are estimated only (or primarily) for years in which the temporary policies are in effect.
  • If tax reform increases the federal budget deficit, then traditional approaches to measuring the incidence of certain reforms may be invalid.

Despite these limitations, distributional analysis will be critical in understanding the potential gains of any tax reform plan put forward by congressional Republicans and the Trump administration in the coming months. An understanding of what distribution analysis does and does not measure will be essential for policymakers and the public.

Distribution tables reflect the economic gains from revenue-neutral tax reform

To estimate the approximate change in economic well-being from a change in tax law, a static distribution table computes the change in tax burden assuming no change in behavior. The distribution tables produced by the Tax Policy Center and the U.S. Treasury’s Office of Tax Analysis are of this type.3 Assuming unchanged behavior provides a better approximation to the change in economic well-being resulting from a proposal than allowing behavior to change because the behavioral responses have little direct value to the people changing their behavior.4

This perhaps counterintuitive conclusion arises from the analytical assumption that people are always doing the best that they can in the economic circumstances they face. From this assumption, it follows that people equate the gains from small changes in behavior to the costs of those changes in making choices about work, consumption, and savings. If they did not do so, then there would be a small change in behavior that made them better off.

As a concrete example, consider workers earning $20 an hour, working 40 hours per week, and facing a 25 percent tax rate. Under current law, the workers’ after-tax wage is $15 per hour. The maintained assumption is that the workers could choose to increase or decrease their hours slightly at this wage rate if they wished to do so. As they choose not to, then the value to the workers of that additional $15 is roughly equal to the costs of working more such as increased commuting costs, childcare, or less time for household chores. If the cost of working that additional hour exceeded $15, then reducing hours would make them better off. If the cost were less than $15, then increasing hours would make them better off.

If the tax rate for these workers is reduced to 20 percent and the workers decide to pick up an additional two hours per week, then the net value of those hours to them is not the full $32 in additional take-home pay from working more, but rather only about $1. The reason: At the new, higher number of hours worked, the cost of working longer is roughly $16, again equal to the take-home pay. The total cost of work for those two hours would be roughly $31, or about $15 for the first hour and $16 for the second, leaving our hypothetical workers with only an extra dollar to show for the effort.

Notably, the change in well-being resulting from the behavioral response of these workers to a 5 percentage point reduction in the tax rate is far smaller than both the direct impact of the tax cut ($40 in reduced income taxes) and the impact of the change in behavior on government revenues ($8 in new revenue resulting from the increased working hours: 20 percent of the $40 in additional gross pay).

The economic logic of this simplified example generalizes to other choices about work, consumption, and savings. For a small change in tax rates, changes in behavior provide essentially no direct benefits. For a larger tax change, the value of the change in behavior would tend to be small relative to the other effects of the proposal. Note, however, that the conclusion that a family is approximately indifferent to changes in behavior applies only to changes in behavior under its control and only for those decisions where the family is unconstrained in its choices. In more complex models, the relevant assumptions could fail in other ways such as through informational imperfections.

The above analysis treats the conclusion that changes in behavior provide little direct benefit as a justification for static distribution tables, but an alternative and likely preferable mode of analysis would be to determine the types of behavior that should be held fixed in a distribution table as precisely those for which small changes leave families indifferent. Changes in behavior that do not satisfy this property should be included, though the details of doing so can be complex. In fact, implicitly, static distribution tables typically allow at least one form of behavioral response: a switch from claiming the standard deduction to itemizing (or the reverse). One justification for including such changes is that they are essentially costless and thus there is no offsetting cost to the gains delivered by making such a change.

The assumption of no (or extremely limited) changes in behavior used in a static distribution table differs from the behavioral assumptions used in both a conventional revenue estimate and a dynamic revenue estimate. A conventional revenue estimate allows for microeconomic behavioral responses—responses that do not change macroeconomic aggregates such as labor hours or the capital stock. For instance, a decrease in the use of an itemized deduction in response to a limitation on that deduction would be a microeconomic behavioral response. A dynamic revenue estimate allows for microeconomic behavioral responses and changes in macroeconomic aggregates. Because the behavioral assumptions underlying a static distribution table and a revenue estimate are not the same, the aggregate tax change shown in a distribution table will not necessarily match the revenue estimate under either conventional scoring or dynamic scoring.

This gap between the revenue estimate for a proposal and the implied aggregate change in tax liability per the distribution table captures the primary economic gains from a proposal. If tax reform delivers positive revenue feedback—whether through microeconomic behavioral responses included in a conventional score or macroeconomic behavioral responses included in a dynamic score—then the revenue cost of the proposal will be smaller than the tax cut implicit in the distribution tables. An efficiency-enhancing tax reform that is revenue neutral including dynamic feedback would thus show a tax cut in the distribution table at no revenue cost to the government. That free-to-the-government tax cut reflects the primary economic benefits of the reform.

Consider a second example. Suppose a person making $50,000 and facing a tax rate of 25 percent can deduct from income certain expenses equal to $10,000. The government then replaces the deduction with a 20 percent tax credit and provides a $900 tax credit instead. The individual responds by reducing spending on the deductible expenses to $8,000. The government collects the same amount of revenue under this reform as it would under current law. In other words, the revenue estimate is zero.

Moreover, because the amount of the deductible expense was chosen freely prior to the reform, the person was roughly indifferent between an additional dollar of the deductible expense and nondeductible expenses. This will remain approximately the case after the reform, and thus the person realizes only a very modest gain from the behavioral change. Importantly, however, the new tax credit is worth $900 and the limitation on the deduction costs only $500 (before the reduction in such spending), which means the distribution table would show a net tax cut of $400 that was provided at no net cost to the government.

In other words, if policymakers can deliver tax reform with real economic benefits that is revenue neutral on a dynamic basis, then an appropriately constructed distribution table for that tax reform would show a net tax cut. And if the tax reform delivers equitable growth in living standards, then the table will show robust increases in well-being for working- and middle-class families, as well as high-income families.

The validity of the static distribution as a measure of the change in economic well-being also highlights the role of government policy in determining the way the economic gains from tax reform are translated into increases in well-being for families up and down the wealth and income ladders. As the behavioral changes resulting from tax reform are of relatively little direct value to families and the broader efficiency gains generally arise from the impact of reform on the government budget, it is government policy that determines how those gains are allocated. Notably, since the behavioral changes are of relatively little direct value to families, if the static tax cuts are concentrated among high-income families, then growth will not change that fact.

Of course, static distribution tables remain an approximation to the change in economic well-being, and there is plenty to debate about their construction. The quality of the approximation declines as the rate change gets larger, though for a revenue-neutral reform, the overall rate change should be small. A higher-quality approximation would show slightly higher benefits of efficiency-enhancing reform.5 Many of the assumptions underlying a distribution table and the associated revenue estimates are uncertain such as the responsiveness of labor supply to tax changes and the allocation of the incidence of the corporate income tax to labor and capital. Changes in wage rates and investment returns resulting from behavioral responses can affect the results. Distribution tables do not capture the benefits or costs of simplification proposals, though these are typically modest. Interactions between federal and state revenue streams often receive insufficient attention in federal policymaking.

There is much to debate about the details of distribution tables, but their importance in assessing changes in economic well-being is clear. Static distribution tables provide a reasonable approximation to the change in economic well-being across the income distribution, and economic growth does not. If revenue-neutral tax reform delivers equitable growth, then a static distribution table will show it.

Distribution tables are more likely to overstate the gains of reform

The greater analytic risk in the coming months is not that distribution tables will understate the gains from reform, but rather that they will overstate the gains from reform and understate its regressivity.

First, as noted above, distribution tables typically do not impose budget balance on the policy changes they assess. In the case of deficit-financed tax cuts, a distribution table will thus show gains attributable to increased borrowing even though that borrowing must ultimately be financed with spending cuts or tax increases. Incorporating those offsetting fiscal policies into the analysis would reduce the apparent gains in the distribution table. In fact, the primary scenario in which static distribution tables understate the gains from tax reform is one in which Congress enacts tax reform that is revenue neutral on a conventional basis and uses the economic gains to reduce the deficit and debt. In this case, the distribution table would show a near-zero change in well-being even though gains have been realized.

Second, timing gimmicks can affect distribution tables just as they can affect revenue estimates. A time-limited policy such as a one-time tax on the repatriation of overseas corporate profits could reduce the apparent regressivity of a tax cut if distribution tables are estimated only or primarily for years in which the temporary policies are in effect. More broadly, practical considerations make the construction of distribution tables on a present-value basis difficult, but there would be substantial analytic value to such an exercise. In the absence of a present-value analysis, caution is required in interpreting distribution tables for policies that differ substantially across years or for which a substantial adjustment period is likely.

Third, if tax reform increases the federal budget deficit, then traditional approaches to measuring tax incidence may be invalid. Distribution tables, for example, typically assign a portion of the incidence of a corporate tax cut to labor and a portion to capital. Most analysts assume a partial pass-through to labor based on anticipated changes in the capital stock. But the capital stock will change only over time, and whether it will grow—and whether that growth will be sustained—depends on whether increased federal budget deficits drive up interest rates and discourage private-sector activity. Thus, deficit financing not only can reverse short-run gains from a proposal and ultimately harm growth, but can also result in misleading distribution estimates that assume labor benefits from capital deepening even as the proposal reduces the capital stock.

Must- and Should-Reads: September 21, 2017


Interesting Reads: