Weekend reading: “labor share of income” edition

This is a weekly post we publish on Fridays with links to articles that touch on economic inequality and growth. The first section is a round-up of what Equitable Growth published this week and the second is the work we’re highlighting from elsewhere. We won’t be the first to share these articles, but we hope by taking a look back at the whole week, we can put them in context.

Equitable Growth round-up

Why hasn’t the Federal Reserve tried overshooting inflation or economic growth? Nick Bunker considers whether the hesitancy lies with the central bank’s target or believes about how quickly inflation might rise.

“Labor’s share of income” refers to the share of national economic output that workers get as compensation in exchange for their labor. It began to decline in the United States around the turn of the 21st Century and similar trends have been observed in multiple other countries, but we still don’t conclusively know why. One potential explanation comes from Princeton University economist and Equitable Growth-grantee Ezra Oberfield, who, in a recent submission to Equitable Growth’s Working Paper Series, argues that the decline in labor’s share of income could in fact be due to the slowdown in productivity growth that has also been observed in recent decades.

In a new column cross-posted from VoxEU, Oberfield and his co-authors break down their paper’s analysis and key findings.

The U.S. Bureau of Labor Statistics released its latest U.S. labor market report for February this morning. Check out five key graphs from the new data compiled by Equitable Growth staff.

Links from around the web

Women’s participation in the labor force is enabled by care work, which is one of the lowest paid sectors in the U.S. economy and continues to be disproportionately provided by women of color. And care workers need to be able to spend time with their own families, too. These are all things that advocates for paid leave need to take into consideration when designing policy to ensure that everyone is able to take advantage and benefit from paid leave. [slate]

In a new bill introduced this week, Senator Cory Booker (D-NJ) aims to ensure that workers share in the benefits when their companies do share buybacks. [vox]

Why are state tax dollars subsidizing corporations? University of Texas-Austin professor and Equitable Growth-grantee Nathan Jensen asks this question in an op-ed in The New York Times. [nyt]

Read more about Jensen’s work on government subsidies for economic development, including in his working paper on the subject for the Equitable Growth Working Paper Series.

Research into the effects of cash transfer programs in other countries finds that giving poor families money improves children’s chances of success later in life across a range of measures, including working more hours per week as adults than similarly poor children whose families didn’t receive the cash. [the atlantic]

In an op-ed for the The New York Times, Columbia University professor Alexander Hertel-Fernandez and Brookings fellow Vanessa Williamson—both Equitable Growth grantees—explain the results of their new research into the impact of “right to work” laws on voter turnout and election results.

The Great Recession revealed the connection between household debt and the business cycle. Economists Atif Mian of Princeton University and Amir Sufi of the University of Chicago—both Equitable Growth grantees—explain how expansions in credit supply interact with household demand to drive the business cycle and the implications of this for the relationship between inequality and the economy. [project syndicate]

You can also read more about Mian and Sufi’s working paper on the subject in this Value Added post by Equitable Growth’s Nick Bunker.

Friday figure

In honor of International Women’s Day, which was March 8:

Figure is from Equitable Growth’s, “Is the cost of childcare driving women out of the U.S. workforce?

Should-Read: Elise Gould: Strong employment growth and promising participation, but wage growth continues to fall short

Should-Read: Elise Gould: Strong employment growth and promising participation, but wage growth continues to fall short: The economy added a strong 313,000 jobs in February….

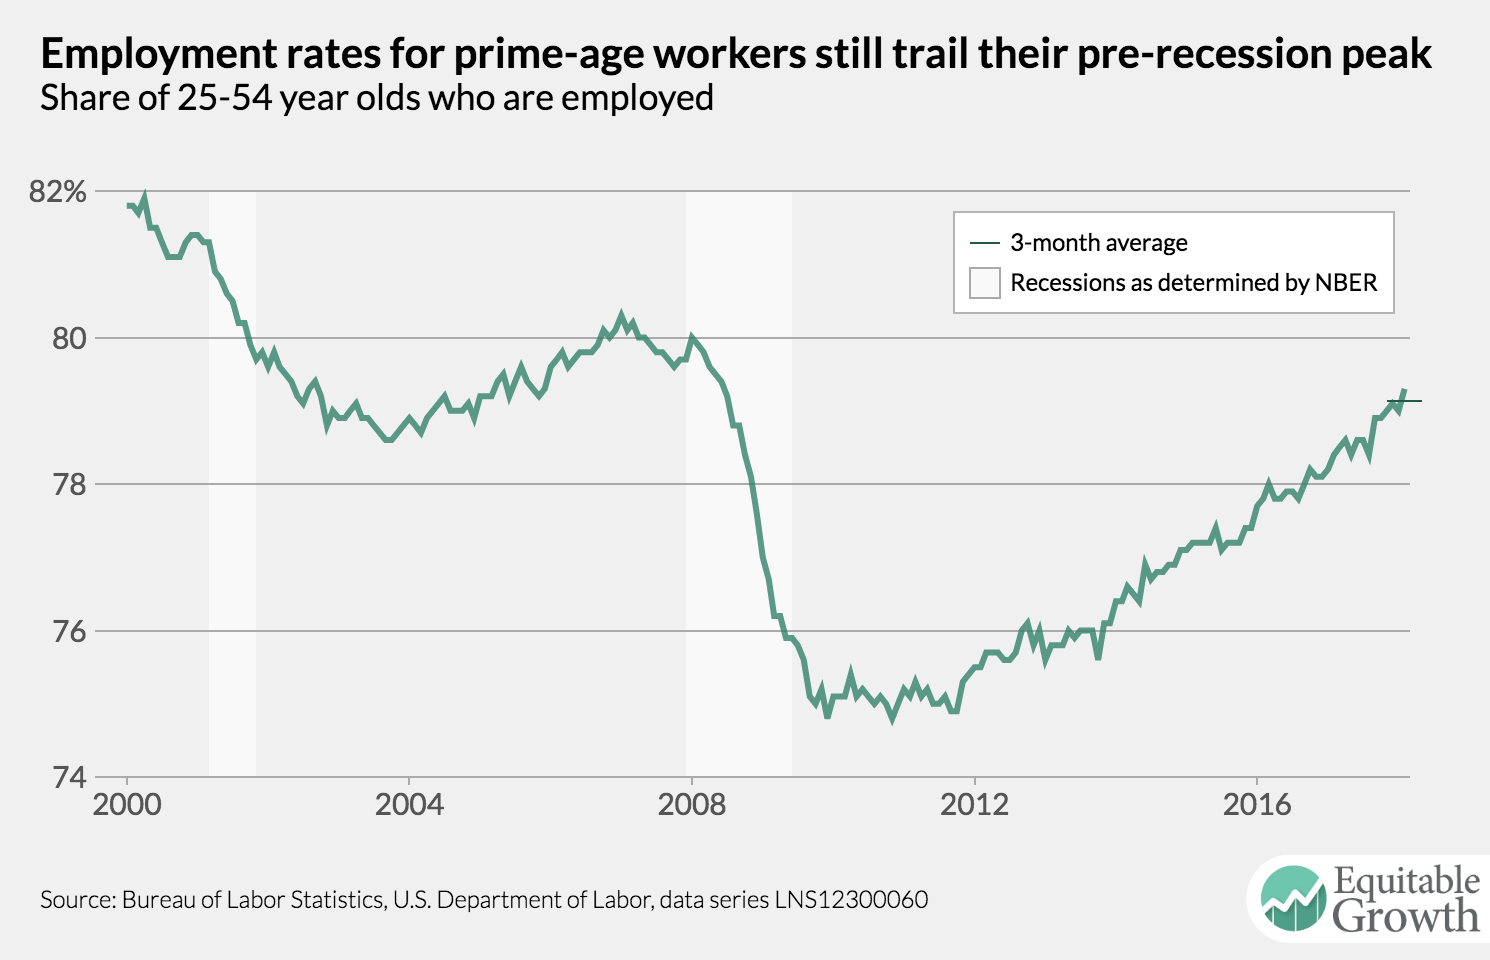
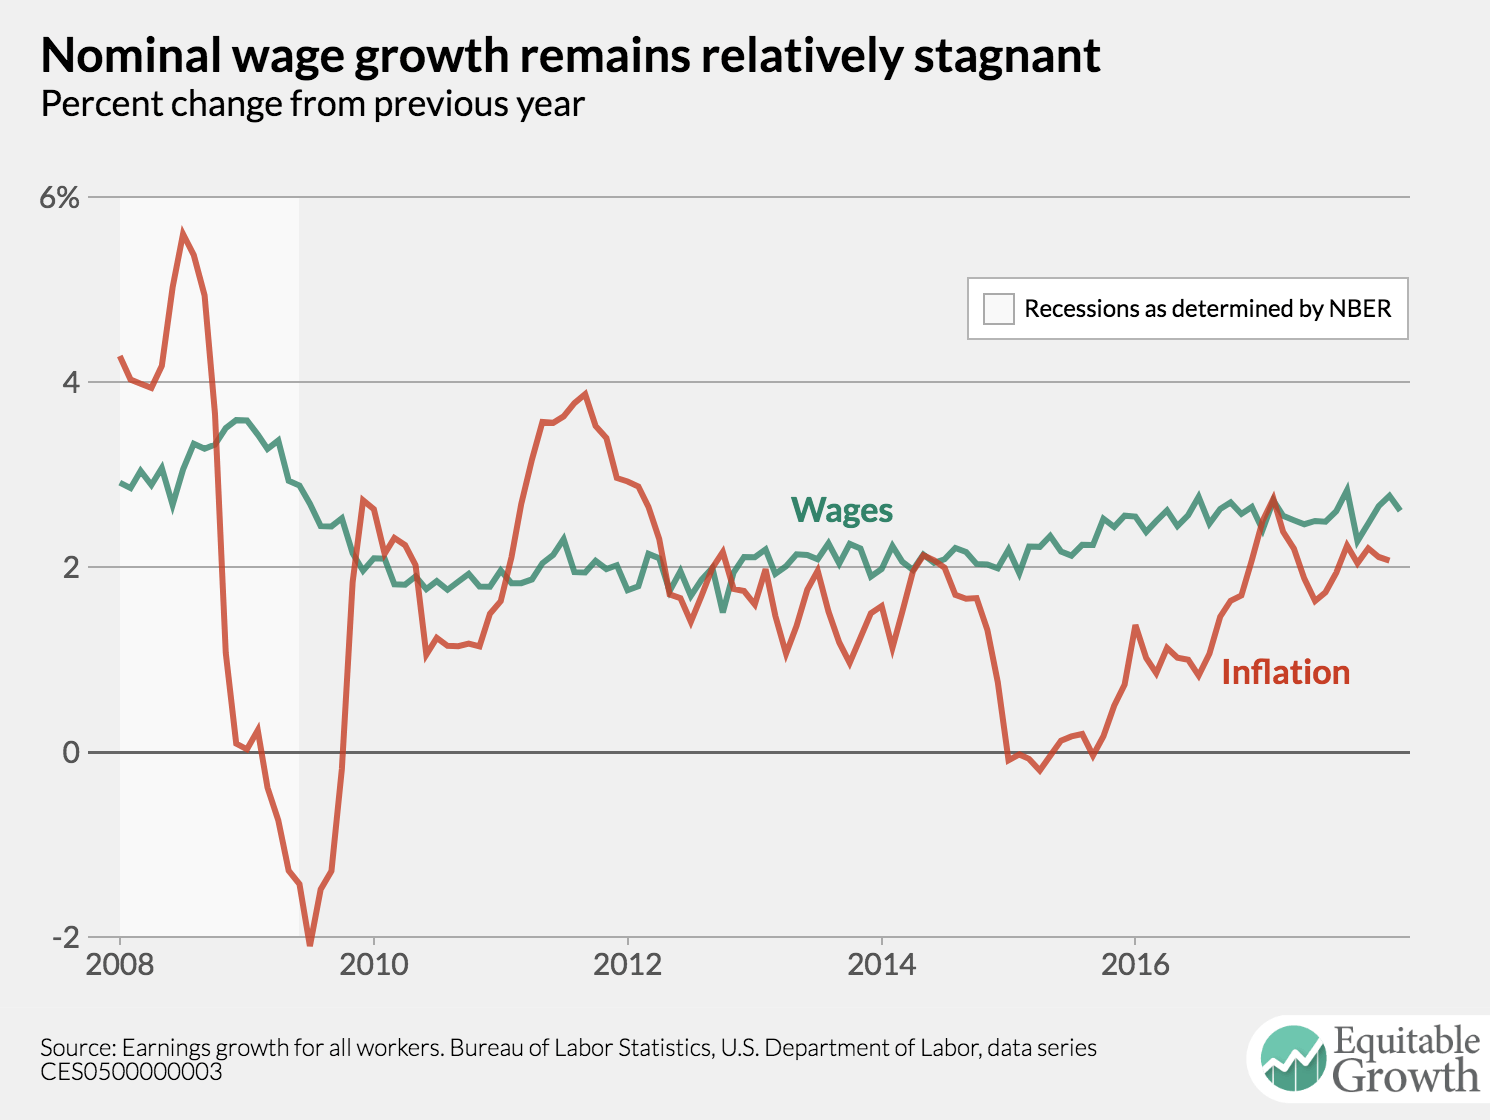
…The unemployment rate held steady at 4.1 percent, while the labor force participation rate (LFPR) and the employment-to-population ratio (EPOP) saw sizeable gains, 0.3 percentage points each, restoring them to levels last seen in September 2017. At 79.3 percent, prime-age EPOP, meanwhile, is the highest it’s been since June 2008…. Despite these impressive gains in employment and participation… nominal hourly wage growth remains relatively disappointing at 2.6 percent year-over-year, so we clearly have a ways to go before reaching the 3.5 percent wage growth—at a minimum—that would be consistent with the Fed’s inflation target and estimates of potential productivity growth…

Equitable Growth’s Jobs Day Graphs: February 2018 Report Edition

Earlier this morning, the U.S. Bureau of Labor Statistics released new data on the U.S. labor market during the month of February. Below are five graphs compiled by Equitable Growth staff highlighting important trends in the data.

1.

The prime employment rate hit a new high for this expansion at 79.3 percent. However, that’s still below levels seen before the 2007-2009 Great Recession and the 2001 recession.

a

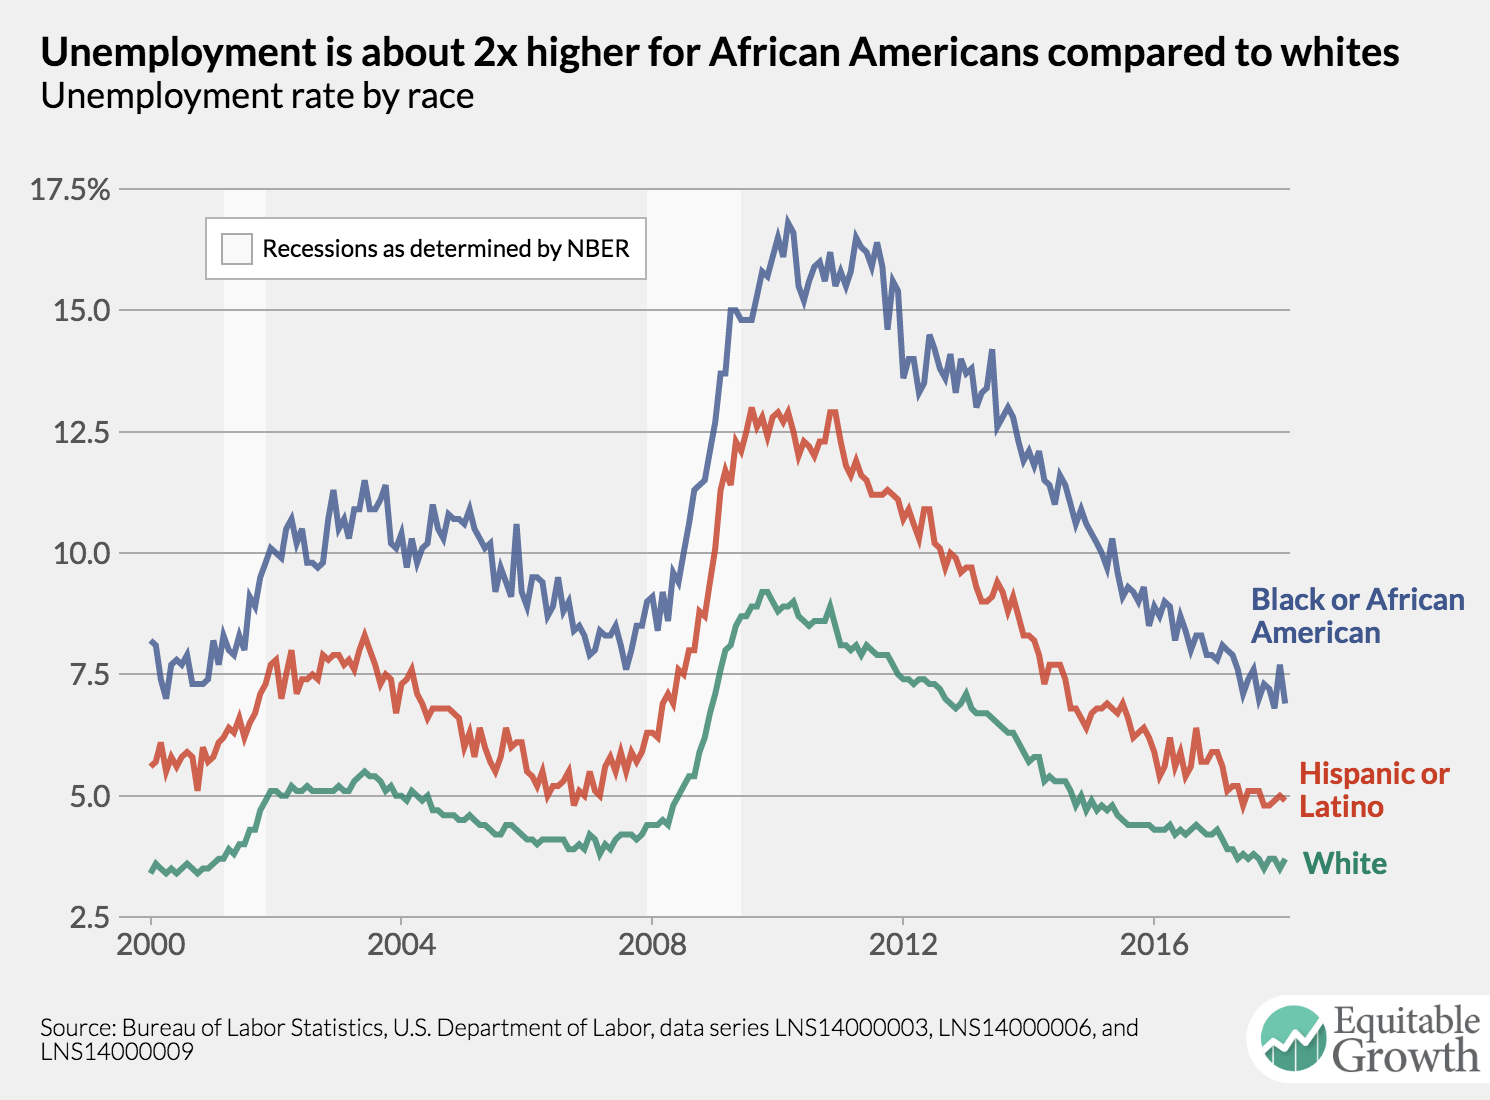
2.

After a big spike last month, the black unemployment rate fell to 6.8 percent in February, near it’s all-time low. But it’s still close to twice as high as the white unemployment rate.

3.

Wage growth for all workers fell back to Earth in February to 2.6 percent after a jump to 2.9% in the previous report. Nominal wage growth remains tepid.

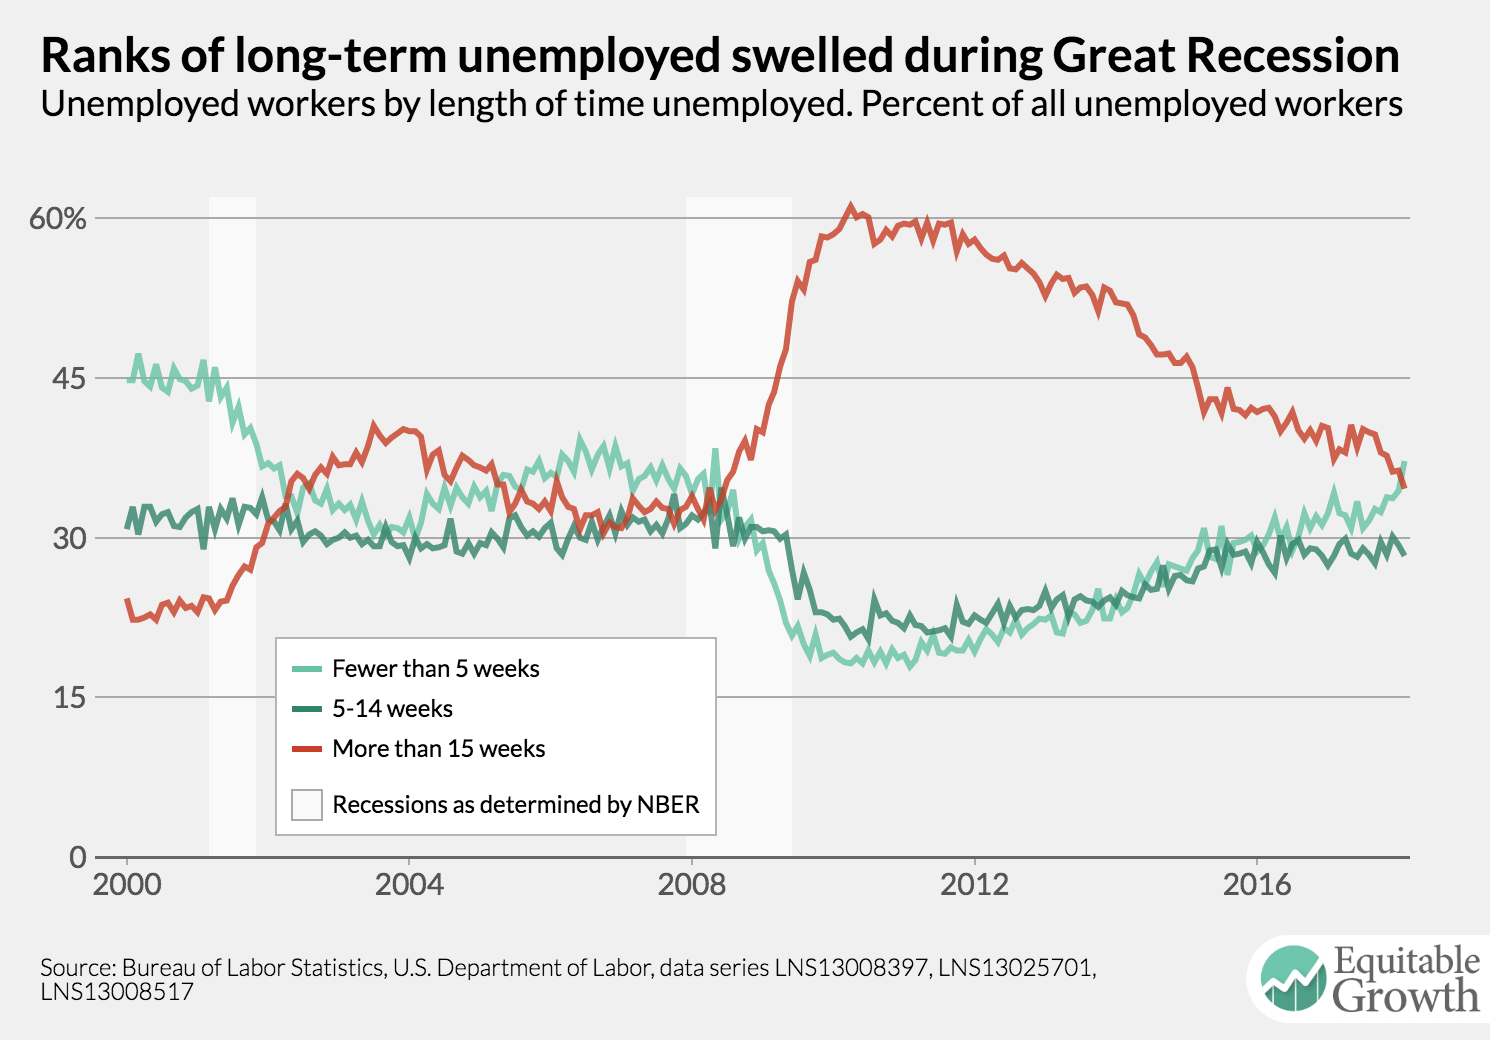
4.

The share of unemployed workers unemployed for fewer than 5 weeks is now larger than the share who are long-term unemployed.

5.

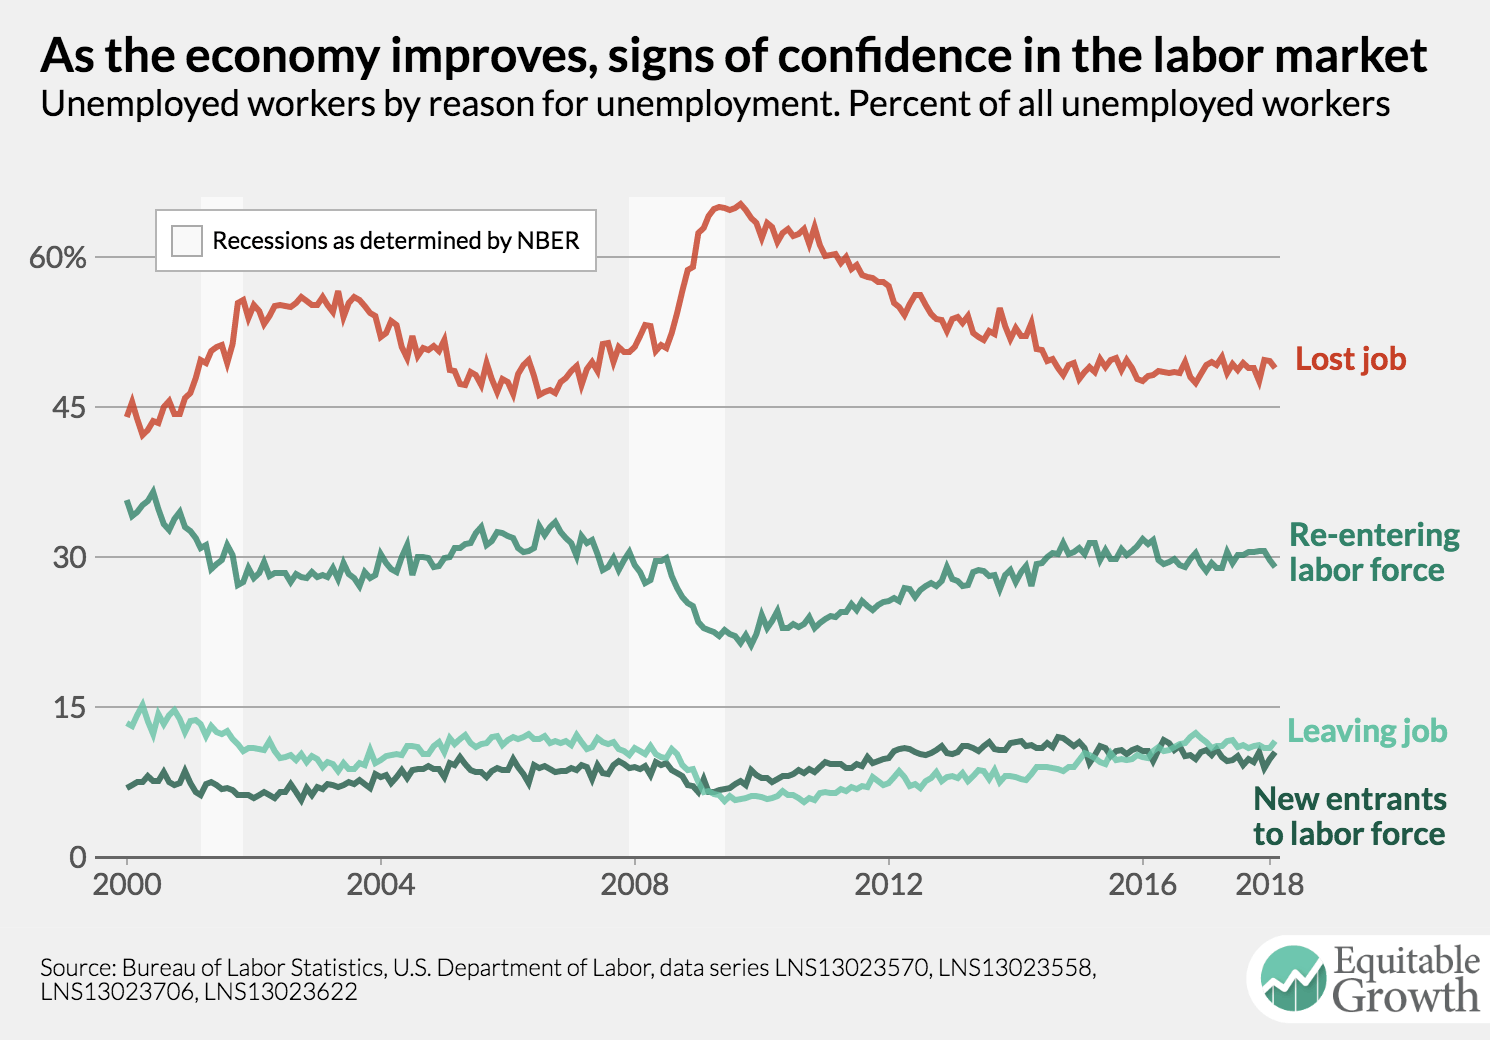
As growth appears to pull workers into the labor force, keep an eye on changes in unemployment due to workers re-entering the labor force or new entrants.

The productivity slowdown and labor’s income share

Many countries have experienced both a slowdown in aggregate productivity growth and a decline in labor’s share of national income in recent years. This column argues that the productivity slowdown may have caused the decline in labor’s income. Calibrating the authors’ model to US data suggests that a one percentage point decline in the productivity growth rate accounts for between half and all of the observed decline in the US labor share.

(Editors’ note: This column first appeared on the VoxEU website. Reproduced with permission.)

In recent years, many countries, including the US, have experienced both a slowdown in aggregate productivity growth and a decline in labour’s share of national income (Elsby  et al. 2013, Fernald 2014, Karabarbounis and Neiman 2014). The existence, timing, and magnitude of these changes is the subject of an ongoing and important empirical debate. However, beginning by at least 2000, and probably earlier, the US labour share seems to have fallen by five or six percentage points. Meanwhile, Gordon (2010, 2012, 2016) argues that annual total factor productivity growth in the US has been one percentage point slower since the 1970s compared to the preceding decades.

Suggested explanations for the decline in labour’s income share include capital accumulation (Karabarbounis and Neiman 2014, Piketty 2014), automation of tasks previously performed by labour (Acemoglu and Restrepo 2016) and the rise of superstar firms (Autor et al. 2017, Kehrig and Vincent 2017). In a recent paper, we propose a new explanation – the productivity slowdown may have caused the decline in labour’s income share (Grossman et al. 2017a). We show that in a neoclassical growth model with endogenous human capital (Ben Porath 1967) and capital-skill complementarity (Grossman et al. 2017b), the labour share is increasing in the rate of technical change. Calibrating our model to US data implies that a one percentage point decline in the productivity growth rate can account for between one half and all of the observed decline in the US labour share.

A theory of labour’s income share

To understand the determinants of labour’s share of income, we extend the neoclassical growth model by allowing for endogenous human capital accumulation. Each individual’s output depends not only on their labour supply and how much capital they work with, but also on their human capital. Individuals accumulate human capital through schooling and divide their time between working and learning in order to maximise expected lifetime income (Ben Porath 1967).

Consistent with empirical evidence, we also assume the production technology features complementarity between physical and human capital, an elasticity of substitution between physical capital and raw labour less than one, and exogenous technical change that takes both capital-augmenting and labour-augmenting forms. As in Grossman et al. (2017b), we model capital-skill complementarity by assuming that human capital is akin to capital-using technical progress.

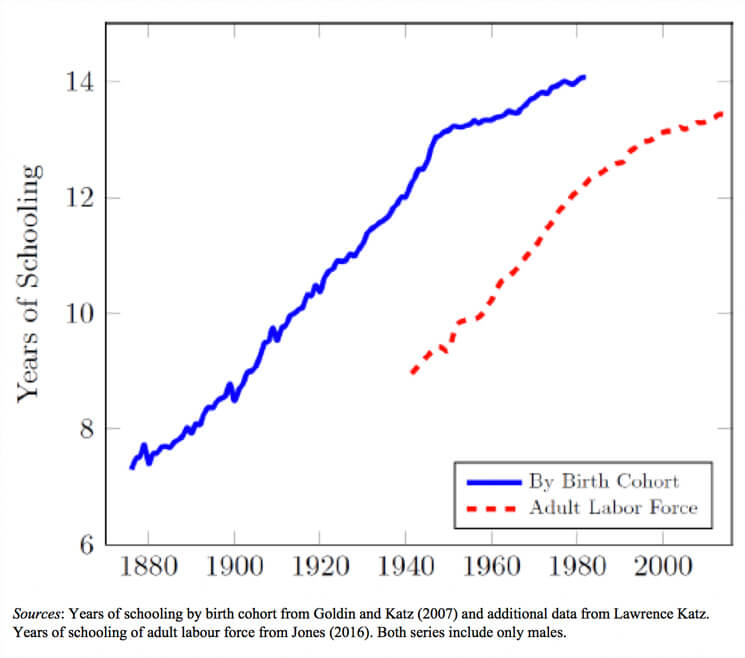
In this setting, capital accumulation raises labour’s income share, holding the supply of skill constant, because the elasticity of substitution is below one. However, as the capital stock grows, the existence of capital-skill complementarity means that workers choose to accumulate more human capital and this effect tends to reduce labour’s income share. For a class of production functions identified in Grossman et al. (2017b), these effects exactly offset one another and the economy has a unique balanced growth path along which labour’s income share is constant. On the balanced growth path, educational attainment rises steadily over time, in keeping with the US experience for much of the 20th century (Figure 1).

Figure 1 US education by birth cohort and among adult labour force
The main outcome of interest is labour’s steady state income share. In the empirically relevant case where the intertemporal elasticity of substitution is less than one, we find that a decline in the rate of either capital-augmenting or labour-augmenting technical progress reduces labour’s income share. Thus, a productivity slowdown induces a decline in the labour share. The mechanism operates through optimal schooling choices. Slower growth reduces the real interest rate, leading individuals to raise their targeted human capital for any given level of the effective capital stock. Since skills are capital-using, this change is equivalent to a reduction in the capital-labour ratio, which redistributes national income toward capital when the elasticity of substitution between capital and labour is less than one.

A productivity slowdown also reduces the rate at which educational attainment increases, but only if it results from a decline in capital-augmenting (not labour-augmenting) technical progress. Figure 1 shows that the increase in schooling in the US slowed for cohorts born after around 1950.

To understand the novelty of these findings, we can compare our results with the canonical neoclassical theory of the functional distribution of income dating back to Hicks (1932) and Robinson (1933). In the canonical approach, where aggregate output is a constant returns to scale function of capital and labour, variation in the labour share results from changes in the capital-labour ratio or in the bias of factor augmenting technologies. If the capital-labour elasticity of substitution is below one, as most empirical evidence suggests (Oberfield and Raval 2014), either an increase in the capital-labour ratio or an improvement in the capital-augmenting technology would raise the labour share.

By contrast, according to our model it is not the levels of technology parameters that determine the labour share, but the rate of technical progress. Moreover, the factor bias of technical progress does not play a critical role in our story. Both a fall in the rate of labour-augmenting technical change and a fall in the rate of capital-augmenting technical change cause a decline in the steady state labour share, because both have qualitatively similar effects on targeted human capital levels.

Quantifying the consequences of a productivity slowdown

How large is the change in labour’s income share resulting from a slowdown in productivity growth? We address this question by calibrating our model to the postwar US economy and simulating a reduction in technical progress that results in a one percentage point per year fall in labour productivity growth. All but one of the parameters can be pinned down using standard data moments such as the capital share, the internal rate of return on schooling, and the growth of labour productivity and years of schooling prior to the shock.

The remaining parameter controls the degree of capital-skill complementarity. To calibrate this parameter, we try two approaches. First, we make ad-hoc assumptions about the bias of technical change. Second, we estimate the parameter structurally using variation in labour shares and average wage growth rates across US states and industries. In all the cases we consider, a one percentage point decline in the labour productivity growth rate reduces labour’s income share by at least 1.5 percentage points. For our preferred specification, the labour share declines by 4.6 percentage points if the slowdown results from lower labour-augmenting technical progress and 5.9 percentage points if slower growth in capital-augmenting technology is responsible.

Conclusions

Our work identifies a new mechanism behind changes in labour’s income share. Moreover, calibrating the model shows that the recent productivity slowdown may be quantitatively important in explaining the redistribution of income from labour to capital.

To conclude, we mention two additional attractive features of our story. First, it does not rely on factors that are specific to the US experience, but instead is consistent with evidence of a global productivity slowdown and a decline in the labour share worldwide. Second, although we focus on recent trends in productivity and the labour share, there is some evidence that similar correlations hold over much longer time periods (Growiec et al. 2016). It is possible that productivity growth and the functional distribution of income have been linked for quite some time.

References

Acemoglu, D and P Restrepo (2016), “The Race between Machine and Man: Implications of Technology for Growth, Factor Shares, and Employment”, NBER Working Paper No. 22252.

Autor, D, D Dorn, L Katz, C Patterson and J Van Reenen (2017), “The Fall of the Labor Share and the Rise of Superstar Firms”, mimeo MIT.

Ben Porath, Y (1967), “The Production of Human Capital and the Life Cycle of Earnings”, Journal of Political Economy 75(4, Pt. I): 352-65.

Elsby, M W L, B Hobijn and A Sahin (2013), “The Decline of the U.S. Labor Share”, Brookings Papers on Economic Activity 47(2): 1-63.

Fernald, J G (2014), “Productivity and Potential Output Before, During, and After the Great Recession”, Federal Reserve Bank of San Francisco Working Paper 2014-15.

Goldin, C and L F Katz (2007), “Long-Run Changes in the Wage Structure: Narrowing, Widening, and Polarization”, Brookings Papers on Economic Activity 38(2): 135-68.

Gordon, R J (2010), “Revisiting U.S. Productivity Growth over the Past Century with a View of the Future”, NBER Working Paper No. 15834.

Gordon, R J (2012), “Is U.S. Growth Over? Faltering Innovation and the Six Headwinds”, NBER Working Paper No. 18315.

Gordon, R J (2016), The Rise and Fall of American Growth: The U.S. Standard of Living Since the Civil War, Princeton: Princeton University Press.

Grossman, G M, E Helpman, E Oberfield and T Sampson (2017a), “The Productivity Slowdown and the Declining Labor Share: A Neoclassical Exploration”, CEPR Discussion Paper 12342.

Grossman, G M, E Helpman, E Oberfield and T Sampson (2017b), “Balanced Growth despite Uzawa”, American Economic Review 107(4): 1293-1312.

Growiec, J, J Muck and P McAdam (2016), “Endogenous Labor Share Cycles: Theory and Evidence”, SGH KAE Working Paper No. 2016/0015.

Hicks, J R (1932), The Theory of Wages, London: Macmillan.

Jones, C I (2016), “The Facts of Economic Growth”, in J B Taylor and H Uhlig (eds), Handbook of Macroeconomics, vol 2A, Amsterdam: Elsevier.

Karabarbounis, L and B Neiman (2014), “The Global Decline of the Labor Share”, Quarterly Journal of Economics 129(1): 61-103.

Kehrig, M and N Vincent (2017), “Growing Productivity without Growing Wages: The Micro-Level Anatomy of the Aggregate Labor Share”, Economic Research Initiatives at Duke Working Paper No. 244.

Oberfield, E and D Raval (2014), “Micro Data and Macro Technology”, NBER Working Paper No. 20452.

Piketty, T (2014), Capital in the Twenty-First Century, Cambridge, MA: Harvard University Press.

Robinson, J (1933), The Economics of Imperfect Competition, London: Macmillan.


Should-Read: Teddy Roosevelt (1907): Address on the occasion of the laying of the corner stone of the Pilgrim memorial monument

Should-Read: Back in the days when a Republican president would blame an economic depression on his own biggest contributors: Teddy Roosevelt (1907): Address on the occasion of the laying of the corner stone of the Pilgrim memorial monument: “It may well be that the determination of the Government (in which, gentlemen, it will not waver), to punish certain malefactors of great wealth…

…has been responsible for something of the trouble ; at least to the extent of having caused these men to combine to bring about as much financial stress as possible, in order to discredit the policy of the Government…

What would lead to monetary overshooting by the Fed?

After years of dormancy, inflation in the U.S. economy just might be heading upward. The Federal Reserve’s preferred measure of inflation-the personal consumption expenditures price index-is still growing below the central bank’s 2 percent inflation target, but recent data might indicate the beginning of an uptick. Over the past year the so-called core inflation measure of that index (minus food and energy prices) has grown 1.5 percent, but over the past three months it rose at a 1.9 percent annualized rate. But if inflation has yet to hit the target consistently, why has the central bank been raising interest rates? It may have to do with a perhaps undue fear of overshooting that target.

Overshooting is way of ensuring that the Fed has provided enough economic stimulus (by injecting more money into the economy) or seen enough economic stimulus provided by fiscal policymakers (by spending money or reducing taxes) so that the economy is firing on all cylinders. If inflation were slightly above the Fed’s target, then it seems quite likely that the labor market would be at or perhaps slightly above full employment consistent with its 2 percent inflation target. Similarly, overshooting inflation would be a signal that other resources in the economy are operating a bit above capacity as the actual output of the economy would be above the “potential output” of the economy.

In short, overshooting the Fed’s inflation target is akin to a long-distance runner who sprints through the finish line-ensuring the race closes at as fast a pace as possible.

So, how could the Fed institute monetary policy that embraces overshooting? One argument is that the Federal Open Markets Committee, the policy arm of the Federal Reserve, could adopt a monetary policy target that incorporates overshooting. So-called level targets such as a price level target or a nominal Gross Domestic Product level target would require overshooting the target rate of inflation or nominal GDP growth (before accounting for inflation) in order to make up for slower growth experienced since the end of the Great Recession.

But perhaps a new target alone wouldn’t be enough. At an event last week hosted by the Hamilton Project, Neel Kashkari, president of the Federal Reserve Bank of Minneapolis, argued that a strong belief in a “nonlinear relationship” between unemployment and inflation among many monetary policymakers is why the Fed has hiked interest rate hikes when the rate of inflation was still below target. A nonlinear relationship means that as the unemployment rate declines with unemployment already low, inflation would increase much quicker than it would amid a similar decline in unemployment when unemployment is high. To make up an example, a 0.1 percentage point decline in the unemployment rate would boost inflation by 0.3 percentage points when unemployment is at 4 percent, but the same decline in unemployment would only lead to a 0.15 percentage point increase in inflation when unemployment is 6 percent.

If there is a nonlinear relationship, then credibly overshooting an inflation target might be difficult because inflation would be hard to control with the labor market and the overall economy already running fairly tight. Yet the economic experience of the past several years suggests that instead there is a linear relationship between the unemployment rate and the inflation rate, and that the relationship is quite weak. Overshooting, it would seem, could be quite manageable.

But if most U.S. monetary policymakers believe in a nonlinear relationship, then overshooting won’t happen, and a move to a level target would be difficult. That means a move toward overshooting would require a rethink of the relationship between slack in the economy and inflation within the Federal Open Markets Committee, either by changing minds or changing members.

Should-Read: Yascha Mounk: Why so many Westerners feel like democracy has failed them

Should-Read: I never understand why people say things like “we’ve never managed to transform countries that thought of themselves as being monoethnic and monocultural into multiethnic ones”. An awful lot of America’s “white” people today look exactly like the people the Know-Nothings were trying to keep out. “White”—i.e., not Black—became the multiethnicity umbrella term (for everybody who wasn’t Black): Yascha Mounk: Why so many Westerners feel like democracy has failed them: “People no longer feel that the political system is actually delivering for them…

…The stagnation of living standards for ordinary people. From 1935 to 1960, the living standard of the average American doubled…. But living standards haven’t gone up in decades, and now they’re just saying, “Let’s throw some shit against the wall and see what sticks.” A lot of this discontent is driven by economic concerns, but the form it takes is cultural or racial. We have to recognize that we’re in the middle of a unique historical experiment: We’ve never managed to transform countries that thought of themselves as being monoethnic and monocultural into multiethnic ones, which is what’s happening in Europe and, to a lesser degree, in the United States. Some of these countries were always multiethnic, but they also had a clear racial hierarchy in which some people had advantages over others. Overturning all that is desirable, but it’s also politically difficult. We’re in the middle of a giant fight. A lot of people are rightly saying, “We need to live up our ideals,” but a bunch of people feel they have something lose because of it…

Should-Read: Ann Marie Marciarille: What older people should know about Medicare and Medicaid

Should-Read: Ann Marie Marciarille: What older people should know about Medicare and Medicaid: “Not unlike both the 111th Congress that passed the Affordable Care Act and the 115th Congress that recently amended it with the new federal tax bill, we are often in the dark about our own health care and health insurance systems…

…Whether you think this is a matter of being in good company or a national embarrassment, I can think of no problem greater among our citizenry than health insurance illiteracy in general, and about Medicare and Medicaid, in particular. Many of us, for example, learn about the limits of our own individual health care coverage at the clinic check-in window or in the pharmacy check-out line. These are the wrong venues at which to ask questions and consider the implications of plan and coverage design…. The majority of Americans do not understand that Medicare offers only a limited long-term care benefit…. We generalize about health care and health insurance in ways that may be profoundly inaccurate as well as personally disadvantageous…. We bargain in the dark over both our own future and that of our fellow Americans. Older people are at a particular disadvantage in this “understanding your health insurance” game because older Medicare beneficiaries are often retired, remote from former employers’ human resource departments and they are often reluctant to burden adult children with the task of attempting to decipher coverage….

Traditional Medicare or Medicare Advantage? Medicare Part D coverage and, if so, what plan? Medicare Supplemental Insurance and, if so, at what level of coverage and cost? We have made Medicare and Medicaid so complex that the quality of our own understanding of the individual implications of enrollment, and also the debate over various reform proposals are degraded…. The UMKC Consortium for Aging in Community is hosting two public events on Medicare and Medicaid in March, in an effort to create a bridge between health care experts and the community’s need for information…. Ordinary intelligent people ought not be excluded from the current debates over the future of Medicare and Medicaid. Indeed, those very people ought to drive the debate…

Should-Read: Carmen M. Reinhart and M. Belen Sbrancia (2011): The Liquidation of Government Debt

Should-Read: Carmen M. Reinhart and M. Belen Sbrancia (2011): The Liquidation of Government Debt: “High public debt often produces the drama of default and restructuring…

…But debt is also reduced through financial repression, a tax on bondholders and savers via negative or below- market real interest rates. After WWII, capital controls and regulatory restrictions created a captive audience for government debt, limiting tax-base erosion. Financial repression is most successful in liquidating debt when accompanied by inflation. For the advanced economies, real interest rates were negative 1⁄2 of the time during 1945–1980. Average annual interest expense savings for a 12—country sample range from about 1 to 5 percent of GDP for the full 1945–1980 period. We suggest that, once again, financial repression may be part of the toolkit deployed to cope with the most recent surge in public debt in advanced economies…

Should-Read: Frances Woolley: Why do beginner econometricians get worked up about the wrong things?

Should-Read: Why I am starting to think that both statistics and economics are about to come under serious threat from data science: Frances Woolley: Why do beginner econometricians get worked up about the wrong things?: “People make elementary errors when they run a regression for the first time…

…They inadvertently drop large numbers of observations by including a variable, such as spouse’s hours of work, which is missing for over half their sample. They include every single observation in their data set, even when it makes no sense to do so. For example, individuals who are below the legal driving age might be included in a regression that is trying to predict who talks on the cell phone while driving. People create specification bias by failing to control for variables which are almost certainly going to matter in their analysis, like the presence of children or marital status.  But it is rare that I will have someone come to my office hours and ask “have I chosen my sample appropriately?” Instead, year after year, students are obsessed about learning how to use probit or logit models, as if their computer would explode, or the god of econometrics would smite them down, if they were to try to explain a 0-1 dependent variable by running an ordinary least squares regression….

I am happy to concede to Dave Giles that, all else being equal, it is better to use probit than ordinary least squares, and that Stata’s margins command is not that difficult for an undergraduate to use. But all else is not equal. Using probit will not save a regression that combines men and women together into one sample when estimating the impact of having young children on the probability of being employed, and fails to include a gender*children interaction term. (The problem here is that children are associated with a higher probability of being employed for men, and a lower probability of being employed for women. These two effects cancel out in a sample that includes both men and women.) Once students know how to appropriately define a sample, deal with missing values, spot an obviously endogenous regressor, and figure out which explanatory variables to include in their model, then it might be worth having a conversation about the relative merits of probit and linear probability models. Until then, I’m telling my students to use the regress command and, if it makes them feel better, stick “robust” at the end of it. They don’t listen.

It all comes down to the way that they have been taught econometrics…. Econometrics is taught that way for a simple, practical reason: it’s easy. When every student downloads his own data, works on his own unique problem, and specifies a novel and original model, each student will need a lot of individual help and attention. The marking cannot be delegated to a TA, because each research question, and each data set, is different, so it is impossible to write down a simple answer key. But spending hours upon hours reading students’ first struggling steps at regression analysis is a huge amount of work. It’s so much easier to mark a final exam consisting of calculations, short answer questions, and replication of theorems…

Data science venn diagram Google Search