This is a weekly post we publish on Fridays with links to articles that touch on economic inequality and growth. The first section is a round-up of what Equitable Growth published this week and the second is the work we’re highlighting from elsewhere. We won’t be the first to share these articles, but we hope by taking a look back at the whole week, we can put them in context.
Equitable Growth round-up
Equitable Growth published a new working paper, “Motherhood Penalties in the U.S., 1986-2014” by Eunjung Jee and Joya Misra of University of Massachusetts, Amherst and Marta Murray Close of the U.S. Census Bureau. Despite women’s increased education and workforce experience, the motherhood wage gap has barely budged over the past 30 years and for some mothers it’s actually gotten worse.
We write a non-technical summary about the research by Jee, Misra, and Close, examining the kind of policies that could reduce the motherhood wage penalty. The work was also covered by media outlets, including CNN Money, the Boston Globe, and Romper.
This week Michael Kades, Equitable Growth’s Director for Markets and Competition Policy, presented to the House Antitrust Caucus on how antitrust enforcers have lacked the resources to adequately promote competition during the current merger wave, which has likely contributed to an increase in monopoly power.
Links from around the web
The personal financial difficulties of U.S. educators have been thrust into the national spotlight as public school teachers from West Virginia to Oklahoma demand higher pay. Annie Lowrey writes about why so many teachers have seen their wages and benefits decline since the Great Recession—in contrast to many private sector jobs that have rebounded—and what it says about public sector jobs in general. [the atlantic]
For two decades, the number of Americans not working because of disability rose steadily—until now. Ernie Tedeschi writes about how more working-age disabled are finding work. As Betsey Stevenson commented, “A tight labor market can heal a lot of problems—including convincing employers that it’s worth hiring people with disabilities. A tight labor market raises the cost of discrimination, which is good for lots of people.” [the upshot]
A major shortage of affordable housing in the United States persists for low-income renters. Sarah Holder unpacks a new report that finds that a shortage of more than 7 million affordable and available homes, driven by low wages and an influx of higher income households into more affordable homes. [city lab]
With the national unemployment rate expected to fall below 4 percent by the summer, Jeanna Smialek and Margaret Newkirk report what it looks like for employers and employees in towns where the joblessness rate is already low—from Marietta, GA (with a 3.7 percent unemployment rate) to Portland, ME (with a 1.8 percent unemployment rate). [bloomberg businessweek]
Adam Looney writes about his new study of ex-prisoners that he did with the Federal Reserve Board’s Nicholas Turner. Looney and Turner finds that about one third of 30-year-old men who are not in the labor force are currently or previously incarcerated. The ex-prisoners that do find work earn less than $10,090 annually. [brookings up front]
Friday figure
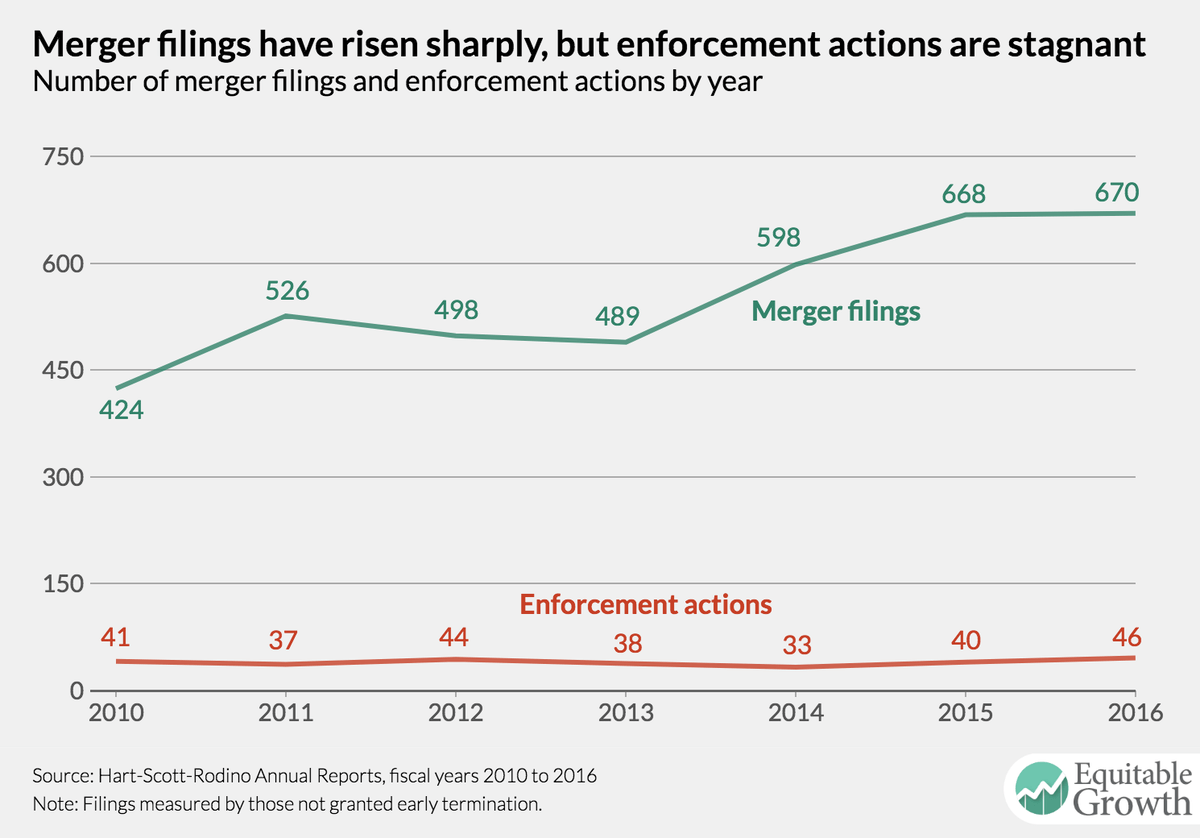
From “Merger enforcement statistics” by Michael Kades.