JOLTS Day Graphs: May 2018 Report Edition
Every month the U.S. Bureau of Labor Statistics releases data on hiring, firing, and other labor market flows from the Job Openings and Labor Turnover Survey, better known as JOLTS. Today, the BLS released the latest data for May 2018. This report doesn’t get as much attention as the monthly Employment Situation Report, but it contains useful information about the state of the U.S. labor market. Below are a few key graphs using data from the report.
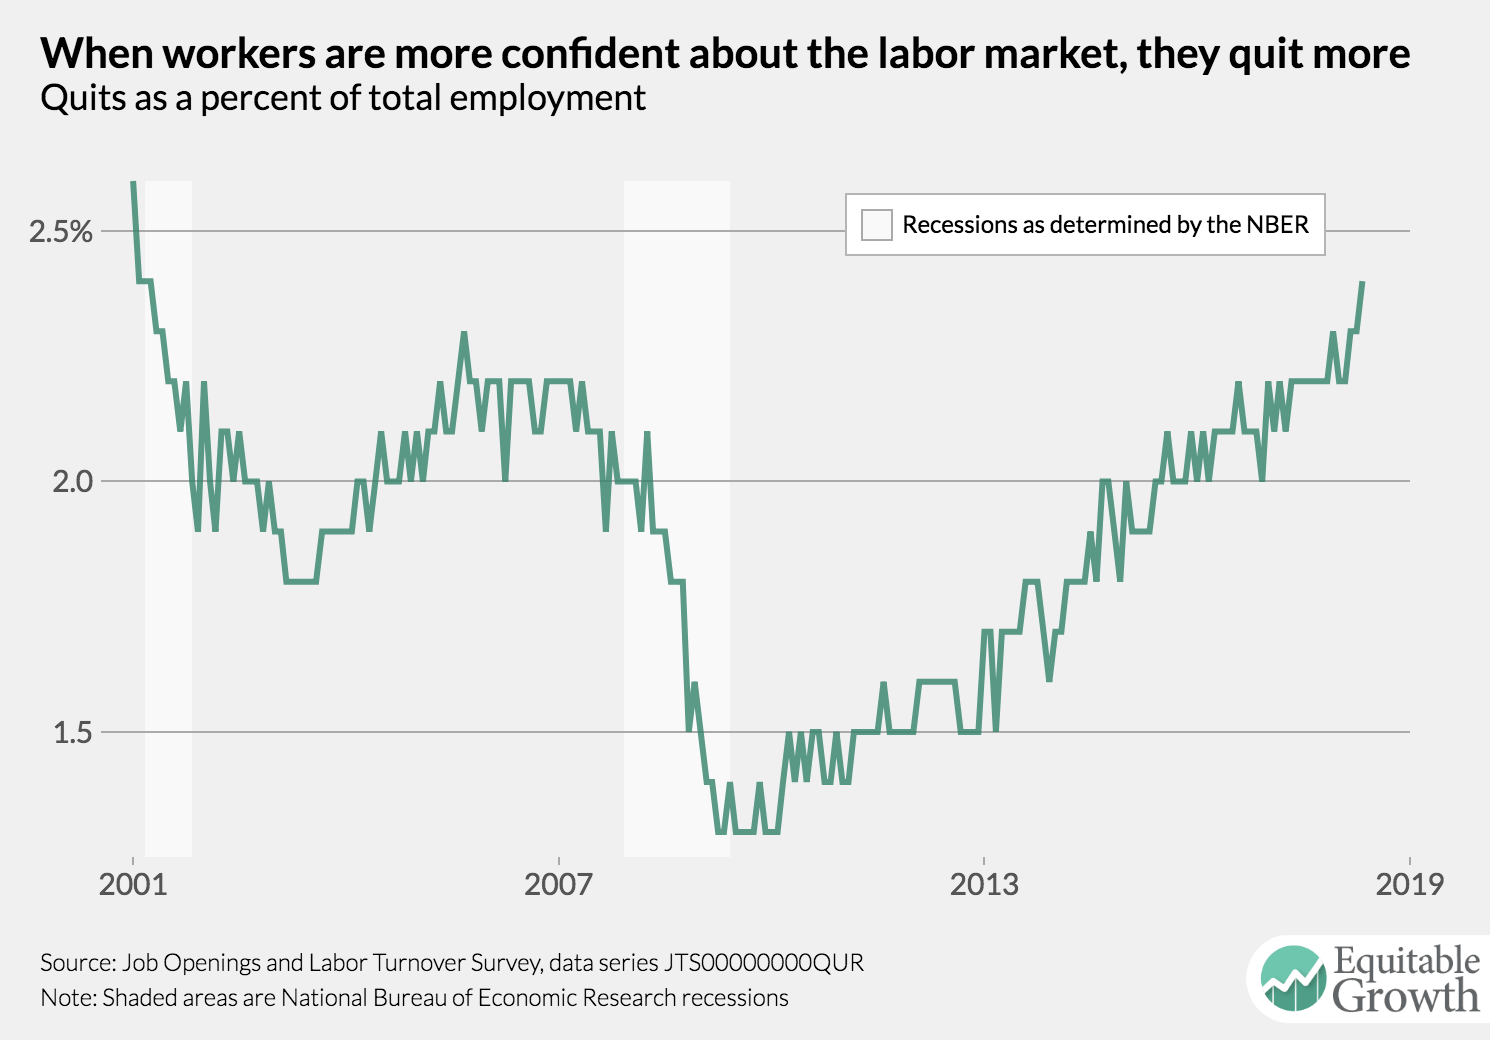
1.
The quits rate continued to change little in May, continuing it’s upward trend and indicating a tightening labor market as workers feel confident about their opportunities.
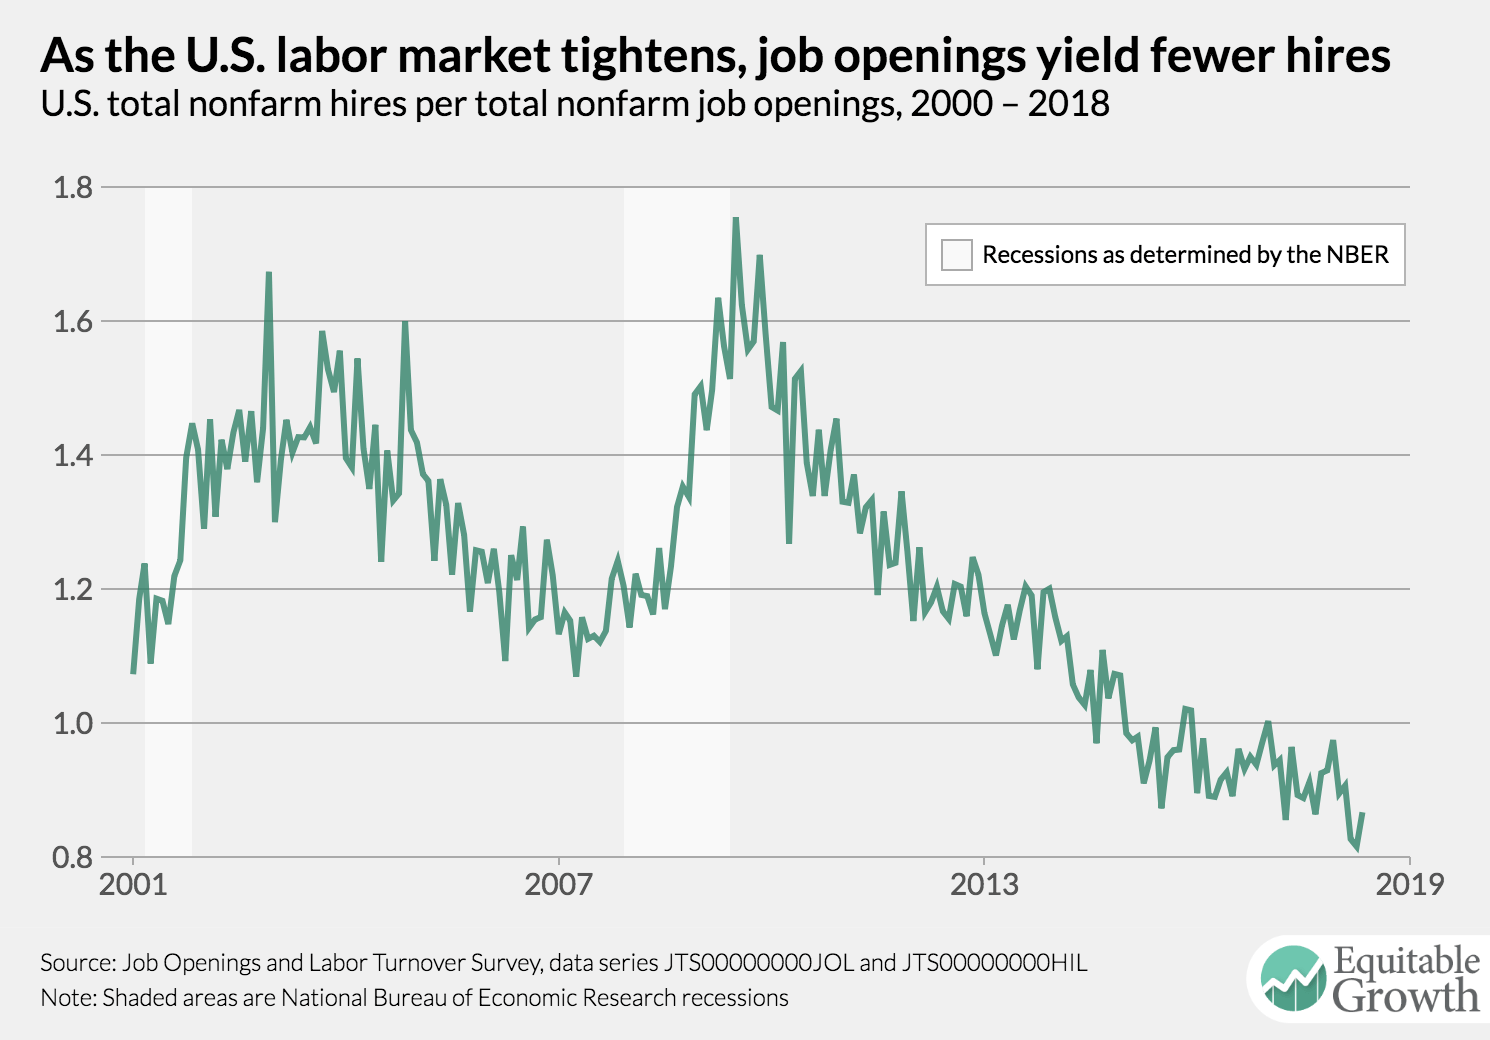
2.
The vacancy yield, or the job-filling rate, increased slightly from 0.82 in April to 0.87 in May. But the long-term trend is downward and below historical levels.
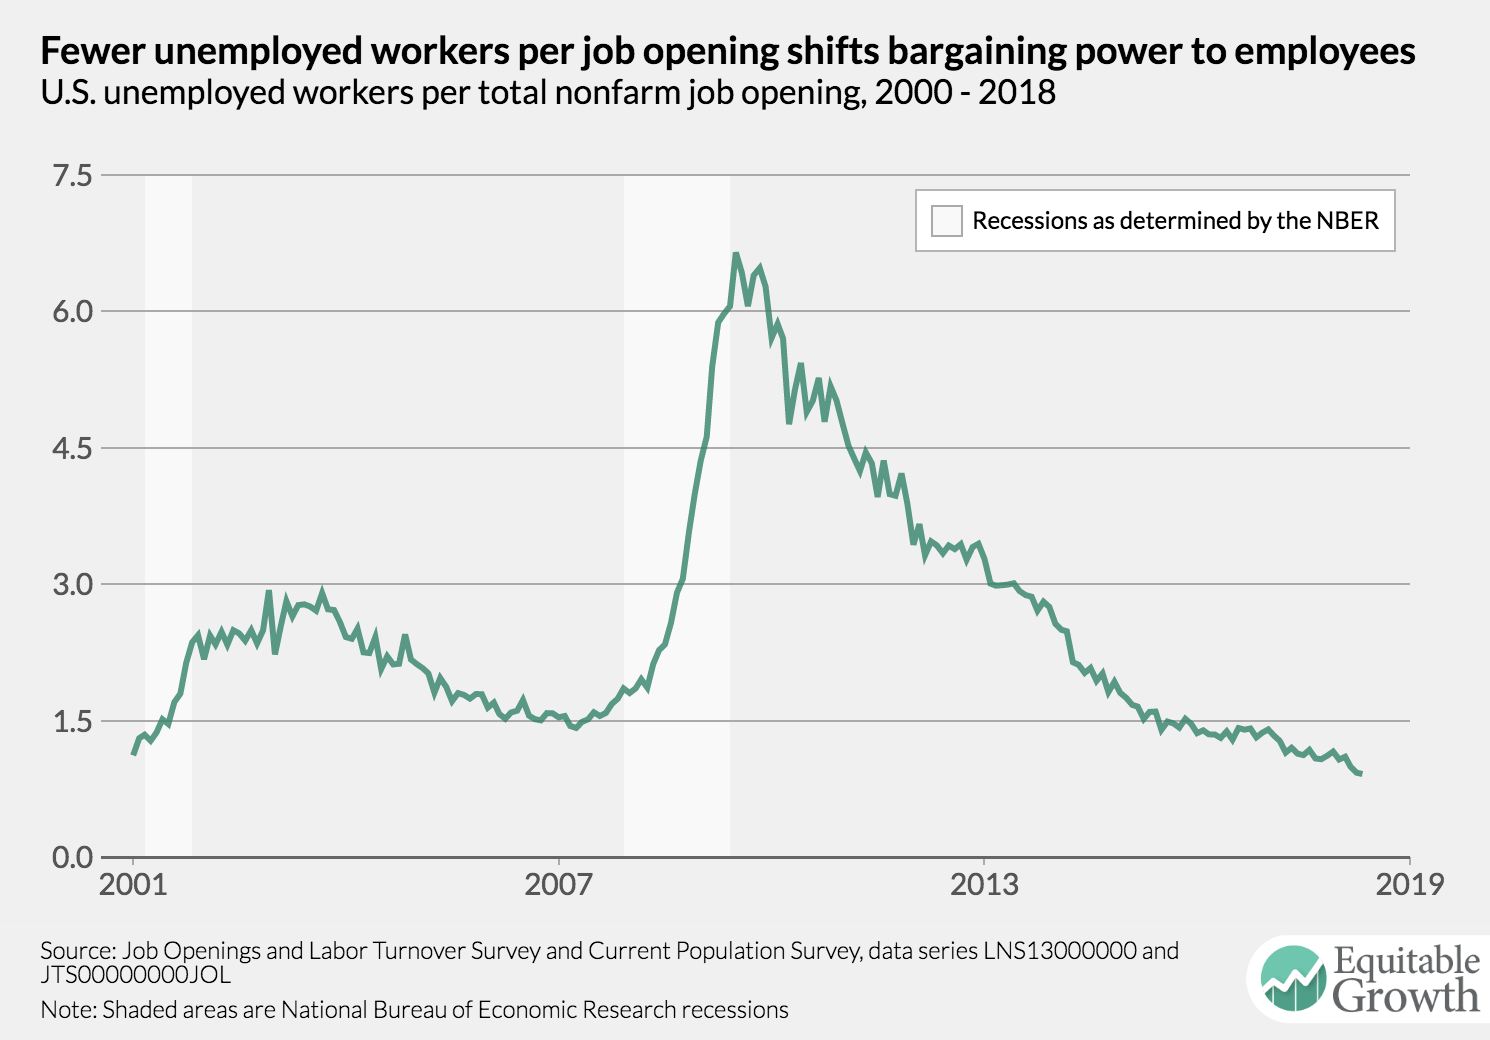
3.
The ratio of unemployment-to-job openings was 0.91 in May, continuing its trend below the significant barrier of 1.0. A ratio below one means there are more open jobs than officially unemployed workers.
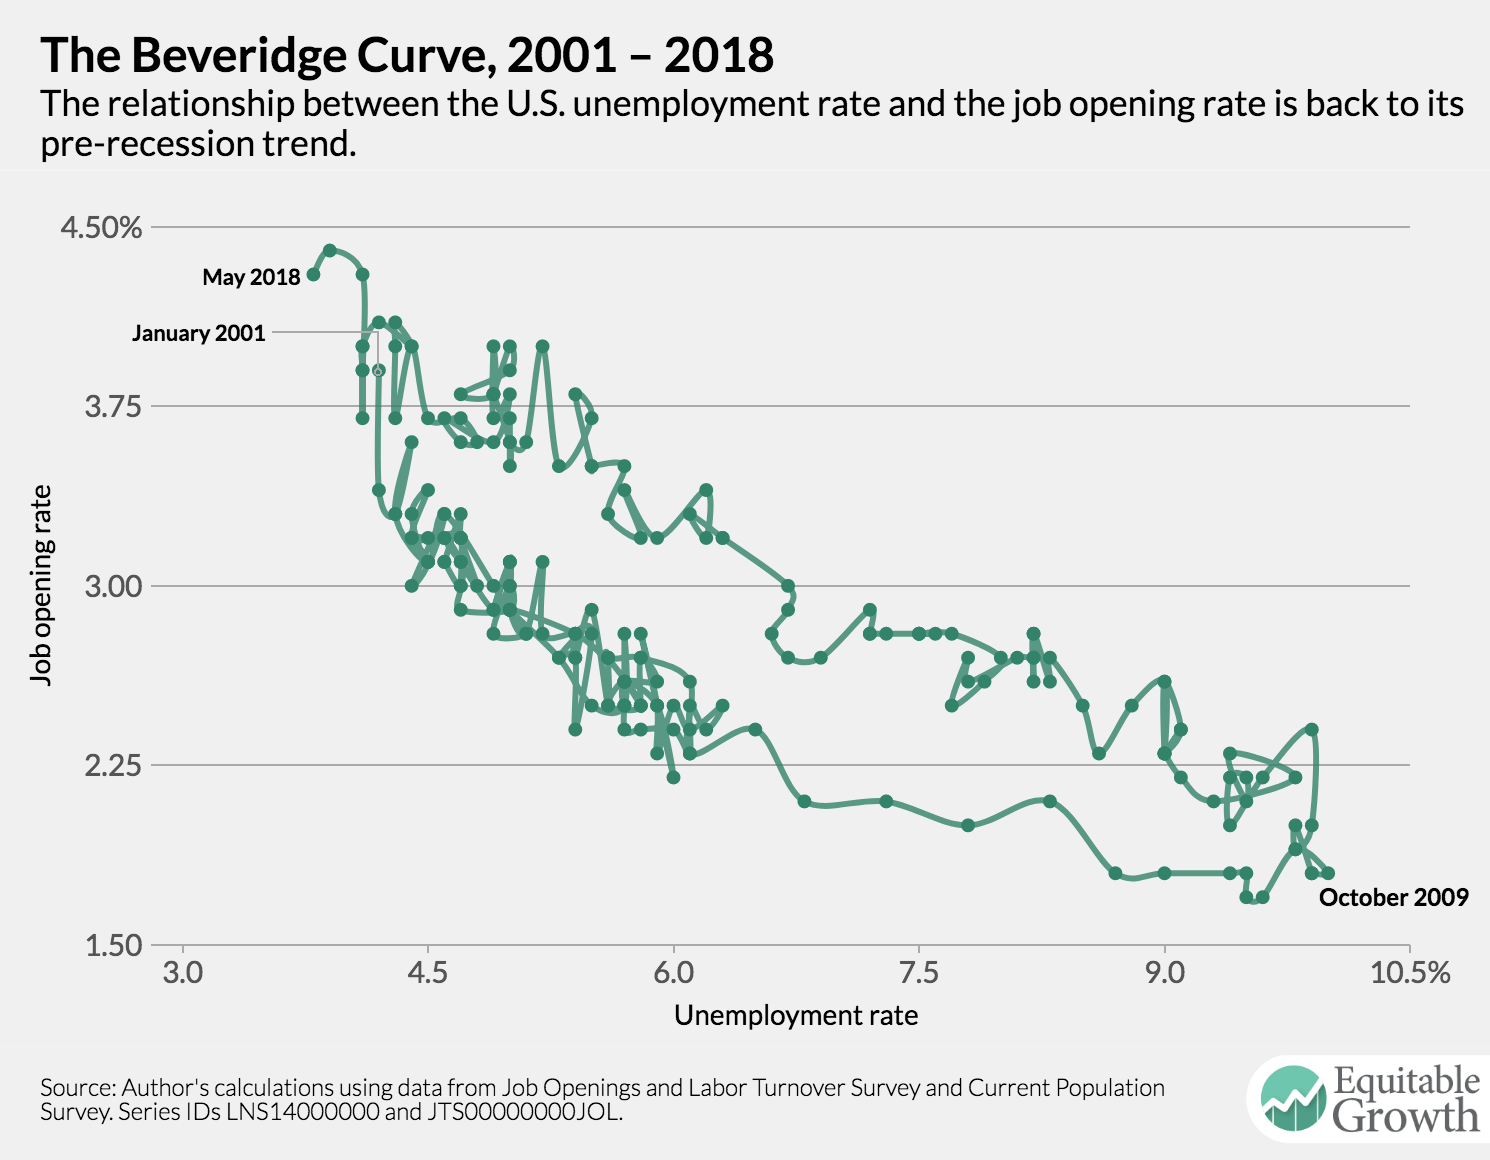
4.
The Beveridge Curve, which estimates the unemployment rate for a given amount of job openings, has returned to its level during the expansion of the early 2000s.