How data disaggregation matters for Asian Americans and Pacific Islanders
Hmong Americans are less likely than the average American to have a household income over $50,000, be employed, or be a college graduate. But the livelihoods of these families, which originally hail from Southeast Asia and mostly migrated to the United States at the end of the Vietnam War, get lost in the aggregated data provided by local, state, and federal agencies. The reason: More than 17 million members of nearly 50 different races and ethnicities are generally categorized as a monolithic group—Asian Americans and Pacific Islanders.
When it comes to economic success in the United States, Asian Americans and Pacific Islanders are often pointed to as the exemplary achievers, or more stereotypically, the “model minorities.” But the rosy narrative that all the members of this group are relatively homogenous and successful puts many of these communities, such as Hmong Americans, at substantial risk of being underserved by their local, state, and federal governments.
 Coronavirus Recession
Aggregated data for all Asian Americans and Pacific Islanders’ socioeconomic indicators, such as median income, employment rate, and educational attainment, helps to preserve ethnic-based inequities among many sub-groups in this catch-all category. Taking a closer look at the data through detailed race and ethnicity categories provided by the U.S. Census Bureau’s American Community Survey, we find a different story: Asian Americans and Pacific Islanders in the United States are richly diverse, and so too are their socioeconomic experiences. Through a series of four chart-based examples, this brief details how data disaggregation matters for Asian American and Pacific Islander communities.
1.
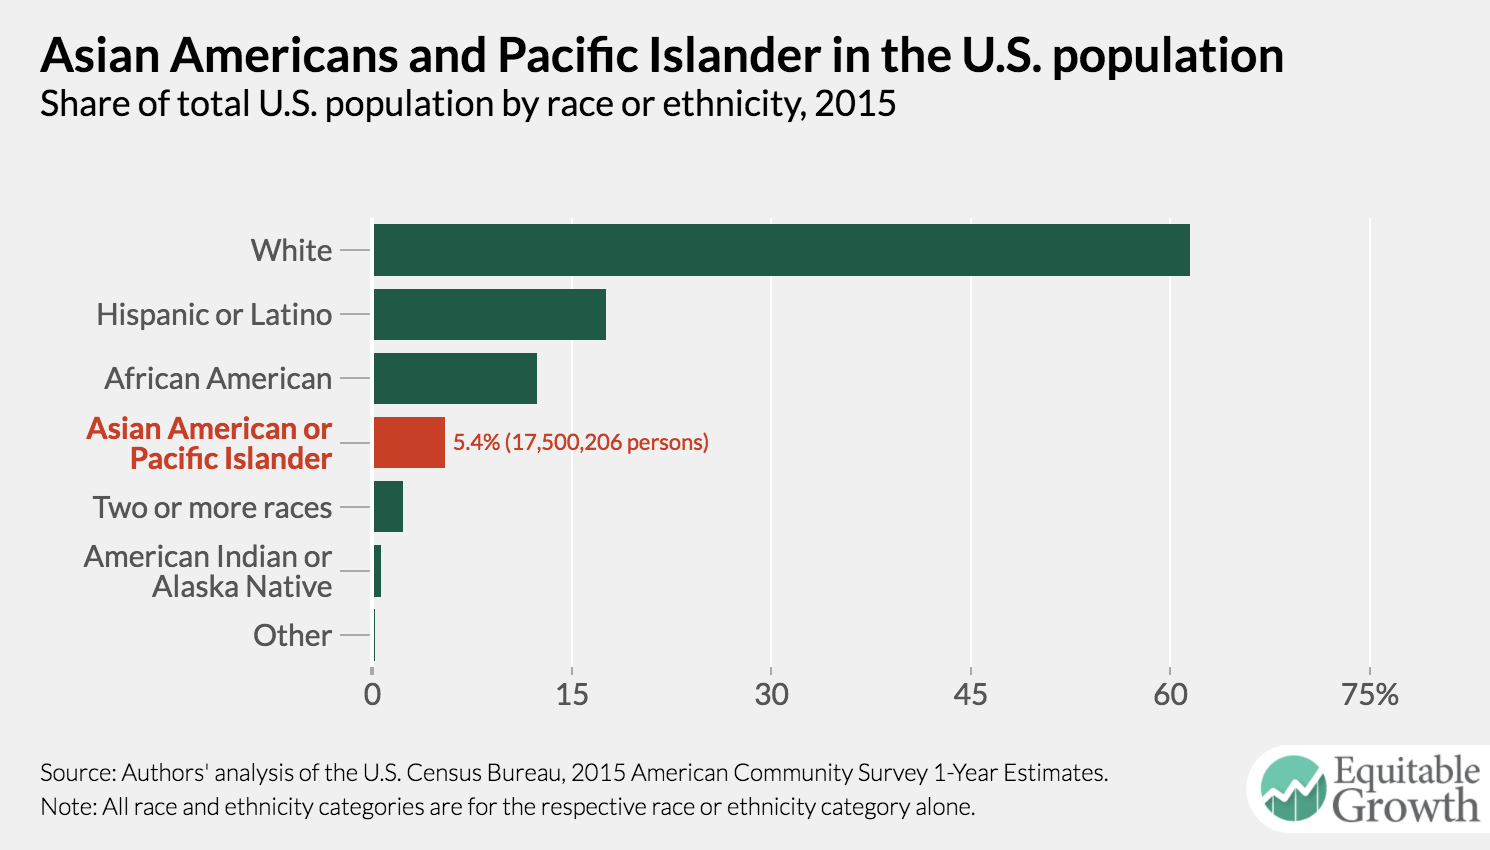
Asian Americans and Pacific Islanders are a small but diverse part of the U.S. population
Currently, there are more than 17 million Asians and over 500,000 Pacific Islanders in the United States. Although they make up only 5.4 percent of the U.S. population—a number that is projected to grow to 9.3 percent by 2060—they are composed of more than 50 different ethnic groups, speaking hundreds of different languages.
Though we don’t necessarily have data on every single ethnicity among all Asian Americans and Pacific Islanders in the United States, a cursory breakdown of their population by ethnic group or national origin reveals how diverse, and complex, the term actually is.
Unpacking Asian Americans and Pacific Islanders by detailed ethnicity or region of national origin yields at least four groups of Asians (East, Southeast, South, and other Asians) and four groups of Pacific Islanders (Melanesians, Micronesians, Polynesians, and other Pacific Islanders). These regional categorizations can be broken down even further. East Asians, for example, include people of Chinese, Japanese, Korean, Mongolian, Okinawan (not featured), and Taiwanese descent. East Asians also happen to be the largest population group within the category of Asian Americans as measured by the American Community Survey (about 1.96 percent of the U.S. population), driven by a large share of people of Chinese ethnicity (approximately 1.23 percent of the U.S. population). Polynesians (which include Native Hawaiians, Samoans, Tongans, and other smaller groups that aren’t captured in the American Community Survey data) are the largest group of Pacific Islanders but only make up about 0.09 percent of the U.S. population.
Disaggregating the race and ethnicity of Asian Americans and Pacific Islanders cuts an already small minority group into even smaller factions. Yet it simultaneously reveals the extent of cultural heterogeneity within the group. This diversity has significant implications for the lived experiences of different members of these many communities, which is why aggregate statistics on their socioeconomic health—and other indicators, for that matter—often mask more than they reveal.
2.
Asian Americans and Pacific Islanders boast highly variable income levels that are invisible in aggregated data
Household income is perhaps the most frequently used barometer of socioeconomic health. In 2015, the national median household income was $55,775. By comparison, Asian American and Pacific Islander households had median household incomes of $74,000.
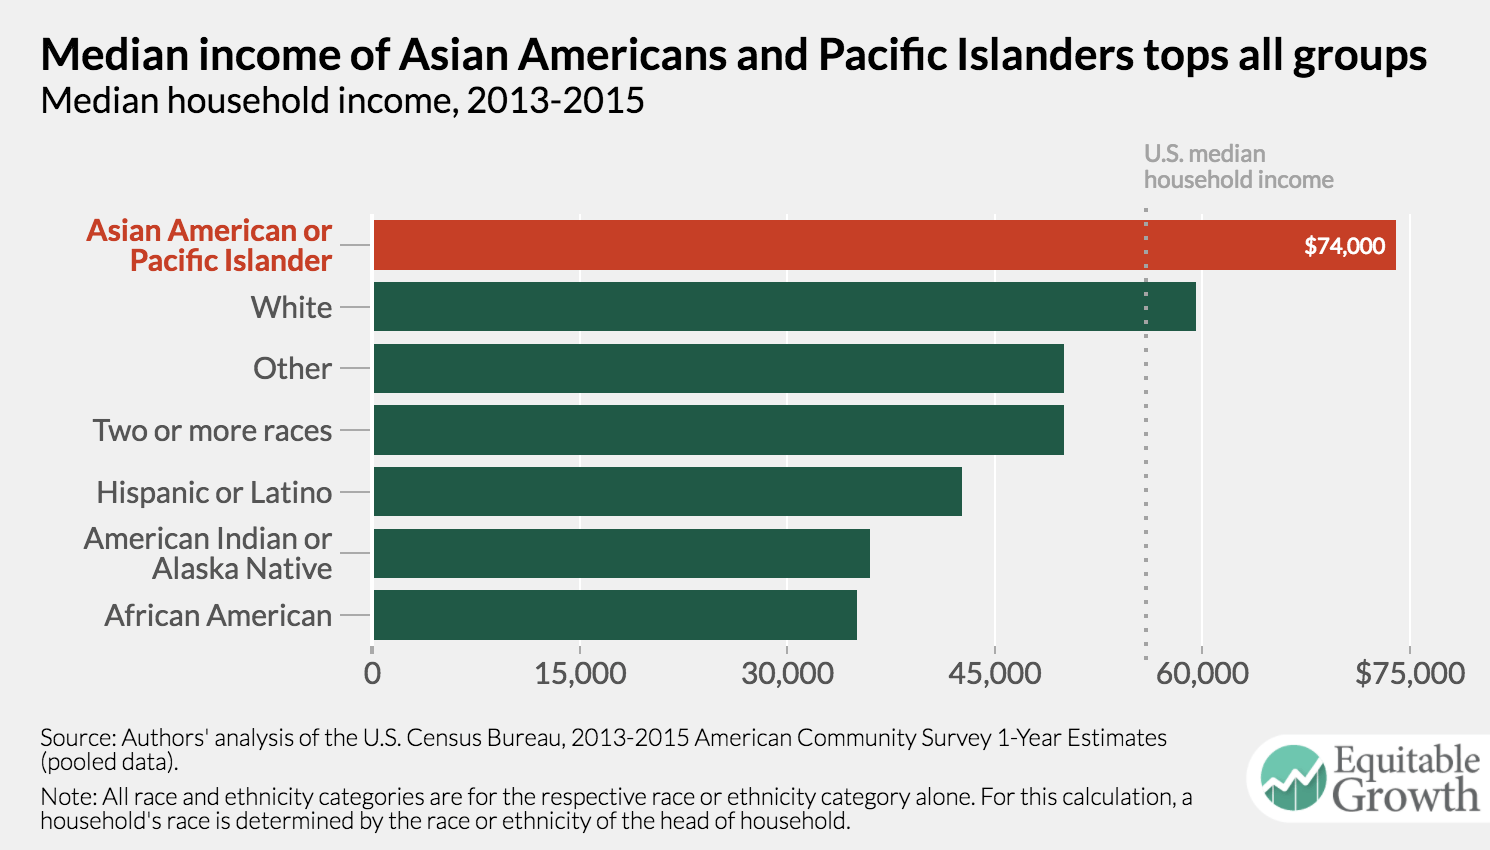
When aggregated, these households earned $14,000 more than even the typical white family and appear to have more than double the median income of the two lowest-earning groups, American Indians and Alaska Natives and African Americans. It’s also important to note that Asian Americans and Pacific Islanders are the most likely group to have three or more working individuals per household, meaning that the aggregate data may be skewed to suggest these households are wealthier than they are.
Data for different ethnic groups within this broad category, however, show that income differences are as big as they are between Asian Americans and Pacific Islanders and other broad racial and ethnic groups. In fact, the median household income for Asian Americans and Pacific Islanders spans a range of $70,000, with the typical Asian Indian household bringing in $100,500 at the top and the typical unspecified Micronesian household earning $30,000. A little under half of the detailed Asian Americans and Pacific Islander groups have a smaller median household income than the U.S. median, and only four groups (Sri Lankans, Taiwanese, Filipinos, and Asian Indians) have a median income above that of all Asian Americans and Pacific Islanders.
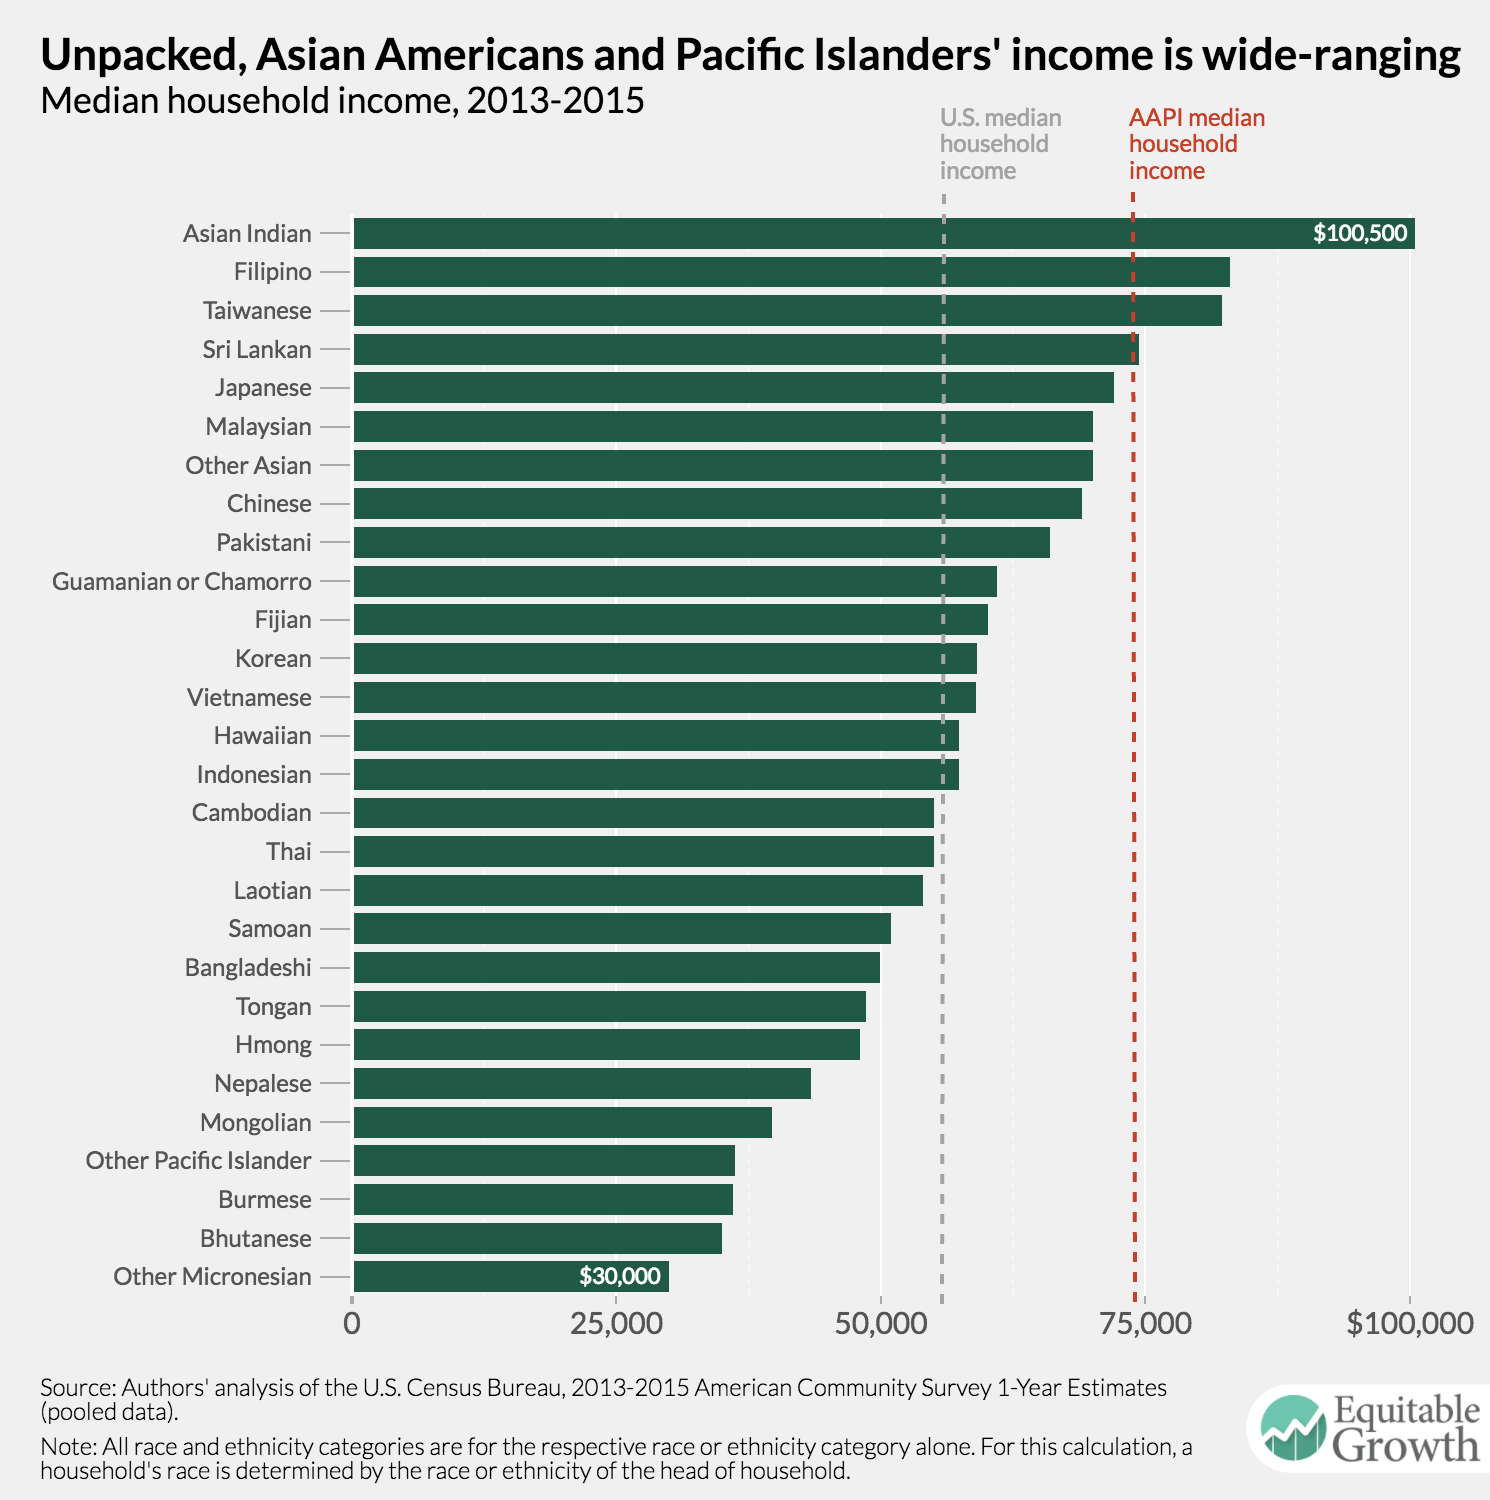
The sizable variance in income across different households within the broader community of Asian Americans and Pacific Islanders makes it challenging to discern any meaningful patterns in the data, but it is important to note that a majority of the East Asian and South Asian ethnic groups in the United States have relatively high median household incomes. Among those with the lowest median household incomes are groups with large refugee populations that have been recently resettled in the United States.
3.
Employment rates for Asian Americans and Pacific Islanders range from 51.2 percent to 67.5 percent
Another way to measure socioeconomic wellbeing is whether a person has a job. In the United States, on average, about 59.0 percent of the population age 16 and above is employed. For Asian Americans and Pacific Islanders, the employment-to-population ratio is slightly better, averaging to 61.0 percent between 2013 and 2015.
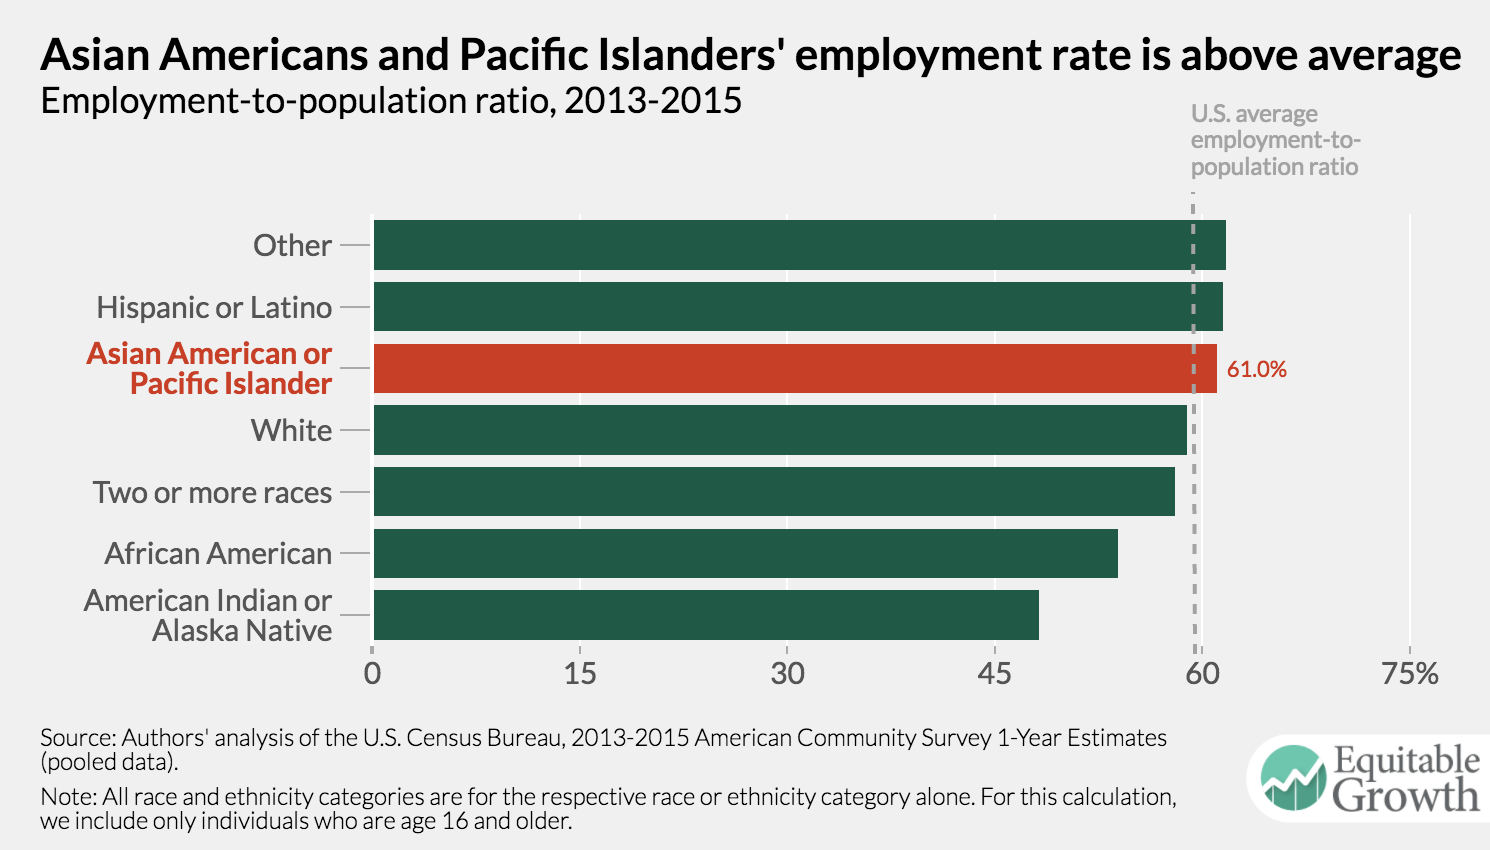
While the “other” race category (comprised of a variety of respondents to this survey who choose the “other” category for an equally varied array of reasons) and Latinos have the highest employment rates—61.7 and 61.5 percent, respectively—Asian Americans and Pacific Islanders still have a higher employment-to-population ratio than whites (58.9 percent), multiracial people (58.0 percent), African Americans (53.9 percent), and American Indians and Alaska Natives (48.1 percent).
Yet a more detailed look at the employment rate of Asian Americans and Pacific Islanders demonstrates that the employment-to-population ratio greatly varies within this broader community. Fijians (67.5 percent), Mongolians (65.5), Filipinos (65.4), Asian Indians (65.0), and Sri Lankans (64.7) have the largest employment rates. Pakistanis (56.2), Malaysians (53.9), Japanese (53.8), unspecified Micronesians (53.0), and Bhutanese (51.2) have the lowest employment rates.
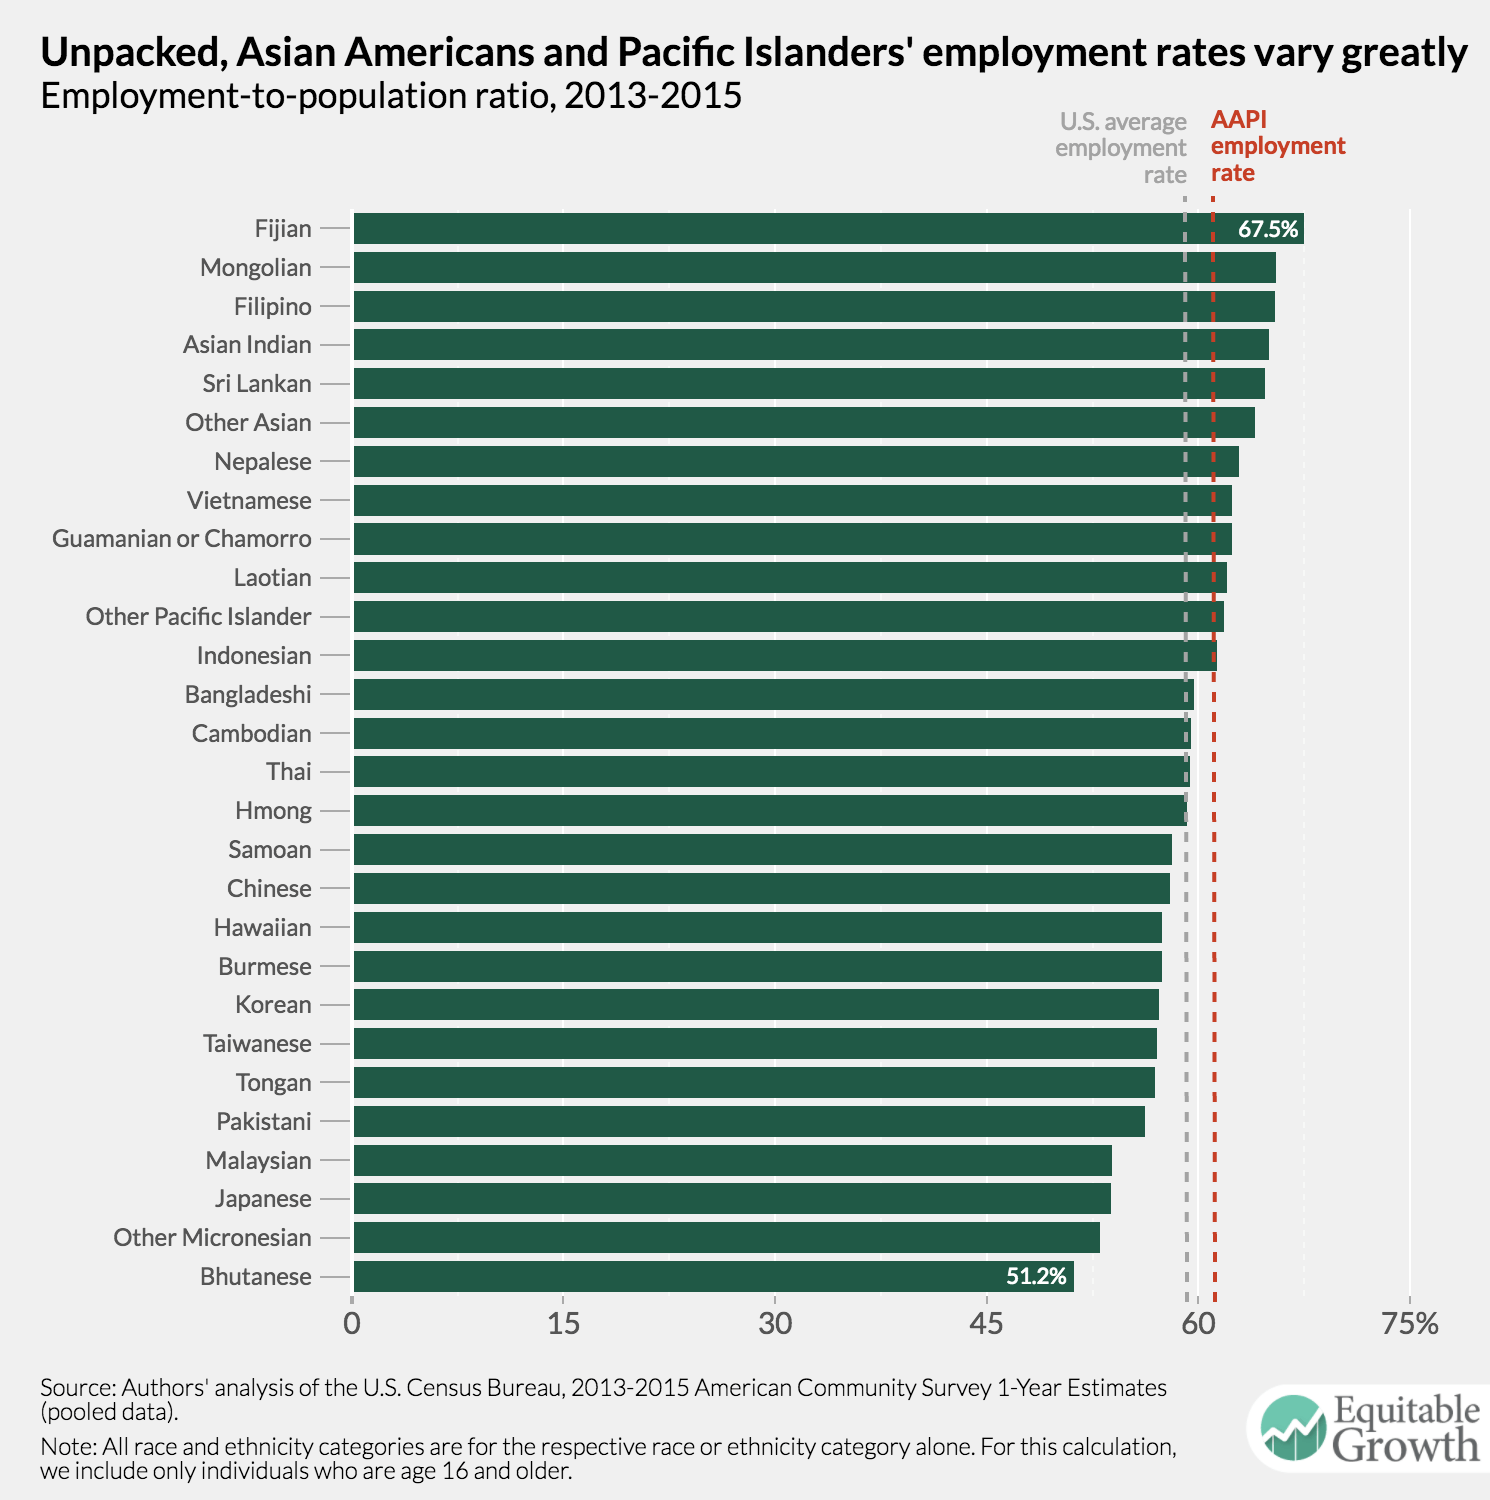
It is difficult to pinpoint what mechanisms drive these differences in employment-to-population ratios among these Asian American and Pacific Islander communities. Some factors that may influence the variation include high rates of linguistic isolation among certain sub-groups, differences in immigration history, the average age of immigration, and gender norms. Yet with about half of all Asian American and Pacific Islander groups registering an employment-to-population ratio below the national average suggests that the aggregated data makes invisible the socioeconomic realities of many these families.
4.
Aggregated Asian American and Pacific Islander provides a skewed story about educational attainment
Varying levels of educational attainment can in part explain varied household incomes and employment rates among Asian Americans and Pacific Islanders. Nationally, about 30.6 percent of the U.S. population has a bachelor’s degree or more. In contrast, 51.0 percent of Asian Americans and Pacific Islanders hold a bachelor’s degree or higher.
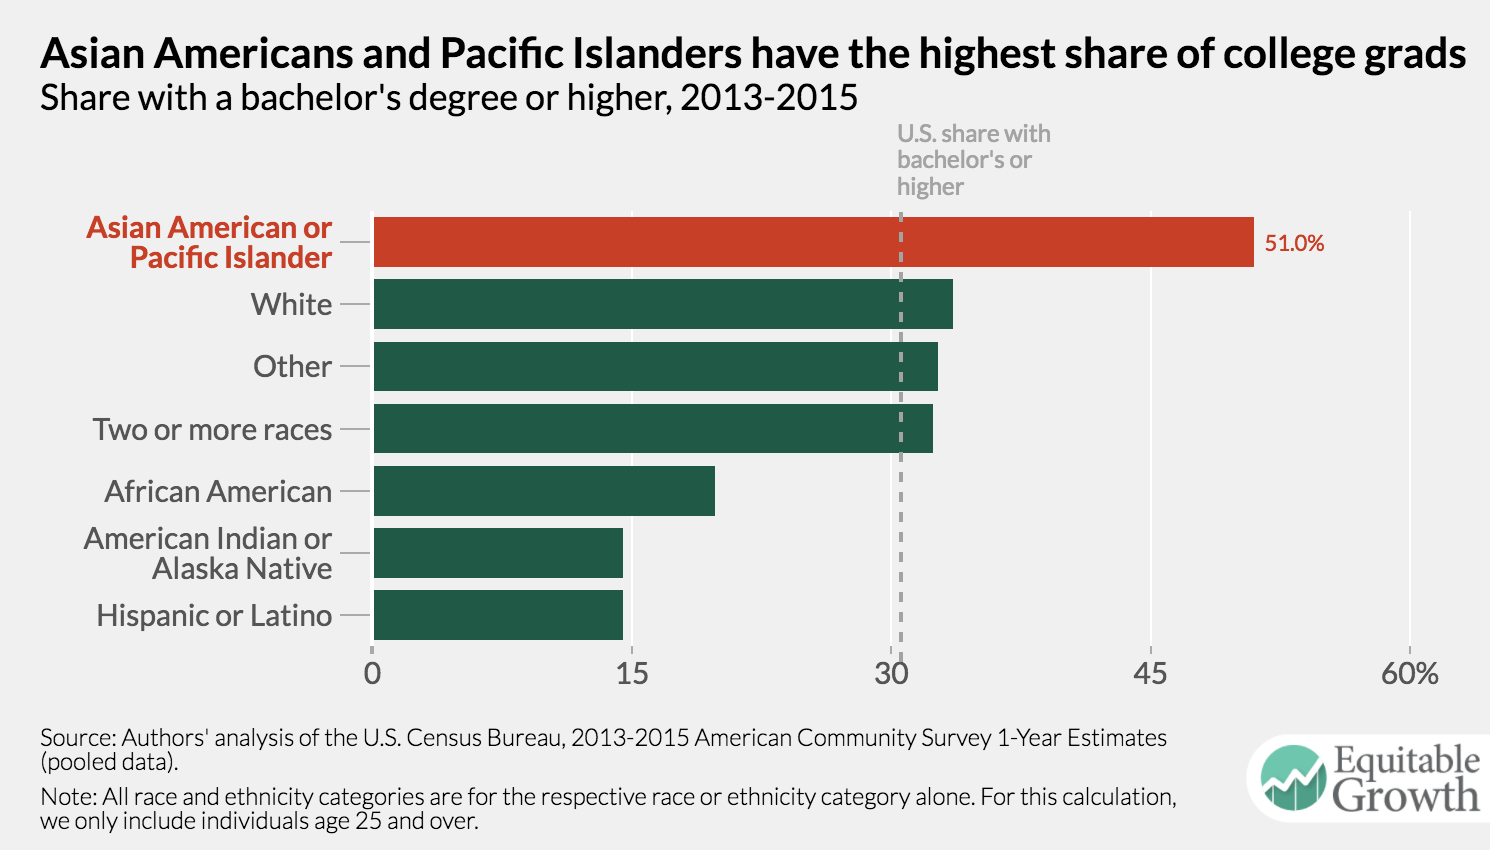
On the whole, Asian Americans and Pacific Islanders have outstanding educational attainment, surpassing every other racial or ethnic group by wide margins. On average, they have 3.5 times the educational attainment of Latinos and American Indians and Alaska Natives, 2.5 times the educational attainment of African Americans, and about 1.5 times the educational attainment of whites. But this high level of educational attainment is attributed to only a select group of Asian Americans and Pacific Islanders. A detailed look at educational attainment by race and ethnicity subcategories shows that rates of college completion range over 69.4 percentage points within the broader Asian American and Pacific Islander group.
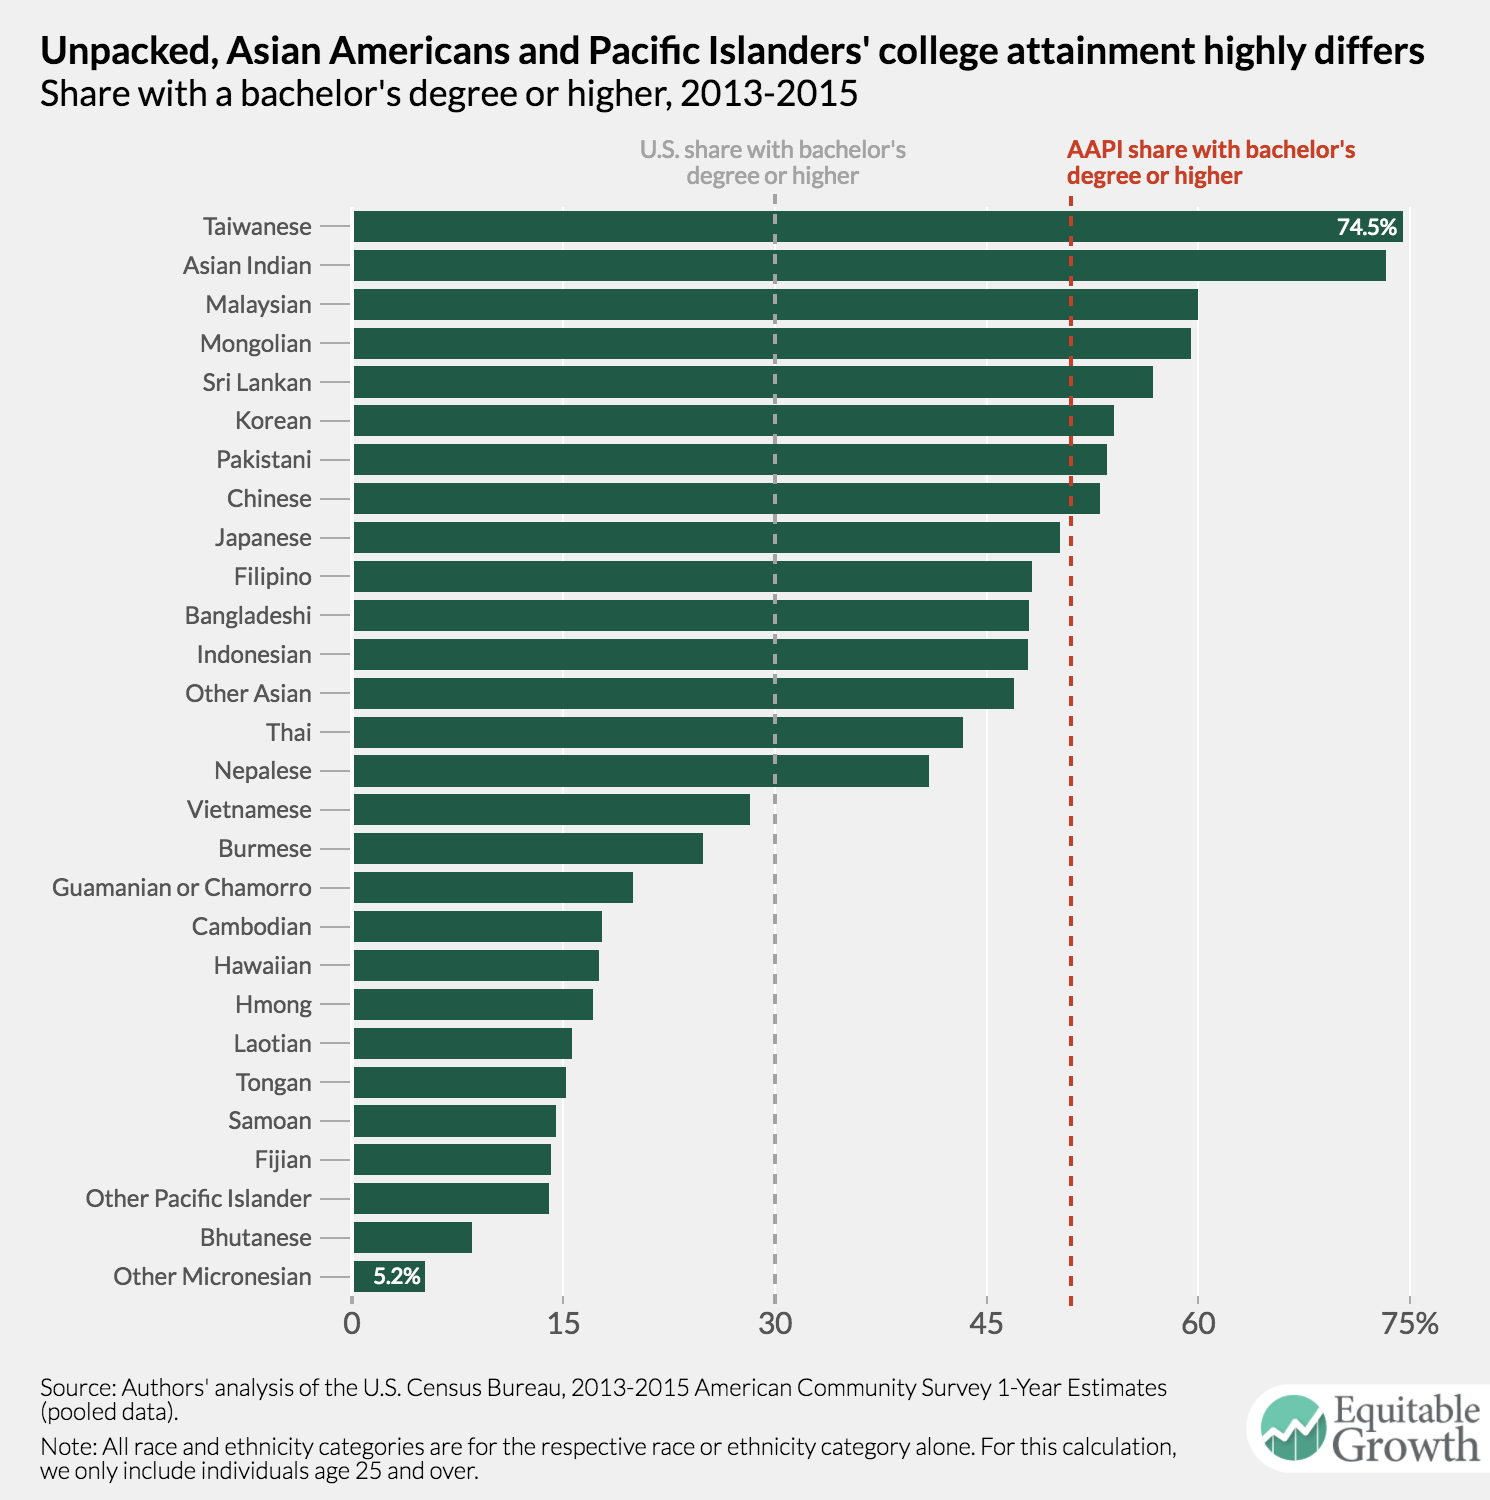
Taiwanese have the greatest share of people with a bachelor’s degree or more (74.5 percent). Asian Indians are a close second, with 73.3 percent of the 25 and over population holding a bachelor’s degree or more. Aside from these two groups, Americans of Malaysian, Mongolian, Sri Lankan, Korean, Pakistani, and Chinese descent all have higher college completion rates than the average among Asian Americans and Pacific Islanders.
At the same time, about 13 of these U.S. ethnic and racial sub-groups have lower educational attainment rates than the U.S. average. Unspecified Micronesians have the lowest share of people with a college degree or greater (5.2 percent). This population, along with Bhutanese, other Pacific Islanders, and Fijians, has lower educational attainment levels than Latinos, who, among the major race and ethnic groups, have on average the lowest share of people with a college degree or more. Vietnamese, Burmese, Guamanians (also known as Chamorros), Cambodians, Hawaiians, Hmong, Laotians, Tongans, and Samoans are also on the lower-end of college educational attainment.
The patterns in disaggregated educational attainment among Asian Americans and Pacific Islanders display a clearer story than those found in household income and the employment rate. Generally, immigrants who come to the United States for employment—such as East and South Asians—have better educational attainment outcomes than their counterparts from Southeast Asia. And Pacific Islanders have levels of education much more comparable to African Americans, American Indians and Alaska Natives, and Latinos. Aggregated educational attainment data significantly distorts this picture.
Data disaggregation matters for Asian Americans and Pacific Islanders
Household income, employment rates, and educational attainment make up only a small part of broader socioeconomic state of Asian Americans and Pacific Islanders, yet these three measures help identify an important theme: Regardless of what socioeconomic variables we dissect, across the board, Asian Americans and Pacific Islanders from different groups have notably different experiences. Research increasingly shows that this theme is evident across other dimensions, too, such as social, physical, and mental health as well as civic participation.
In order to further this research, however, disaggregated categories need to be made available in U.S. administrative data. In fact, a proposed revision of the Standards for Maintaining, Collecting, and Presenting Federal Data on Race and Ethnicity by the federal Office of Management and Budget could certainly improve the quality and granularity of all data collected on Asian Americans and Pacific Islanders. Although there are valid concerns about what a disaggregation revision means for privacy in data and sample sizes for analysis, refined ethnicity categories can ensure that the data don’t obscure what they are meant to enlighten. It may even be possible to address some of these concerns about disaggregation by using national origin regions for Asian Americans and Pacific Islanders if more detailed categories compromise the data’s integrity. It’s valuable to note, though, that data collected at highly disaggregated levels can always, if necessary, be aggregated after refined collection to protect privacy.
Ultimately, having disaggregated data about Asian Americans and Pacific Islanders is the most effective way to form evidence-based policy around the distinct needs of these diverse communities and identify unique barriers to access of services and resources at the local, state, and federal level. Using disaggregated data can also help policymakers develop substantial quantitative stories about the challenges these communities face as they continue to become a larger part of the broad U.S. social fabric. More detailed data that highlights this diversity can better guide the creation of inclusive and equitable policies for all Americans.
American Community Survey data used in this post is from IPUMS-USA, University of Minnesota, www.ipums.org.