How economic inequality affects children’s outcomes

AP Images

About the author: Ariel Kalil is a professor of public policy at the Harris School of Public Policy Studies, University of Chicago.

What happens in the home is paramount to children’s early development. Economically disadvantaged children’s limited access to cognitively enriching home environments may help drive growing gaps in cognitive and non-cognitive skills, producing a feedback cycle that leads to low socioeconomic mobility and further grows inequality. Research increasingly suggests that policy should identify new targets for programs aimed at enhancing parent-child interactions in low-income families, such as Early Head Start and Healthy Families America. All parents want to help their children flourish, but low-income parents often lack the resources to achieve their parenting goals. Parents are children’s first teachers and, to equalize the playing field, governments need to invest in parents so that they, in turn, can better invest in their children.

Background

Economic growth for much of the 20th century supported America’s promise of offering opportunities to both parents and their children. It is well known, however, that income inequality increased dramatically in the United States beginning in the 1970s.1 Greg Duncan and Richard Murnane illustrate how increasing family income inequality may affect access to high-quality child care, neighborhoods, schools, and other settings that help build children’s skills and educational attainments.2 Changes in these social contexts may in turn affect children’s skill acquisition and educational attainment directly as well as indirectly by influencing how schools operate.

Growing income inequality also increases the gap in the resources high- and low-income families can spend on enrichment goods and services for their children.3 For instance, Sabino Kornrich and Frank Furstenberg show that spending on child-enrichment goods and services jumped for families in the top quintiles but increased much less—in both absolute and relative terms—for families in bottom-income quintiles, as reflected in four large consumer expenditure surveys conducted between the early 1970s and 2005-2006. In 1972-1973, high-income families spent about $2,700 more per year on child enrichment than did low-income families. By 2005-2006, this gap had nearly tripled, to $7,500.4

As the incomes of affluent and poor American families have diverged over the past three decades, so too has the educational performance of the children in these families. Sean Reardon documents substantial growth in the income-based gap on the test scores of children born since the 1950s. Among children born around 1950, test scores of low-income (10th income percentile) children lagged behind those of their better-off (90th income percentile) peers by a little over half a standard deviation, or about 50 points on an SAT-type test. Fifty years later, this gap was twice as large. Family income is now a better predictor of children’s success in school than race.5

At age four, children from families in the poorest income quintile score on average at the 32nd percentile of the national distribution on math, the 34th percentile in a test of literacy, and at the 32nd percentile on a measure of school readiness compared with children in the richest quintile, who scored at the 69th percentile on math and literacy and at the 63rd percentile on school readiness.6 Gaps in conduct problems and attention/hyperactivity also are apparent albeit less pronounced. On measures of hyperactivity, for instance, children from families in the poorest income quintile score on average at the 55th percentile of the national distribution (in this case, higher scores indicate higher levels of behavior problems) compared with children in the richest quintile, who scored at the 44th percentile.7

Delivering equitable growth

Previous article: Income volatility, Bradley Hardy
Next article: Social Security, Jesse Rothstein

Using data from the 1979 and 1997 National Longitudinal Surveys of Youth, Martha Bailey and Susan Dynarski show that graduation rates for children born into high-income families jumped 21 percentage points (from 33 percent to 54 percent) between the early 1960s and the early 1980s. The corresponding increase for children born into low-income families was only four percentage points (from 5 percent to 9 percent). A little less than half of the gap between rich and poor in college graduation rates can be explained by differences in college enrollment rates, with the rest explained by differences in students’ persistence in completing their degrees.8 Phillipe Belley and Lance Lochner show that high family income has become a substantially more important determinant of college attendance and college quality in recent years, particularly for those youth with the lowest skills.9

Drivers of the socioeconomic
status-based gaps in child outcomes

Rising gaps in children’s skills and attainments cannot be attributed to rising income gaps alone, however.10 In fact, Reardon estimates that only about half of the rising income-based gap in test scores can be attributed to rising income inequality.11 Parents invest more than money in their children’s development. Through their time and attention parents can provide a cognitively stimulating and emotionally supportive home environment that promotes children’s early learning and behavioral adjustment. Economically advantaged parents differ from their less advantaged peers on many relevant dimensions of parenting.12

Mounting evidence suggests that socioeconomic status-based gaps in parenting and children’s early developmental outcomes have grown alongside increasing economic inequality in family conditions.13 The demography of family structure, for example, has changed in ways that favor the socioeconomically advantaged and their ability to invest parental time and resources in their children’s development. Between 1980 and 2010, the share of children living with college-educated mothers who were married remained at about 90 percent. In contrast, the share of children living with mothers who lacked a high school degree and who were married decreased from about 73 percent to about 66 percent.14 Two-biological-parent households not only enjoy greater economic well-being but also demonstrate higher levels of parental time investment in children than do single-parent households.15

Trends in maternal age at first birth also have changed in important ways that may favor the parenting environments provided by mothers with high socioecoconomic status. Comparing data on U.S. births in 1970, 1989 and 2006 by age of mother and maternal schooling reveals that the maternal age gap between children born to high school dropouts and college graduate mothers grew by nearly 3 years—from 4.3 years to 7.1 years.16 Positive parenting behaviors increase in maternal age at first birth whereas negative parenting behaviors decrease in maternal age at first birth.17

Finally, how parents think about parenting has changed dramatically over the past century. In 1900, parenting experts emphasized nutrition, medical care, and fresh air as the key inputs into child development, according to a comprehensive analysis of magazine articles containing parenting advice. By the 1980’s, intellectual stimulation and social/emotional development had replaced nutrition and fresh air as key topics of concern along with medical care.18 Yet economically advantaged parents, more so than their disadvantaged counterparts, may have responded more quickly to this advice, thus widening the parenting gap.

Why parents matter

Economically advantaged parents display more of the behaviors deemed supportive of children’s development across a range of parenting domains. Economically advantaged parents display more authoritative (versus authoritarian) parenting styles,19 engage in more sensitive and responsive mother-child interactions,20 use greater language stimulation,21 and use greater levels of parental management and advocacy.22 A famous example of differential parenting by socioeconomic status is the study by Betty Hart and Todd Risley, who intensively observed the language patterns of 42 families with young children. They found that in professional families, children heard an average of 2,153 words per hour, while children in working class families heard an average of 1,251 words per hour, and children in welfare-recipient families heard an average of 616 words per hour. By age four, a child from a welfare-recipient family could have heard 32 million words fewer than a classmate from a professional family.23

One of the most important parenting differences between advantaged and disadvantaged parents is in how much time the parent spends with the child. Annette Lareau’s qualitative study of family life reported that middle-class parents target their time with children toward developmentally enhancing activities. In her study, middle-class families (whose jobs, by her definition, require college-level skills) engage in a pattern of “concerted cultivation” to actively develop children’s talents and skills. By contrast, in lower-class families, Lareau identified a pattern that she calls “the accomplishment of natural growth,” wherein parents attend to children’s material and emotional needs but presume that their talents and skills will develop without concerted parental intervention.24

Numerous quantitative studies not only show large differences in the time investments of advantaged and disadvantaged parents but also that these gaps remain large even when other differences across families, such as employment hours and schedules, are accounted for.25 Work by Ariel Kalil, Rebecca Ryan, and Michael Corey further shows that highly educated mothers are more “efficient” in their parental time investments by tailoring their specific activities to children’s developmental stage. This research also shows that with respect to total childcare time, the educational gradient is most apparent in households with the youngest children, a point also made by Erik Hurst, Daniel Sacks, and Betsey Stevenson.26 Economically advantaged mothers, more so than their less advantaged counterparts, may have learned the message that parental investments in early childhood are key ingredients in children’s long-run success.27

High-income parents appear to be investing more parenting time than ever before in their children’s cognitive development and educational success.28 This increase may mean that high-skilled parents are responding to the increased returns to having high-skilled (highly educated) children.29 Work by Erik Hurst , Daniel Sacks, and Betsey Stevenson further show that all of the increase in childcare time between 1985 and 2003 has come from households with children ages 5 and younger, and Evrim Altintas shows that the growing education gap in time with young children is driven by time in educationally enriching activities.30

Increases in the parenting gap are expected to be relevant for socioeconomic status-based gaps in children’s development. Observational research suggests that the quality of the home learning environment as measured by the HOME score accounts for up to half of the relationship between socioeconomic status and disparities in children’s cognitive test scores.31 In a descriptive analysis of U.S. data from the Early Childhood Longitudinal Study-Birth Cohort, Jane Waldfogel and Elizabeth Washbrook conclude that parenting style (in particular, mothers’ sensitivity and responsiveness as well as the home learning environment) is the most important factor explaining the poorer cognitive performance of low-income children relative to middle-income children, accounting for between a quarter and a third percentage of the gaps in literacy, mathematics, and language.32

What’s the role for
public policy?

Few trends are more ominous than the increases in both the class gaps and achievement gaps between low- and high-income children in the United States. The rising income-based achievement gaps call into question whether the American Dream of intergenerational mobility is now beyond the reach of many children raised in low-income families.33

Policy approaches to addressing increasing disparities in outcomes for children from low- and high-income families can take a number of forms. Some of these will boost families’ economic security, others can help support parents’ engagement in their children’s development, and others can provide educational supports directly to children. Such approaches can be pursued simultaneously. These include policies such as the Earned Income Tax Credit that redistributes income and relies on parents to use the added income to promote their children’s development; policies such as the Nurse Family Partnership that teach high-risk parents about positive parenting practices and about the nature of early childhood development; polices such as Pell Grants that encourage would-be parents to acquire post-secondary schooling; and policies such as state pre-Kindergarten programs that provide educational services directly to young children.34

Given the importance of parental engagement in children’s development, it may be especially fruitful for policies to focus on boosting parents’ ability to provide a cognitively stimulating and emotionally supportive home environment. Gaps in children’s skills could be narrowed if less-advantaged parents adopted the parenting practices of their more-advantaged peers. Notably, a leading family intervention for low-income children—the Nurse-Family Partnership program—is being targeted for substantial expansion by the federal government from the Administration on Children and Families’ Maternal, Infant, and Early Childhood Home Visiting Program demonstration. The program provides weekly in-home visits by trained nurses from pregnancy through the child’s second birthday.

One mission of the Nurse-Family Partnership program is to improve children’s health and development by helping young, economically disadvantaged parents provide more competent care. Some experimental evaluations of the program show it reduces child maltreatment. In one study, mothers in the treatment group who received nurse visits during their pregnancy and the child’s infancy had 0.29 substantiated reports of child abuse and neglect at some point before the child turned 15. Mothers in the control group, in contrast, had on average 0.54 such reports.35 This is important because child maltreatment is costly for the individual affected and for society.36

The Nurse-Family Partner program also yields long-run benefits for some children. By age 19, girls in the treatment group had fewer arrests and convictions; a subset of these girls had fewer children and less Medicaid use than their comparison group counterparts.37 Although there is room for improvement in the design and delivery of this and similar intervention programs, research underscores the merit of the new federal emphasis on supporting parenting in educationally disadvantaged families.

Important new evidence also is emerging that suggests that low-cost “light-touch” efforts can be highly successful in helping low-income parents support their young children’s learning and development.38

Conclusion

The United States has made little progress toward narrowing the achievement gap between advantaged and disadvantaged children. This is in part because public policy has neglected the critical role of parenting in children’s development. Parents do more than spend money on children’s development; they also promote child development by spending time in cognitively enriching activities and by providing emotional support and consistent discipline.

All parents want the best for their children, but the “parenting divide” between economically advantaged and disadvantaged children is large and appears to be growing over time.39 The main barrier to designing and scaling up parenting interventions nationwide is the currently limited understanding of the key ingredients of successful programs. Policymakers need to become better informed on effective interventions that can motivate and support parents to engage effectively in their children’s development.

The “silver spoon” tax: how to strengthen wealth transfer taxation

AP Images

About the author: Lily L. Batchelder is a professor of law and public policy at New York University School of Law.

Wealth transfer taxes are a critical policy tool for mitigating economic inequality, including inequality of opportunity. They are also relatively efficient. This essay summarizes why and how wealth transfer taxes should be strengthened. Reform options that our next President should consider include increasing the wealth transfer tax rate, broadening the base, repealing stepped-up basis, addressing talking points against wealth transfer taxes with little or no factual basis, and converting the estate and gift taxes into a direct tax on the recipients of large inheritances.

Why wealth transfer taxes
should be preserved and expanded

For those concerned about economic inequality, taxing wealth transfers is a critical policy tool, mitigating inequality in ways that other taxes cannot. Inheritances represent roughly 40 percent of all wealth40 and about 4 percent of annual household income.41 Bequests alone total about $500 billion per year.42

There are two types of inequality that policymakers should care about. The first is within-generation disparities in income, wealth, or other measures of economic well-being. Both income and wealth inequality are extremely high in the United States. The top 1 percent of households receives 15 percent of all income and holds 35 percent of all wealth.43 Wealth transfers increase within-generation inequality on an absolute basis (See Figure 1), but not on a relative basis. This is because of what economists call regression to the mean.44 Someone who earns $100 million per year, for example, is likely to have a child whose income is slightly lower, even including the child’s inheritance. Conversely, someone who earns $10,000 per year is likely to have a child whose income is slightly higher than her own.

Figure 1

But equally important is a second type of inequality: inequality of economic opportunity. A child whose parents earn $100 million will, on average, be radically better off than a child whose parents earn $10,000. The United States has one of the highest levels of opportunity inequality among its competitors.45 In the United States, a father on average passes on roughly half of his economic advantage or disadvantage to his son. Among most of our competitors, the comparable figure is less than one-third, and for several it is less than one-fifth.46

Delivering equitable growth

Previous article: Consumer credit, Kyle Herkenhoff and Gordon Phillips
Next article: Monetary policy, Alan Blinder

Financial inheritances worsen this inequality of life chances dramatically. Indeed, 30 percent of the correlation between parent and child incomes—and more than 50 percent of the correlation between the wealth of parents and the wealth of their children— is attributable to financial inheritances.47 This is more than the impact of IQ, personality, and schooling combined.

Increasing the progressivity of income and payroll taxes would go a long way toward addressing both of these types of inequality.48 But it would leave significant holes if not accompanied by stronger taxes on wealth transfers. Under current law, for example, if a wealthy individual bequeaths assets with $100 million in unrealized gains, neither the donor nor the heir ever has to pay income or payroll tax on that $100 million gain. In addition, the recipients of large inheritances never have to pay income or payroll tax on the value of inheritances they receive, whether attributable to unrealized gains or not.49

Some argue that any income or payroll tax previously paid by a wealthy individual on gifts and bequests they make should count as tax paid by the heir. But they are two separate people. When a wealthy individual pays his assistant’s wages out of after-tax funds, we don’t think the assistant has thereby paid tax on their own wages. In short, today the income and payroll taxes effectively tax unearned income in the form of inheritances at a zero rate.

Wealth transfer taxes play an important role in partially addressing this inequity of excluding inherited income from the income and payroll tax bases.50 But inherited income is still taxed at less than one-quarter of the rate on income from work and savings. (See Figure 2.)

Figure 2

A fairer tax system would tax income in the form of large inheritances at a higher rate than income from work. Recipients of large inheritances are better off than people who earn the same amount of money by working. In economist-speak, they have no “opportunity cost;” they have not had to give up any leisure or earning opportunities in order to receive the inheritance. All else equal, it is therefore fairer for them to pay more taxes, not less. But all else is not equal. Heirs of large inheritances also typically have a huge leg up in earning income if they choose to work—with access to the best education, influential family friends, interest-free or low-interest loans, and a safety net if they take risks that don’t pan out. This further strengthens the case for taxing inheritances at a higher rate.

More progressive income and payroll taxes cannot address this inequity in the tax system and ensure that large inheritances are taxed at higher rates than wage income.51 The same is true of proposals to adopt a tax on wealth as opposed to wealth transfers.

Importantly, bipartisan experts agree that wealth transfer taxes are largely borne by the heirs of large estates, not their benefactors.52 As a result, it would be more accurate to call wealth transfer taxes “silver spoon” taxes, not “death” taxes as their opponents prefer.

In addition to playing a critical role in making the tax system fairer, wealth transfer taxes are relatively efficient. It is an article of faith among estate tax opponents that wealth transfer taxes harm the economy because they discourage work and saving among very wealthy individuals. But in order to have these effects, the wealthy would need place a high value on the amount their heirs will inherit after-tax when making work and saving decisions. In fact, a large body of empirical research finds this is not the case, and that the amount that the affluent accumulate for wealth transfers is relatively unresponsive to the wealth transfer tax rate.53

People with very large estates typically have saved for multiple reasons. They may enjoy being wealthy, with the prestige and power that it confers while they are alive. They may have saved to have enough for their retirement needs, including unanticipated health expenses. And they may, of course, have saved to give to their children. But the empirical evidence to date suggests the first two motivations are so strong that the wealthy do not reduce their saving by all that much if they expect their estate to be taxed at a high rate. Put differently, a lot of the reason why people save is to have wealth while they are alive, which wealth transfer taxes do not affect.

Moreover, any negative incentive effects of wealth transfer taxes on wealthy donors are at least partially offset by their positive incentive effects on the next generation. Such taxes induce heirs to work and save more because heirs do not have as large an inheritance to live off of as a result.54 Wealth transfer taxes also improve business productivity. Several studies have found that businesses run by heirs perform worse because nepotism limits labor market competition for the best manager.55

For all these reasons, wealth transfer taxes may be more efficient than comparably progressive income and wealth taxes56—in addition to playing a unique role in mitigating inequality of economic opportunity.

How to strengthen
wealth transfer taxes

There are two main components of the wealth transfer tax system: the estate tax on bequests and the gift tax on wealth transfers made during life.57 In 2016, transferors are entitled to a lifetime exemption of $5.45 million ($10.9 million per couple). If their combined gifts and bequests exceed this threshold, the excess is taxed at a rate of 40 percent. Transferors also can exclude $14,000 in gifts each year to a given heir from ($28,000 per couple), meaning such gifts don’t even count toward the lifetime exemption. Currently only 0.2 percent of estates owe any estate tax.58

Option #1: raise the rate

The simplest way to strengthen wealth transfer taxes would be to raise the rate. Restoring the 2009 estate tax parameters (a $3.5 million exemption and a 45 percent rate) would raise $160 billion over 10 years.59 Also raising the rate to range from 50 percent to 65 percent to the extent that estates exceed $10 million to $1 billion would raise about $235 billion over 10 years instead.60

At a minimum, large inheritances should be taxed at the top marginal tax rate that applies to labor income—roughly 50 percent when one includes state and local income taxes.61 But a higher rate would be fairer and more efficient. The optimal tax rate on extremely large inheritances is estimated to be between 50 percent and 80 percent.62

Reducing the lifetime exemption amount also is worth considering, but it should be a lower priority. A higher rate focuses wealth transfer taxes on the wealthiest heirs and limits compliance costs.

Option #2: replace the estate and gift taxes with an inheritance tax

A more fundamental improvement would be to replace the estate and gift taxes with an inheritance tax. The lifetime exemption for the estate and gift taxes applies to the amount transferred, not the amount inherited by the heir. Suppose Richie Rich is an only child and receives $5 million in bequests from each of his parents and stepparents. Under current law, the $20 million he inherits is exempt from estate and income taxes because each bequest is under the exemption. But under an inheritance tax, the exemption would be based on how much he receives instead.

I propose requiring heirs of large inheritances to pay income tax plus an inheritance surcharge on amounts they inherit above a large lifetime exemption. If the lifetime exemption were $2.1 million and the surcharge were 15 percent (roughly equal to the maximum payroll tax rate) then such an inheritance tax would raise roughly $200 billion more over 10 years than the current estate tax. Dialing the rates up or the exemption amount down could raise more revenue. (See Figure 3.)63 To state the obvious, $2.1 million is a lot of money. An individual who inherits $2.1 million at age 21 can live off her inheritance for the rest of her life without anyone in her house ever working and, on average, her annual household income will still be higher than about 7 out of 10 American families.64

Figure 3

There are several advantages of an inheritance tax relative to an estate tax. First, it would more equitably allocate wealth transfer taxes among heirs. Both types of taxes are borne by wealthy heirs and not their benefactors. But not all large inheritances come from the largest estates, and some small inheritances come from relatively large estates.

In addition, the type of inheritance tax outlined here would apply different rates to heirs based on their total income. As a result, about 30 percent of the burden of the inheritance tax in dollar terms would fall on different heirs than under a revenue-equivalent estate tax.65 While roughly one-third of heirs burdened by the estate tax have inherited less than $1 million, none would owe any inheritance tax.66

These differences should not be taken as a fundamental critique of the estate tax. It is overwhelmingly borne by the recipients of large inheritances: Less than 4 percent of the revenue comes from individuals inheriting less than $1 million. Its burdens are just allocated among the recipients of large inheritances less precisely than under an inheritance tax.

A second, and perhaps even more important, advantage of an inheritance tax is that it could better align public understanding of wealth transfer taxes with their actual economic effects. The structure of an estate tax makes it easy for opponents to characterize it as a double tax on the frugal, generous entrepreneur who just wants to take care of his family after his death. In fact, nothing could be further from the truth. The estate tax is actually the only tax that that ensures wealthy heirs pay at least some tax on their large inheritances—even if at a much lower rate than their personal assistants. But this imagery is powerful. Perhaps as a result, most countries around the world that historically had estate taxes have repealed them, while those with inheritance taxes have not.67

The structure of an inheritance tax makes the inequities of our current system clearer. It simply requires wealthy heirs to pay income tax on their large inheritances just as all American workers pay tax on their earnings. Even with a surcharge, wealthy heirs would still typically pay a lower rate of tax on their inherited income than workers pay on a similar amount of labor income because of the large exemption, which workers cannot claim on their wages.

There are ancillary advantages of an inheritance tax as well. It would be simpler because it permits a wait-and-see approach for split and contingent transfers, rather than requiring taxpayers and the Internal Revenue Service to guess upfront what portion of the transfer will ultimately go to tax-exempt individuals or charities. At the margin, it could induce the wealthy to share their estates more broadly. And it is clearly administrable. Inheritance taxes are far more common than estate taxes cross-nationally.68

Option #3: repeal stepped-up basis

Regardless of whether the estate tax is expanded or replaced with an inheritance tax, policymakers should repeal stepped-up basis.69 This is the provision that completely exempts all accrued gains on bequeathed assets from income and payroll taxes, by “stepping up” the basis of asset to its fair market value when it is transferred.

President Obama has proposed repealing stepped-up basis, subject to several carve-outs including an exemption for the first $100,000 in accrued gains ($200,000 per couple).70 Together with raising the capital gains rate to 28 percent, this proposal would raise $210 billion over 10 years and significantly more over time as it fully phases in.71 While not technically an estate or gift tax reform, repealing stepped-up basis would accomplish all the same objectives as strengthening those taxes. It is highly progressive because inheritances are distributed so unequally and accrued gains are distributed even more unequally.72

The U.S. Department of the Treasury estimates that 99 percent of the revenue raised would come from the top 1 percent and 80 percent from the top 0.1 percent.73 It helps ensure that large inheritances are taxed at a rate closer to income from working. And it is highly efficient. Indeed, repealing stepped-up basis is even more efficient than raising wealth transfer tax rates because it reduces current law’s “lock-in” incentives to hold on to underperforming assets purely for tax reasons.

If repealing stepped-up basis is not an option then the next best solution would be to apply carryover basis to bequests.74 This would allow heirs to delay paying income tax on accrued gains on their inheritances indefinitely. But heirs would at least need to pay the associated income tax when they ultimately sell the asset. As a result, it would reduce lock-in incentives, but not by nearly as much as stepped-up basis repeal. It would also raise significantly less revenue.75

Option #4: broaden the wealth transfer tax base

A number of smaller reforms to broaden the wealth transfer tax base should also be pursued. Many of these proposals, such as limiting gaming around grantor-retained annuity trusts, are in President Obama’s budget. Together, these budget proposals would raise $17 billion over 10 years.76 The next President should also finalize the current Administration’s recently issued regulation addressing loopholes using valuation discounts, and ensure that Congress does not repeal it.77

An additional option worth considering is harmonizing the tax treatment of gifts and bequests. Currently gifts are often tax-advantaged because of the annual gift tax exclusion, the lack of present-value adjustments when calculating the lifetime exemption, and the fact that the top rate on very large gifts is effectively 29 percent, compared to 40 percent for bequests.78 Cutting the other way, bequests are tax-advantaged because they are eligible for stepped-up basis while gifts are not. These countervailing incentives create substantial tax planning costs, traps for the unwary, and inequities between similarly situated heirs. These problems could be largely addressed by repealing stepped-up basis, indexing the value of gifts to a market interest rate when calculating the lifetime exemption, and taxing gifts at the same rate as bequests.79

Option #5: address strawman arguments against wealth transfer taxes

Finally, policymakers should consider addressing talking points against wealth transfer taxes that resonate but have little or no basis in fact. A prime example is family farms. A principal rallying cry against the estate tax has long been that it forces families to sell their farms. But neither the American Farm Bureau nor The New York Times has been able to identify a single instance of this happening, even when the exemption was much lower.80

To counter this argument, one option is to adopt the proposal by former Senate Finance Committee Chairman Baucus (D-MT) to allow taxpayers to defer indefinitely any estate tax payments due on farm land at a market interest rate, provided the farm continues to be actively managed by the family.81 Because it is so rare for such farms and ranches to be subject to the estate tax, the proposal would only cost $5 billion over 10 years.82

To be clear, this proposal should only be considered if it is includes all the guardrails in the full Baucus proposal and interest accrues at a market interest rate. Otherwise, it could become a large loophole and reduce the number of farms owned and actively managed by families as opposed to passive investors in large corporations.

Conclusion

Wealth transfer taxes play a critical role in mitigating economic disparities, especially inequality of opportunity. The proposals offered here would soften the relative advantages of being born at the very top while leaving more than 99 percent of financial gifts and bequests unaffected.83

At the same time, these reforms options would raise a significant amount of revenue that could be used to mitigate the barriers to economic mobility that children from low- and middle-income families face. Effectively, they could fund a form of social inheritance through investments that partially make up for such families being unable to fund large financial wealth transfers to their children. The hundreds of billions of dollars raised could be used to fund universal pre-Kindergarten, expand the child tax credit for low- and middle-income working parents with young children, or increase the wage subsidy provided by the Earned Income Tax Credit for childless, frequently young adults. These proposals are estimated to significantly improve infant health, heighten academic achievement, boost labor force participation, and increase lifetime earnings for children from relatively disadvantaged backgrounds.84

President Franklin Delano Roosevelt once said “inherited economic power is as inconsistent with the ideals of this generation as inherited political power was inconsistent with the ideals of the generation which established our government.” The same could be said today. Rather than falling near the bottom among our competitors on this score, we can recommit to creating a society where one’s financial success depends relatively little on the circumstances of one’s birth. A first step is to start taxing extraordinarily large inheritances like we tax good, old hard work.

(I am grateful to Len Burman, Michael Graetz, Chye-Ching Huang, and Wojciech Kopczuk for helpful suggestions. All errors are mine.)

Working by the hour: The economic consequences of unpredictable scheduling practices

Overview

Many workers in the United States are at the mercy of unpredictable scheduling practices, often facilitated by new technologies where computer algorithms create employee schedules based on projected consumer demand. Unpredictable schedules can be found in many occupations but are most common in retail and service industries—the very industries in which workers also face a lack of benefits, poor working conditions, and insufficient pay. For many, unpredictable schedules are caused by “just-in-time” scheduling software, which seeks to match the correct number of workers with demand but wreaks havoc on workers who have no control over a schedule that changes from day-to-day, or even hour-to-hour. This issue brief examines the economic and legal context in which unpredictable scheduling became popular, and then looks at the consequences for individuals, firms, and the broader U.S. economy.

Download File
Working by the hour: The economic consequences of unpredictable scheduling practices

Read the full PDF in your browser

Introduction

The growing stratification of income and wealth is a well-established problem within the United States, yet control over one’s time is an often overlooked form of inequality that affects millions of Americans. Unpredictable schedules, characterized by little to no control over one’s work hours, and erratic, on-call, or rotating shifts are increasingly common for workers up and down the income ladder. There are lots of reasons for these practices. The Internet means that some professional, white-collar workers can be “home” yet still monitor their email at all hours. Doctors and nurses often stay late to finish paperwork or finish up with a patient and are often on-call.

Unpredictable schedules, however, are more often a symptom of a business model in the retail and service industries that treats labor only as a cost to be contained rather than a source of productivity and competitive advantage. Many employers have implemented so-called “lean labor strategies” or “workplace optimization systems,” which seek to align the number of staff at work at any given time with consumer demand in as close to real time as possible. This strategy is made possible by “just-in-time” scheduling software, now common in the low-wage retail and service industries. This software uses computer algorithms to generate schedules finely tuned to predicted consumer demand, accounting for factors such as time of day, weather, the season, or even a nearby sporting events. In doing so, these practices seek to ensure that businesses optimize the number of workers on hand on an hourly—or even shorter—basis.85

Unpredictable scheduling practices shift the risk of doing business away from firms and onto workers and their families. In doing so, workers end up with little—or no—control over their time. At first glance, this strategy may appear to make good business sense. But in practice, there is evidence for variety of negative economic ramifications for families, firms, and the broader U.S. economy. Unpredictable schedules affect who can take these jobs and how productive workers may be on-the-job, both of which have an impact on business profits. Families experience fluctuations in income, diminishing their ability to buy goods and services, which affects both family well-being and overall economic demand. Unpredictable scheduling practices also prevent workers from being able to plan other aspects of life—everything from childcare to attending school or taking a second job—all of which have measurable negative effects on family life and children’s outcomes as well as our economy more generally.

There are a variety of options for policymakers and businesses that could not only improve on-the-job productivity, but also help families function—options that are good for our current and future economy alike. Lawmakers are beginning to take notice. After San Francisco enacted the Retail Workers Bill of Rights in 2014 restricting employers’ ability to impose unpredictable and last-minute schedules on their employees, 18 different states and municipalities introduced similar work-hour legislation in 2015.86 Following a yearlong inquiry into retailer’s use of on-call scheduling, New York Attorney General Eric Schneiderman recruited attorney generals from eight states and the District of Columbia to open their own investigations this year. In response, six major retail brands so far have agreed to end their on-call scheduling.87

While these local actions are an important first step, millions of workers remain subject to unpredictable scheduling practices because there is not yet a federal law governing schedule predictability. The Schedules That Work Act, introduced in 2015 by Senator Elizabeth Warren (D-MA) and Representative Rosa DeLauro (D-CT), addresses schedule predictability on a national level. If passed, it would encourage scheduling predictability by granting workers employed at firms with 15 or more employees the right to request a flexible schedule.88 Any effective policy also must address enforcement issues because the laws that do exist at the state and local level are too often unenforced, especially among employers of low-wage workers.

What do we know?

There is growing evidence that unpredictable schedules are widespread and increasingly common. Because the U.S. Bureau of Labor Statistics does not regularly track these kinds of scheduling practices, it’s difficult to know precisely how the prevalence of unpredictable scheduling nationwide has changed over time. Empirical work from a variety of sources, however, shows that these practices are widespread, especially within the retail, restaurant, transportation (airline travel and package delivery), and hospitality (hotels and catering) sectors of the economy.89

A 2015 report by Pennsylvania State University-Abington’s Lonnie Golden found that, as of 2010, 10 percent of the overall workforce deals with an irregular work schedule or on-call shifts. Golden admits, however, that this estimate is a conservative one, as the data he uses from the General Social Survey (compiled by NORC at the University of Chicago) is likely to underreport the incidence of “irregular” work schedules.90 Golden’s research also finds that low-income workers are much more likely to have irregular or on-call hours, and that working part-time more than doubles a workers’ chance of having “variable hours.” Other research also finds that the majority of part-time workers face weekly or monthly fluctuations in work hours that were not due to illness, overtime, or vacation—even before the Great Recession of 2007-2009.91

University of Chicago’s Susan Lambert, Peter J. Fugiel, and Julia Henly worked with the U.S. Bureau of Labor Statistics to add questions about schedules to another data set, the National Longitudinal Study of Youth. They find that more than a third of “early career” employees are given a week or less advance notice of their schedules. Among those surveyed, short notice is more common among part-time workers (47 percent) compared to full time workers (39 percent).92 These data also shows that among young workers, those who are low-income are most likely to have unpredictable schedules. While 57.1 percent of young professional workers know their schedules a month in advance, the same is true for only 34.0 percent of young workers in low-income families.93

Researchers at the JP Morgan Chase Institute recently examined scheduling practices by looking at a sample of data from the customers of its parent company, JP Morgan Chase & Co, the largest U.S. bank. The institute finds that more than half—55 percent—of its sample experienced more than a 30 percent month-to-month change in total income. Over half of that volatility—53 percent—was from labor income, mostly (86 percent) from people who have not changed jobs. According to the institute’s analysis, changes in hours worked, bonuses, or other earnings factors account for 72 percent of the change in paychecks within a specific job (and the rest was due to 5-week months).94

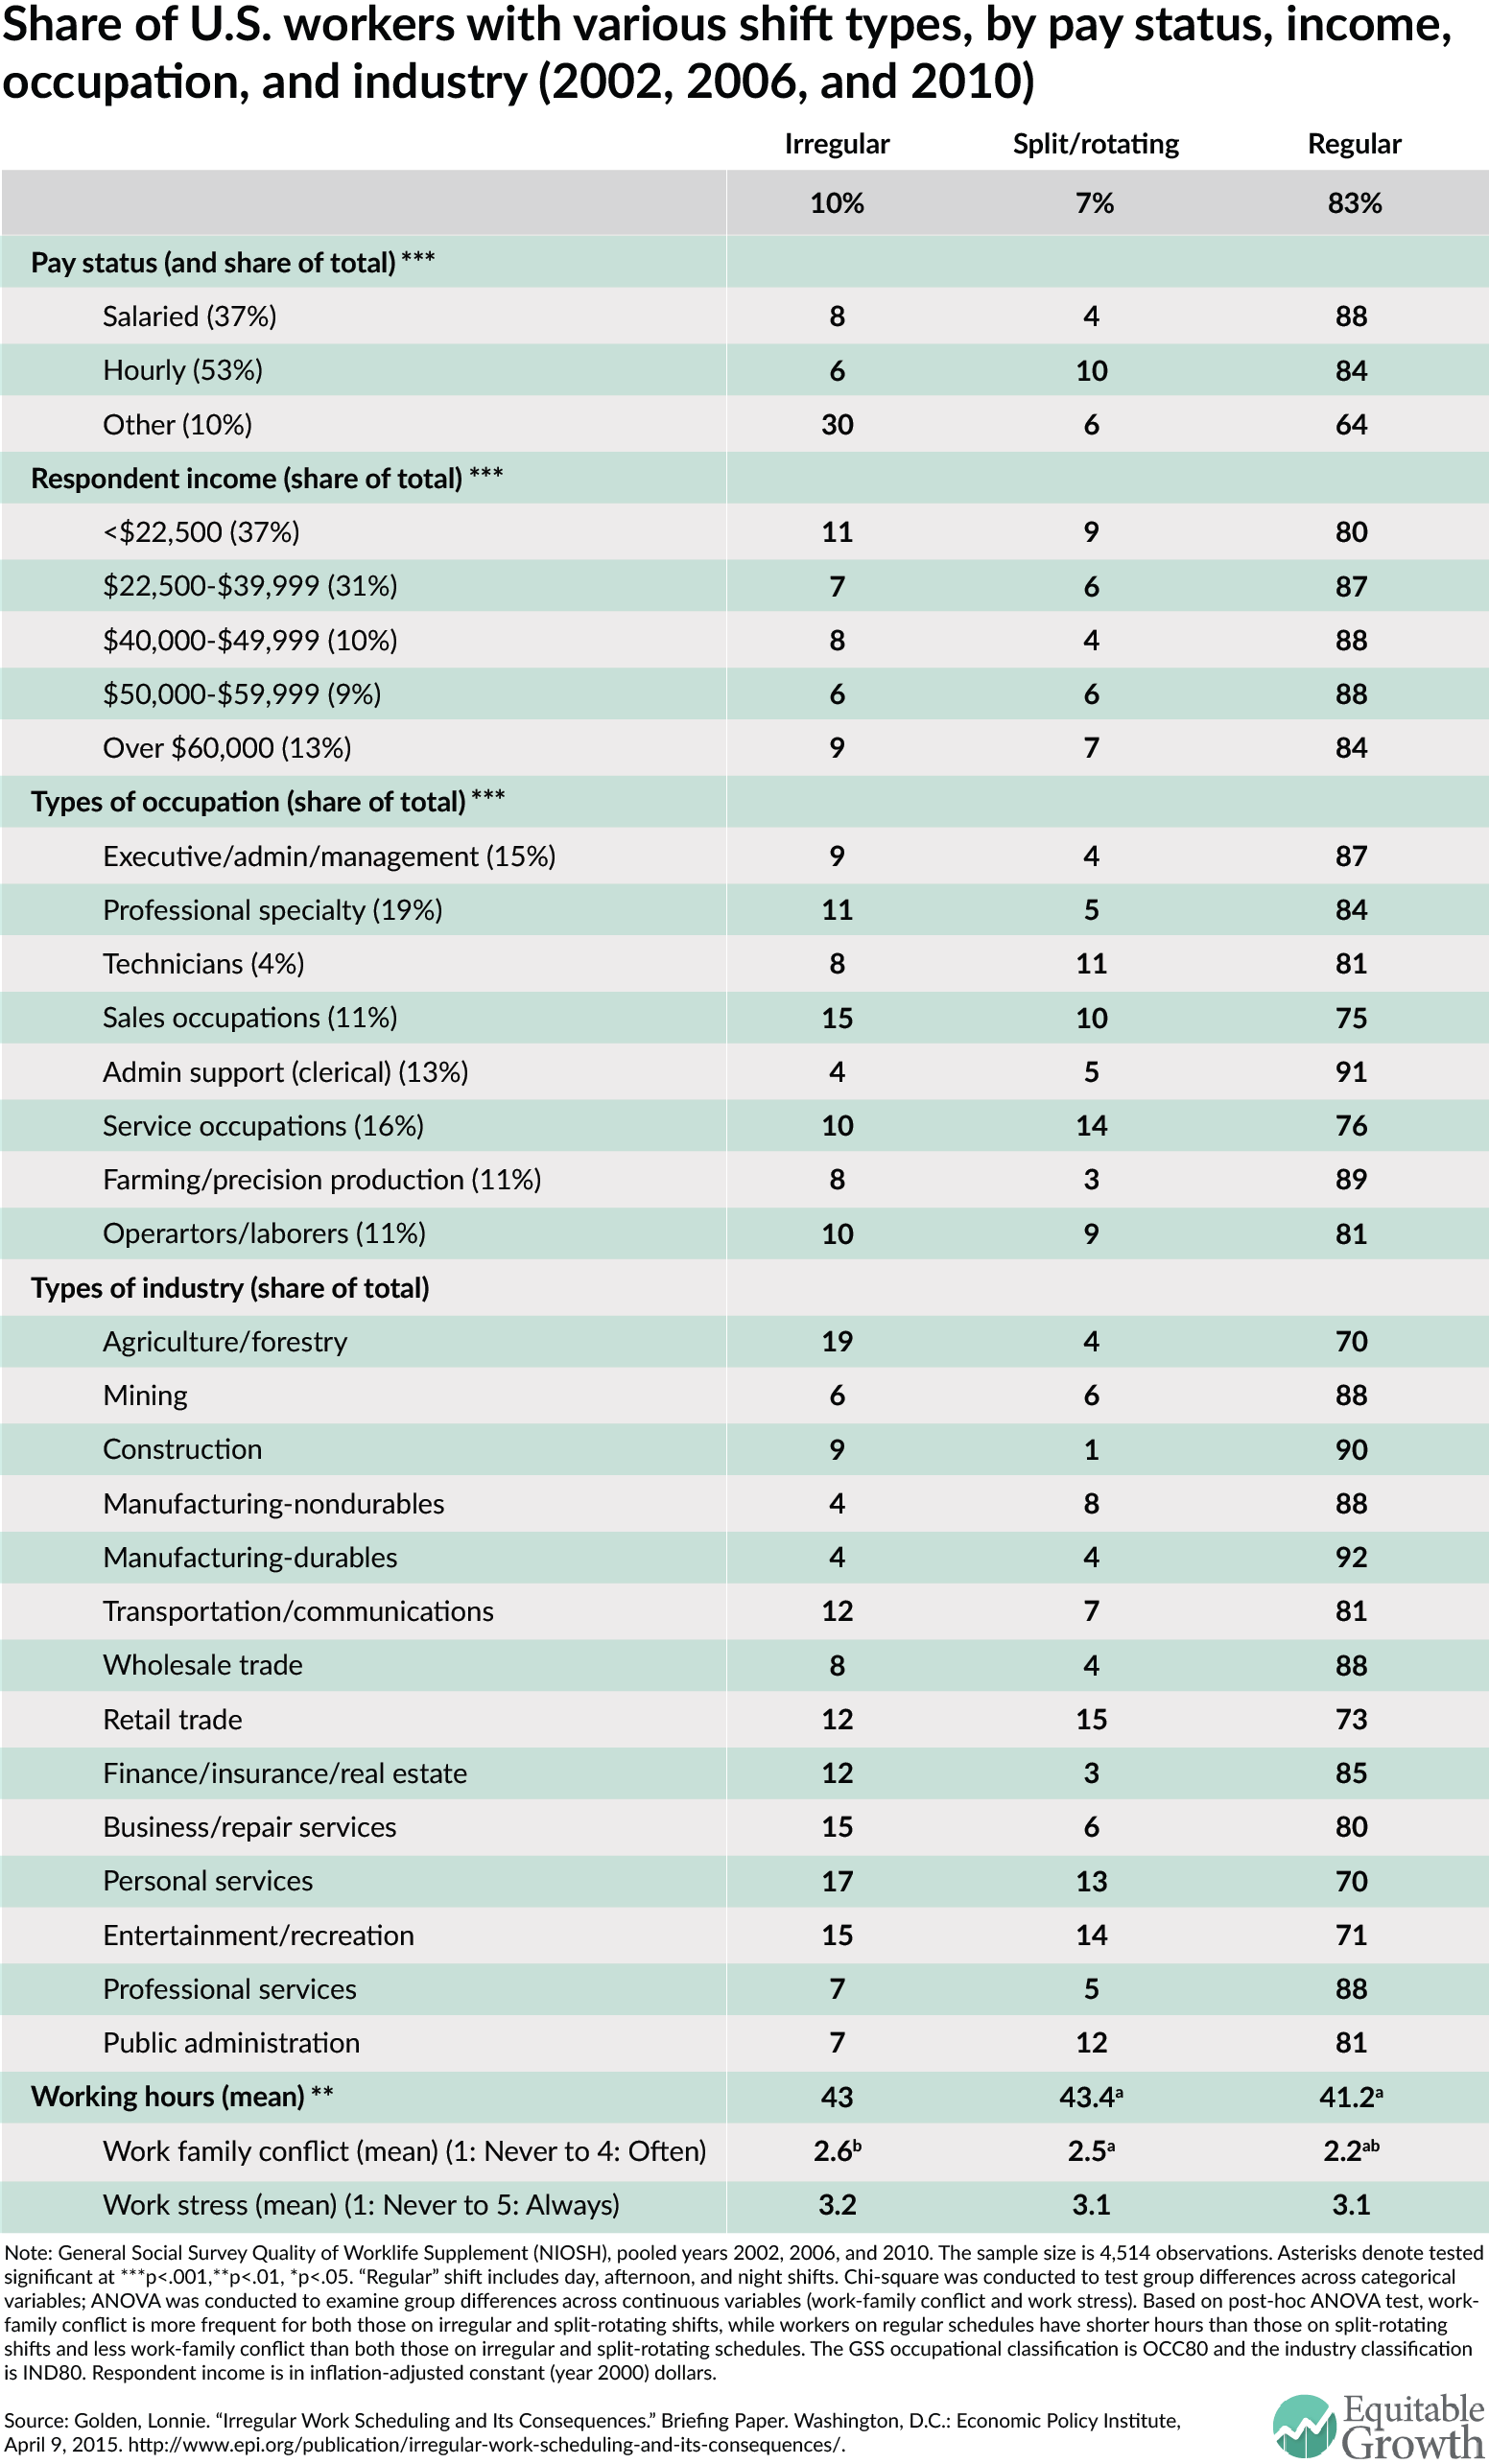
Scheduling practices vary across industries, which means that the share of workers with variable workweeks also varies across industries. Agriculture/forestry, personal services (which include occupations such as childcare and eldercare workers, hairstylists, personal trainers, and tour guides, among others), business/repair services, retail trade, and entertainment/recreation have the highest share of workers with irregular work hours. Professional services, public administration, mining, and manufacturing have the lowest.95 (See Table 1.)

Table 1


Because of the variance in scheduling practices across industries, many studies look at a specific industry. Julia Henly of the University of Chicago, Elaine Waxman of the Urban Institute, and H. Luke Shaefer of University of Michigan, found that 60 percent of retail employees interviewed said that their schedules changed “a lot” or a “fair amount” during a given week.96

  • An analysis of 2012 New York City retail workers by Georgia State University College of Law’s Charlotte Alexander and University of Wisconsin-Madison’s Anna Haley-Lock, which found that 55 percent of workers were given no more than a week’s notice of their schedules. These workers reported average fluctuations in work hours of 12-to-16 hours from week to week.97
  • A study of 6,000 retail workers led by Jennifer Swanberg of University of Maryland and Jacquelyn B. James of Boston College found that 59 percent of surveyed workers faced weekly changes in work days and shift times.98
  • An analysis of the 2008 National Changing Workforce Study by Liz Watson of the National Women’s Law Center and Jennifer Swanberg at the University of Maryland found that 20 percent to 30 percent of workers see their hours reduced during slow periods.99
  • A recent study of 436 Washington, DC restaurant and retail workers found that nearly half of the employees reported learning of their schedule less than one week in advance, a third received less than three-days notice, and a third of restaurant workers got less than 24-hours notice.100

Taken together, this research clearly demonstrates that unpredictable scheduling practices are sufficiently widespread to concern policymakers, especially given the burden they impose on the low-income workers and especially hourly employees. Families need these jobs and it poses a significant challenge to schedule their lives around unpredictable schedules. Further, unpredictable schedules are occurring in industries that are fast-growing, so without intervention, these trends may become more common for more workers. According to the U.S. Bureau of Labor Statistics, both retail sales positions and food preparation and serving positions are among the top five occupations predicted to add the most new jobs in the next decade.101

One reason that unpredictable schedules are so common is employer’s use of just-in-time scheduling software, which allows managers to adjust—and readjust—employees’ schedules during the week, day, or even in the middle of a worker’s shift. The software can break down schedules in 15-minute increments, meticulously paying attention to even the smallest fluctuations in store traffic, shaving minutes off an employee’s shift if need be.102 In practice, this often means that managers do not post schedules until they are certain of the number of hours they have to give out (determined by upper management), and the managers’ bosses seek to contain costs by holding them accountable for “staying within hours.” It also leads managers to cut scheduled hours if they have gone over their allotted budget for labor costs earlier in the week.

Of course, computer algorithms are not the only factor leading to unpredictable schedules. In fact, many of the scheduling software systems include forecasting functions that could allow workers greater input, generating more stable schedules overall. The problem is that many employers do not choose to implement the features that would provide greater schedule stability and predictability.

Furthermore, some employers require workers to remain on-call, keeping their schedules free on the chance their employers may need them. Combined, these scheduling practices mean that many workers often have little or even no advance notice of their schedules.103

Just-in-time and lean scheduling practices were first developed by the Japanese automobile industry in the 1950s to “eliminate waste” by supplying parts only as needed and when the process required it.104 In the manufacturing sector, that meant cutting down on the amount of warehouse inventory and “produc[ing] goods ‘just-in-time’ to meet customer demand.”105 Over time, the just-in-time philosophy was adapted from the production of goods to the management of companies’ workforce schedules. Walmart Stores Inc. was an early adopter in 2007, allowing managers at the giant retailer to choose employee hours based on day-to-day sales.106 Other employers soon followed suit. Today, the practice is especially widespread in the low-wage service industry, including restaurants, retail, hospitality, and care sectors, where just-in-time scheduling seeks to eliminate “excess labor” instead of the “excess inventory” of its production counterpart.107

Are these practices successful? Looking at only short-term labor costs, these practices can slash costs. The chief financial officer at Jamba Juice Company, for example, told investors in the retail health drinks maker that just-in-time scheduling helped the company cut labor costs by 4 percent to 5 percent, saving millions of dollars.108 But that doesn’t take into account the hidden costs, both for firms and the economy as a whole. It is not uncommon for workers subject to on-call shifts to be called in even when they were not scheduled to work, or to arrive at work for a scheduled shift only to be sent home without pay.109 This is particularly burdensome for low-income workers, considering that they spend a disproportionate amount of time and income on commuting compared to those further up the income ladder.110

There is still much to learn about unpredictable schedules in terms of the individuals and occupations that they affect. While many scholars are researching this topic, a lack of high-quality data hampers their ability to gain a comprehensive understanding. A good place to start in the public policy arena would be to continue to include questions about schedule predictability in our nation’s regularly conducted surveys.

Unpredictable schedules: The full economic implications

A growing body of literature spanning academic disciplines documents how broad changes in economic, social, and political institutions over the past 40 years transformed the organization of work. The service and care sectors, for example, have grown significantly since the 1960s as many women looked for employment outside the house, fueling the demand for many personal services that were previously done in the home, such as cleaning, cooking, childcare, and caring for the aged or sick.111 Retailers soon expanded their hours into the evening and weekends, as their traditional 9-to-5 hours meant missing out on business from a large share of the working population. The rise of dual-earner families’ income also meant the upsurge in popularity for night and weekend entertainment and recreation.112 Today in large cities it is no longer an oddity to find 24-hour restaurants, gyms, stores, delivery services, or even spas.

Many of these employers rely on just-in-time schedules while also paying low wages, providing few if any benefits, using temporary workers, and sometimes sub-contracting entire operations—manifestations of a “low-road” business strategy.113 This model may have short-term benefits for a particular employer, but it also has costs and hidden—and harmful—short- and long-term ripple effects on these firms and throughout our economy by

  • ignoring the hidden costs and labor demand issues, such as turnover and absenteeism;
  • negatively affecting the relationship between labor and productivity and profitability, especially in service industries;
  • transferring the risk of doing business to workers and their families, which in turn reduces family income and disproportionately affecting women and people of color; and
  • adversely affecting the quality of workers and overall U.S. labor supply, which inflicts measureable harm on the next generation of workers.

We examine each of these consequences in turn.

The hidden costs of unpredictable scheduling, such as turnover and absenteeism

Employers frequently require full-time availability to ensure there are always enough workers during busy periods, but then fail to give full-time hours. But once employed, many low-wage employees—especially those with care responsibilities—are fired or forced to quit in favor of seeking a job that provides more hours or has more flexibility. This approach treats workers’ time as simply another variable in a cost equation, yet it can create problems by undermining productivity and sparking higher turnover.114 University of Chicago’s Susan Lambert and Julia Henly surveyed 139 retail stores from 2007 to 2008 and found that a substantial share of both full- and part-time employees leave their job in the course of a year: 73.8 percent of full-time employees and 107.3 percent of part-time employees. The store managers themselves report unstable, inadequate hours and meager wages as the main reasons their employees leave.115

Turnover is not only disruptive to workers but also costly to employers. Research demonstrates that replacing workers is expensive, regardless of how much they get paid, because selecting, recruiting, and training new workers requires managers and new employees to take time away from their primary responsibilities. Even once new workers are trained, their lack of experience means that they aren’t as familiar with their duties or may not be as committed to the organization compared to workers with longer tenure, both of which affect a company’s productivity and turnover rate.116

High turnover also affects business operations more generally. It requires employees and managers to focus their energy on new employees rather than engage in other more profit-generating activities, such as improving customer service or product quality.

These costs come into telling perspective once they are quantified in numerical terms. A report by Equitable Growth’s Heather Boushey and Sarah Jane Glynn of the Center for American Progress found that across a variety of studies, research shows that it costs about one-fifth of a worker’s annual salary to replace that worker regardless of the salary paid on the income spectrum.117 And a study by Cornell University’s Rosemary Batt and Jae Eun Lee, and Ohio State University’s Tashlin Lakhani finds that the costs of employee turnover within a small, moderately priced restaurant of 30 employees total about $18,200 per year. That suggests that a large company with 100 restaurant locations could lose $1.82 million annually due to turnover costs.118

This reality is already clear to many employers. George Kelsey, the director of training for Culver Franchising System Inc, a Midwestern fast-food restaurant chain, estimates the cost of turnover to be about $1,000 per employee across Culver’s establishments. Kelsey reports that while many companies often fail to fully account for these costs, focusing primarily on labor expenses, “we treat high turnover costs the same as high labor costs.”119

The relationship between scheduling, predictability, and profitability

Unpredictable schedules create other problems that can eat into profits, including poor customer service and persistent understaffing. Many firms tend to view labor as a “cost-driver” rather than a “sales-driver,” and thus concentrate on curtailing costs. But research shows that cutting corners in terms of staffing affects profits and productivity.120 So why do retailers do it? The financial benefits to reducing labor costs are, as Massachusetts Institute of Technology professor Zeynep Ton says, “direct, immediate, and easy to measure, whereas the less desirable effects are indirect, long term, and difficult to measure.”121

That means unpredictable schedules and the resulting high turnover may actually be counterproductive, depressing sales because of poor customer service. Joan Williams, founding director of the University of California’s Hastings Center for WorkLife Law, says that “new employees do not have a strong grasp of the product and a high level of commitment to the organization.”122 In the short-term, this could mean customers leaving without buying anything, or losing regular consumers to competitors. In the long term, social media websites such as Yelp, Facebook, and Twitter have made businesses more worried than ever about how word-of-mouth may damage their reputation.123

Firms also do not account for how persistent understaffing eats into profits. Store traffic can be unpredictable, making some overstaffing or understaffing inevitable. But many corporations hold managers accountable for containing labor costs, and give them a specific allocation of work hours that managers are allowed to distribute to employees. Under pressure to “stay within hours,” managers may schedule too few workers to meet customer demand. Problems with understaffing at Walmart, for example, have led to a widespread airing of grievances against the store not only from customers but also from employees. Walmart employees have reported how persistent understaffing resulted in problems such as long lines, throwing away unstocked inventory, and missed sales opportunities.124

Recent research quantifies these losses. Vidya Mani of Pennsylvania State University, and Saravanan Kesavan and Jayashankar M. Swaminathan, both of University of North Carolina’s Kenan-Flagler School of Business, surveyed 41 stores of a large retail chain, finding “systematic understaffing during peak hours.”125 The effect was a 7.0 percent decline in profitability. Overstaffing, in contrast, only reduced profitability by 1.1 percent.126 Research by Massachusetts Institute of Technology professor Zaynep Ton and Harvard Business School’s Ananth Raman supports these findings. Looking at data from over 250 stores of the Borders bookstore chain, Ton and Raman found that a one-standard-deviation increase in labor levels at an individual store boosted profit margins by 10 percent over the course of the year.127

Many managers are aware these scheduling systems harm the company profitability. Yet the pressure  to “stay within hours” makes it difficult for managers to fulfill their companies’ business objectives. Under pressure to meet short-term performance requirements, some feel forced to cut employee hours in the face of declining sales—even when they know that doing so may be costly in other respects.

While minimizing employee costs as a way to maximize profits is one model of productivity, it is not the only way to boost a company’s bottom line. Companies such as Costco Wholesale Corp., Trader Joe’s Co., and QuikTrip Corp. all successfully operate under the philosophy that investing in labor through higher wages, better schedules, and increased training can improve the bottom line. Doing so enhances operational efficiency and customer service, which boosts profits.128

Unpredictable scheduling transfers business risks to workers and their families, disproportionately affecting women and people of color

A healthy economy requires people not only to serve as workers within these businesses but also to create strong consumer demand for the goods and services that these businesses supply to the marketplace. Workers with unpredictable schedules also experience volatility in the number of hours they work—and, for hourly workers, volatility in income. For middle- and high-income workers with unpredictable schedules, that often means longer workweeks or mandatory overtime. Volatility in hours for low-wage workers means that some weeks they may not be able to work enough hours to cover even the most basic expenses.129 Unpredictable schedules can also prevent workers from achieving upward mobility because many are not able to maintain a long-term financial plan that could help them plan for retirement or save for an education.

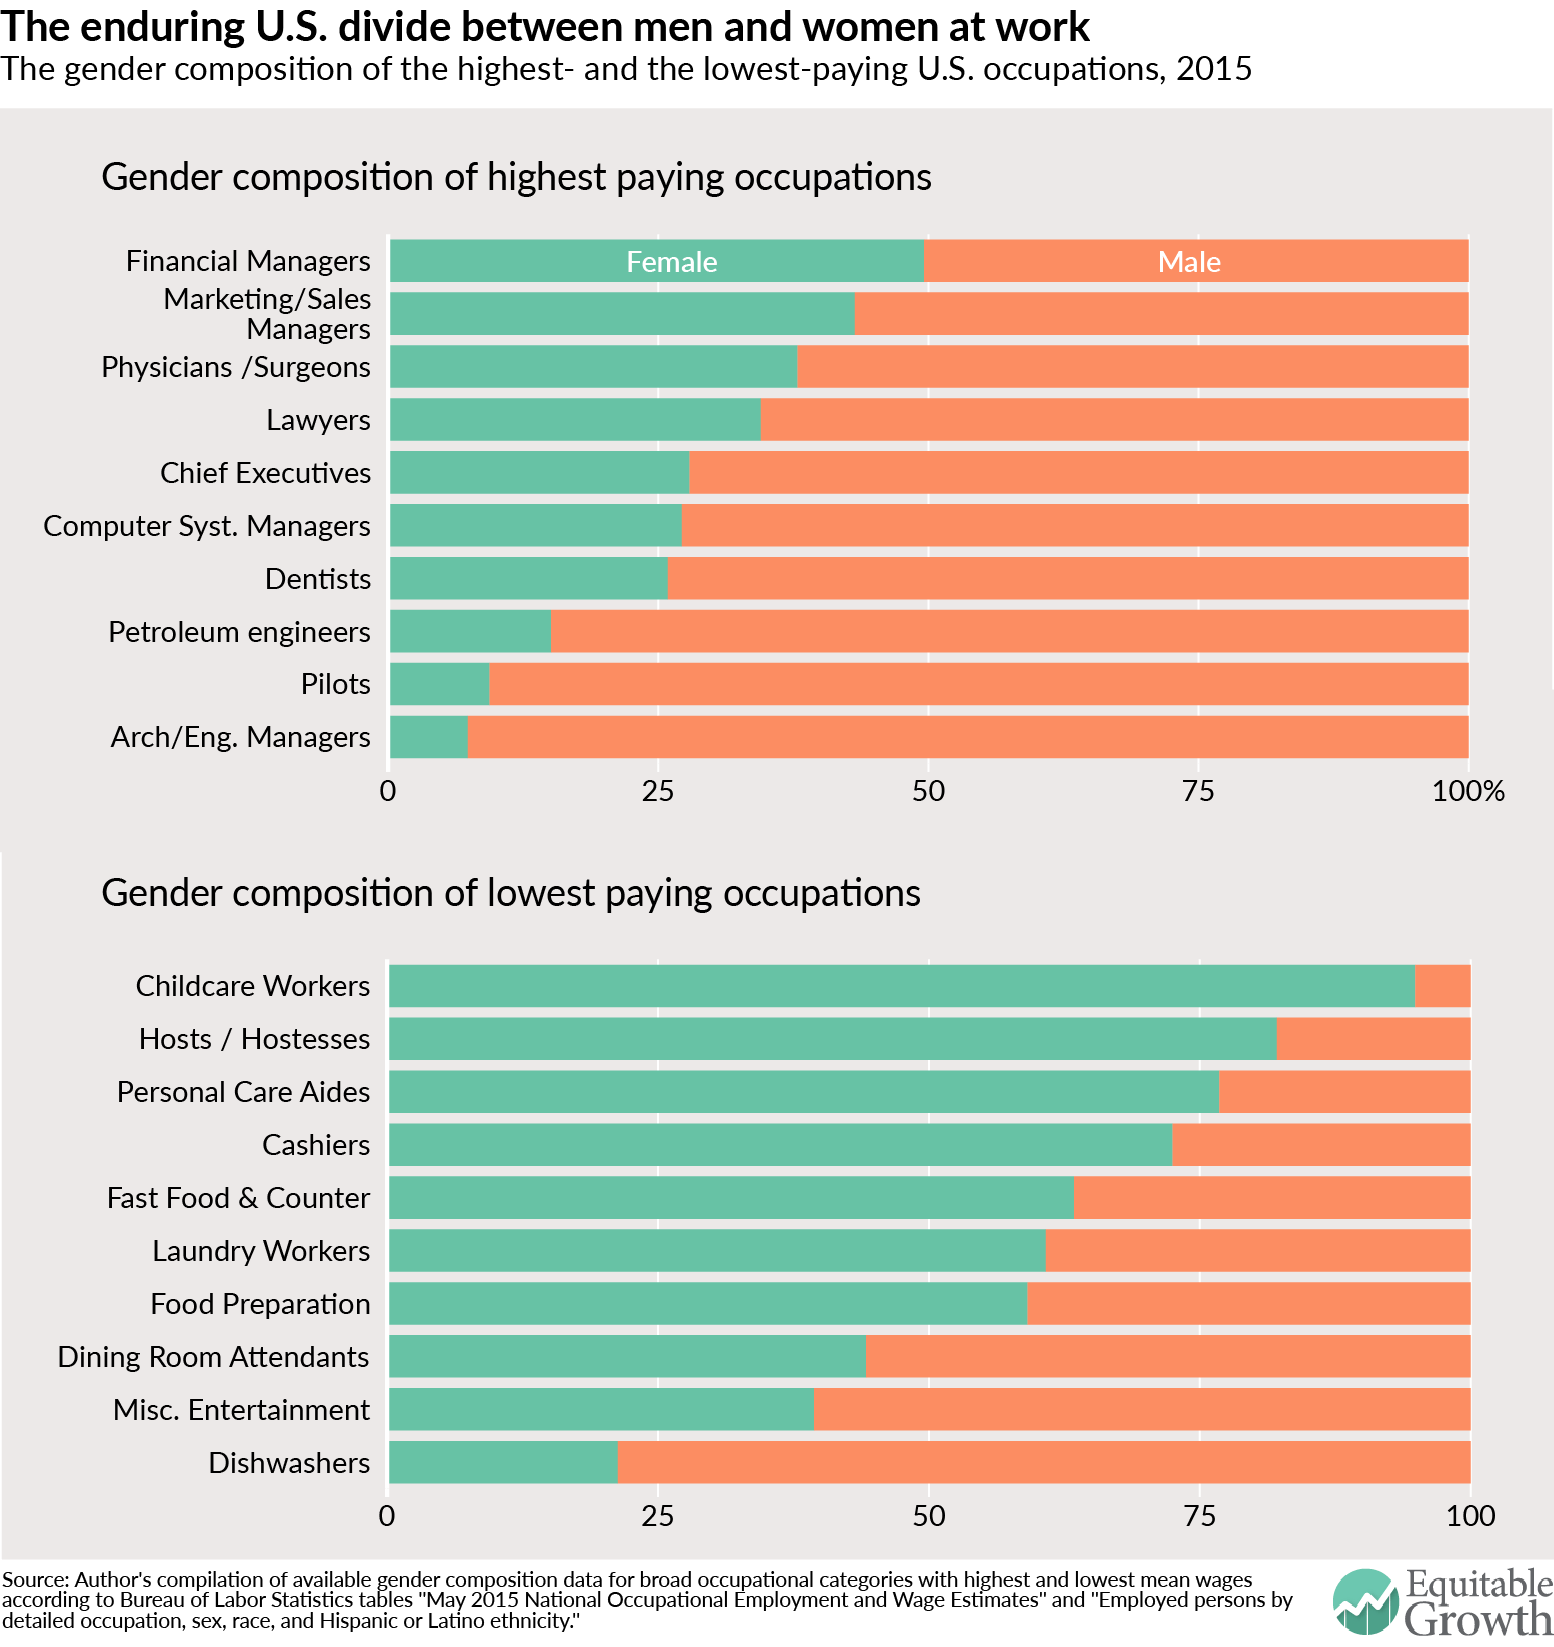
The consequences of unpredictable schedules fall harder on women, perpetuating existing gender inequities. The demographic makeup of the retail and restaurant industries, in which unpredictable scheduling practices are frequently found, largely mirrors the overall labor force.130

Racial inequities also are widespread within these industries, leaving workers of color—especially women—and their families bearing the brunt of the economic and family consequences of unpredictable scheduling practices. A study released by the non-profit organization Demos and the National Association for the Advancement of Colored People found that black and Latino retail workers are sorted into the low-paid positions most likely to involve erratic scheduling and inadequate hours despite sharing similar levels of education and age as their white counterparts.131 It is no surprise, then, that in a survey of early career retail workers by Susan Lambert and Julia Henly, along with their University of Chicago colleague Peter J. Fugiel, the researchers found that 49 percent of blacks and 46 percent of Latino workers received their hours with a week or less of notice, compared to 41 percent of workers overall.132 Non-white workers also tend to face longer commute times compared to their white counterparts, which means greater costs in terms of time and money when they travel to work only to be turned away.133

The consequences for black workers are compounded because they are more likely than members of other major racial or ethnic groups to be the sole contributor to household income, exacerbating the hardships triggered by unpredictable and insufficient paychecks.134 Those with children may have to pay for childcare, even when they themselves did not get paid. While there are managers who understand and are responsive to their employees’ needs, a study of low-income workers found that many managers treat their workers’ inability to balance their work and home lives as a personal failing, rather than a structural issue. These managers believed that their employees used the “sick kid” excuse too often, and were instead disorganized, lazy, and lacking in work ethic.

These charges of “irresponsibility” have implicit racial overtones, mirroring stereotypes of African Americans and other minority groups as lazy. In interviews with managers in two separate studies, Boston College’s Lisa Dodson and her co-authors recorded some managers who implied that employees who wanted more schedule input were reckless for having children in the first place.135 This research contrasts other studies of elite, primarily white workers who are lauded for putting their children first.136

Insufficient hours and the highly variable incomes can have implications for government spending as either may render workers ineligible for government benefit programs such as Temporary Assistance for Needy Families, time off under the Family and Medical Leave Act, unemployment insurance, or certain childcare subsidies. Childcare subsidies, for example, may require that the family consistently use childcare, which may be impossible with an unpredictable schedule. And, to the extent that unpredictable schedules contribute to income volatility, it may be one piece of the puzzle of how to address homelessness among the working poor. In New York City, for example, more than one out of every four homeless families (28 percent) include an employed adult, and 16 percent of single adults living in shelters are employed. These workers are majority female and tend to work in low-wage jobs where unpredictable schedules are common, such as security guards, home health aides, and sales clerks.137

Erratic scheduling practices affect the quality of our workers and overall labor supply

Unpredictable scheduling may lessen workers’ ability to be fully productive or result in a reduction in the quality of workers who are able to take these jobs. Employers who give workers no control over schedules end up hiring only those who at least claim they have no scheduling constraints.

If employers only look for workers who have no other obligations except to be on call for hours, then they must find a pool of job applicants without outside obligations such as family, school, or even a second job. This is not the world most people live in and goes a long way toward explaining why unpredictable schedules are associated with high rates of absenteeism. Many parents need some flexibility to address day-in, day-out conflicts; one study found that within a single week, 30 percent of low-income workers disrupted their work schedules because of family obligations.138 If caregivers cannot find good jobs with good schedules then they may feel forced to leave their jobs. In fact, low-wage women are more likely to drop out of the labor market compared to those in the middle class, upending the notion that only relatively wealthier women become stay-at-home parents. Thirty-four percent of stay-at-home mothers live in poverty, compared to 12 percent of working mothers.

The inability of many low-income workers to balance the demands of work and home lives is having a profound impact on the economy. The United States has seen its labor force participation rate decline significantly since 2000, dropping from No. 7 among 24 member countries of the Organization for Economic Cooperation and Development to No. 21 today. The participation rate of women, who still bear the majority of care responsibilities, has suffered in particular. Francine D. Blau and Lawrence Kahn of Cornell University find the lack of employer and policy supports for parents balancing work and care responsibilities to be a major factor in this phenomenon.139

Unpredictable schedules harm the next generation of workers

Economists all agree that human capital—the knowledge, skills, and talent in our potential workforce—is a critical factor for economic growth. By not investing in today’s children, we place our future economic productivity at risk.140 Isolating the effect specifically of unpredictable schedules on children’s outcomes is difficult, but there is evidence that this practice has negative consequences for families and children.141

For parents—and women in particular—unpredictable schedules can make it impossible to secure care for their children, even if they can tap childcare subsidies. Finding affordable and high-quality childcare can be challenging even for parents further up the income spectrum. Low-income parents coping with unpredictable schedules have the combined challenges of meager wages and unpredictable schedules, and usually end up piecing together informal care arrangements because it is difficult to access childcare subsidies, even if they are available.142

Erratic and nonstandard schedules are associated with negative behavioral outcomes for children. These children tend to have poorer health, do less well in school, report low self-esteem, and engage in risky or delinquent behavior. One study by New York University’s Wen-Jui Han found that toddlers of parents who work nonstandard schedules have worse skills such as memory, sensory perception, learning, problem solving, verbal communication, and expressive language.143 Another study by Pamela Joshi of Harvard University and Karen Bogen of University of Massachusetts-Boston found that preschoolers whose mothers worked nonstandard schedules had higher rates of negative behaviors such as depression, anxiety, withdrawal, and aggression.144 These problems are especially serious for African American children, since African American mothers are disproportionately represented in jobs with nonstandard work schedules.145

It is difficult to reverse patterns established early in a child’s life, which years later can impact adolescent and adult outcomes.146 Given the widespread nature of these unpredictable scheduling practices among the low-wage workforce, these schedules not only wreak havoc on our current workforce but also harm the skills of our future workforce—and therefore the productivity of our economy in the years to come.

Addressing unpredictable schedules

Unpredictable scheduling practices are perfectly legal. Yet, as outlined above, the problems—for firms, individuals, and the broader economy—associated with unpredictable schedules are large. Further, these challenges may grow without some kind of public policy intervention since the occupations in which these practices are most common—retail, the home care sector, and restaurants, among others—are all among what the U.S. Bureau of Labor Statistics predicts will be some of the fastest growing occupations over the next decade.147

One important backdrop for the policy context is the demise of labor unions. Historically, collective bargaining governed working conditions for many employees, including issues such as schedule predictability. But today, only 7.4 percent of private-sector workers are covered by a union contract. That number is even lower in retail (5.3 percent of workers covered) and food services and drinking places (1.9 percent of workers covered), which are among the industries where erratic schedules are most common.148

This means workers’ ability to balance their work and home life is governed almost entirely by individual employers. While there are managers and companies out there who see the benefits of stable schedules, many more may fear that enacting better staffing strategies will put them at a comparative disadvantage compared to “lean staffing” competitors. Federal, state, and municipal policies, therefore, have a role to play. By implementing rules governing scheduling practices across the board, no one employer will be at risk. Indeed, the evidence suggests that it may help all businesses in the long run.

This section lays out private- and public-sector policy recommendations that could help create more stable schedules in a way that is more sustainable for employees and employers alike. Adapting our labor standards and rules to address today’s economy and workers will help millions of Americans and create more sustainable, equitable growth.

Private solutions

In the face of mounting pressure and evidence pointing to the costs of these harmful scheduling practices, many private companies have voluntarily overhauled their work policies. As mentioned earlier, six major retailers ended on-call scheduling after New York attorney general Eric Schneiderman launched an inquiry into their workforce policies. Walmart led the way in adopting just-in-time scheduling practices, but now the company says they are  moving toward a scheduling system that they claim will better accommodates family life. By the end of this year, they have said that the company will offer some employees fixed shifts, allow employees to know their schedule 2.5 weeks in advance, and allow employees to choose their schedules using a smartphone app.

Walmart, however, has not made public how many employees will be eligible for fixed shifts or whether employees who choose fixed shifts or place reasonable limits on their schedules will be eligible for full-time employment. Further, the company has not indicated that it intends to address chronic understaffing. So it remains to be seen how far Walmart’s new policy will go toward addressing the problem of unpredictable scheduling.149

Workers also are taking matters into their own hands. Technology companies are creating a variety of new smartphone apps that purport to provide more schedule flexibility. For example, a new app called myshyft lets hourly employees switch, offload, or sign up for extra shifts. So far, the app-maker, Shyft Technologies Inc., reports that 12,000 U.S. employees at Starbucks Corp., 7,500 workers at McDonald’s Corp, and 3,500 workers at The Gap Inc.’s Old Navy retailing unit have signed up. This app is one example of the way that technology can be employed to generate more stable and predictable schedules, and be part of the solution.

But while the app is helping many employees better tailor their schedules to their outside responsibilities, they do so without the explicit cooperation of their employer. Some managers have adopted Shyft’s technology, posting the entire schedule on the app and letting their employees choose their own schedules. But there is a concern that, as the app becomes more popular, there will be pushback from employers who resent the loss of control over their employees’ schedules.150

In 2014, the Washington Center for Equitable Growth funded Joan Williams and Susan Lambert to work with the Gap, Inc. to develop and evaluate a pilot intervention that takes a  comprehensive approach to improving multiple dimensions of work schedules in hourly retail jobs, specifically, schedule stability, predictability, adequacy, and control. Data collected throughout the nine-month study period demonstrate the feasibility of improving scheduling practices in retail and help to identify larger business practices that facilitate, and undermine, the ability of frontline managers to deliver better schedules to sales associates. Outcome analyses, currently underway, draw on multiple sources of data (scheduling and payroll data from firm systems; interviews with store managers; surveys of sales associates) to examine how the intervention is related to employee-level outcomes (financial hardship, stress, interferences with caregiving, school, additional employment, health) and store-level outcomes (conversion rates, sales, and turnover).

The Gap and other companies that are revamping their scheduling practices are partly motivated by good business reasons to move to more stable schedules. The research shows that, even within businesses that have fluctuations in labor demand, there is significant amount of existing stability in weekly hours. When Lambert and Henly studied just-in-time schedules in the retail sector, they found that for almost two-thirds of the stores, more than 80 percent of hours stayed exactly the same week after week—a fact that surprised many managers. The problem, the researchers found, rests in the managers’ tendency to delay finalizing the schedule until the last minute, waiting for new information. Managers could capitalize on the existing stability in hours in a way that provide workers with more advance notice and regularity.151

Being able to do so, however, also requires addressing managers need to “stay within hours.” A study of hourly jobs in Chicago found that managers are called several times a day in order to inform them of the hours ratio for the next few hours. Giving managers the ability to hit their target ratio by the end of the week, rather than expecting to hit it every hour, could make it possible for managers to deliver greater schedule stability and predictability to workers.152

Further, while technological solutions can make it easier for employees to swap shifts or for employers to comply with new work hours standards, but they cannot obviate the need for a policy floor. Flexibility is just one dimension of sustainable work hours; Shyft and other apps do not deliver adequate or stable weekly incomes or schedules that allow workers to plan in advance for childcare.

Public policy solutions

The Fair Labor Standards Act, the federal law that governs wage and hours protections for workers, has no minimum-hours mandate and does not require employers to create regular, predictable schedules. The FLSA was enacted in 1938 to address the key labor issues of the day, such as prohibiting child labor, establishing a minimum wage, and defining a regular workweek to be limited to 40 hours.153

The FLSA sought to restrain overwork, but did not seek to address schedule predictability.154 The overtime provisions require that workers covered by the law—those paid by the hour and certain lower-paid salaried workers—be paid 150 percent of their usual hourly wage for any hours they work beyond 40 in a given week. The law does not address employee-led flexibility, scheduling issues, predictability of hours, sufficient hours, or part-time parity.155 Today, while many workers struggle with overwork (an issue we laid out in our report, “Overworked America” ), many others face unpredictable work hours.156 Yet there is no national law to protect workers from erratic schedules.157

Knowing what we do, however, points to a few solutions that policymakers at the federal, state, and local level have already begun to develop, namely:

  • A workers’ Bill of Rights
  • Reporting pay laws
  • Right to request laws
  • The Schedules that Work Act

Let’s briefly examine each of these policy prescriptions in turn.

Workers’ Bill of Rights

There is no national law to protect workers from unpredictable schedules, but there are a variety of new ideas being tested among state and local governments. In 2014, San Francisco became the first jurisdiction to penalize employers who alter their employees’ schedule through the passage of the Retail Workers Bill of Rights. This new law requires that:

  • Any retail chain with 40 or more locations that employs 20 or more employees within the city provide two weeks advance notice of work schedules
  • Employers that impose schedule changes with less than seven days’ notice will be required to pay additional “predictability pay”
  • Employers offer more hours to their existing qualified part-time employees before hiring new workers
  • Employers provide two-to-four hours of pay to an employee who is “on-call” for a shift that is cancelled less than 24 hours ahead of time
  • Employers pay part-time employees the same starting hourly wage as full-time employees in the same position158

Many other localities are now following suit. Following passage of San Francisco’s 2014 legislation, 18 different state and local legislatures introduced their own scheduling legislation. In 2016, campaigns are actively pushing predictable scheduling legislation in Oregon, Minnesota, Connecticut, and Massachusetts. And lawmakers in Seattle, Washington, DC, San Jose, and Emeryville, CA are actively debating what predictable scheduling legislation should look like in these locales.159

Reporting pay laws

Seven states and the District of Columbia have enacted so-called “reporting-pay laws” (California, Massachusetts, Connecticut, New Hampshire, New York, New Jersey, and Rhode Island). These laws create a disincentive for employers to send employees home early by requiring employers to pay their workers a minimum number of hours for any scheduled shift that their employees report to. In places where these laws are in effect, employers cannot demand that employees show up for work but then send them home without pay. These laws vary in their scope, with some states exempting various industries.160

As of now, there is no comprehensive analysis of the effects of these laws’ implementation. What we do know is from two recent studies. University of Wisconsin-Madison’s Anna Haley-Lock finds that restaurants in Vancouver, which are subject to provincial reporting pay laws, tended to keep employees at work during slow shifts and assigned them “side work” such as restocking or deep cleaning.161 Haley Lock and Georgia State University College of Law’s Charlotte Alexander, finds that reporting pay laws inflict a limited financial burden on firms, and are effective at deterring managers from cutting shifts short.162

One concern with reporting-pay laws is that they rely on the workers to file lawsuits to enforce their rights rather than on government inspections or enforcements. Yet, many workers, especially low-wage workers, may be unaware of their legal rights, remain silent for fear of retaliation, or lack the financial resources to obtain an attorney if litigation is required.163 While reporting-pay laws are promising, their impact may be compromised if they cannot be effectively enforced.

Another challenge with these laws is that they were enacted before the advent of cell phones made it easy for employers to contact workers shortly before their shift to cancel them, or require them to call in the night before (or a few hours before) to see if they were needed. The United States Courts for the Ninth Circuit is currently hearing a case that will determine whether California’s reporting-pay law applies to on-call shifts because the worker is “reporting to work” telephonically when they call in. There is an effort to modernize reporting pay by clarifying that it is required in all cases where a shift is cancelled or shortened with less than 24-hours’ notice—even if it’s before an employee physically appears at the worksite.164

Right to request laws

“Right-to-request” laws give employees the right to request changes to their schedules without fear of retaliation.165 Such laws are now in effect in Vermont, San Francisco, and Berkeley, CA. Federal workers also now have the right to request, following President Obama’s recent implementation of this policy within the federal government.166 These laws establish a process that allows employees to discuss their scheduling needs with their employer without fear of retaliation. Employers do not have to grant the request, but they can only deny it on business grounds so long as they take the request seriously. In Vermont’s legislation, for example, employers may refuse a request if it will create a cost burden or limit the employer’s ability to meet demand, among other reasons. Here, too, there is no comprehensive study as the first of these laws was only passed in Vermont in May, 2013.

We do, however, have evidence on their effectiveness from other countries. The United Kingdom, New Zealand, the Netherlands, Germany, and Australia all have some form of right-to-request laws in place. In two different studies, these laws were found to be effective at limiting workers’ work-life conflicts. These studies, however, took place in countries with greater union coverage than in the United States, meaning that employees could ask a union representative to help them approach their supervisors. In the United States, employees must take the initiative to learn about and take advantage of the policy on their own.167

The Schedules that Work Act

At the federal level, building on these models at the state and local level, policymakers introduced the Schedules That Work Act in 2015, which similarly addresses both on-call scheduling practices and predictability. This bill, introduced Senator Elizabeth Warren (D-MA) and Representative Rosa DeLauro (D-CT) addresses a multitude of problems associated with unpredictable scheduling. The proposed legislation applies to all companies with more than 15 employees. In particular, it does the following:

  • Guarantees workers the right to request more flexible or predictable work arrangements without retaliation: When the request is made for certain “priority” reasons, the employer must grant the request.
  • Requires reporting pay: an employer must pay their worker at least four hours of wages if they report to work without being permitted.
  • Requires call-in pay: an employer must pay at least one hour of wages if they require an employee to call in less than 24 hours before the start of a shift to find out whether they have to work.
  • Requires advance notice of schedules: employers must give employees their schedule at least 14 days in advance. If an employee’s schedule changes with less than 24-hours notice then the employer would pay a “predictability penalty” of one hour of pay for each changed shift (except when the shift change is due to an unexpected employee absence).

Legislation alone cannot completely eliminate scheduling abuses by employers, but a federal standard would provide an important marker that states and localities could improve upon. The federal bill’s predictability pay component does disincentivize schedule changes but does not make an effort to promote gender and racial equity—two dimensions along which workers often experience schedule abuse. And the bill does not address problems of inadequate/volatile hours or spreading work among a large part-time workforce. Yet alongside setting a floor for policy, this law also could motivate the private sector to invent new ways to balance labor costs and profits, ushering in a shift in the way we think about employment practices.

Conclusion

While employers’ use of unpredictable schedules or just-in-time schedules is seen as a way to boost profits by cutting labor costs, taking a more holistic view reveals these practices can cause harmful ripple effects for firms, families, and the economy. Irregular schedules transfer the risk of doing business to workers and can harm a company’s productivity as well. Combined with the long-term costs to our economic productivity, this issue brief should compel businesses and policymakers alike to rethink the importance of worker schedules.

Gender segregation at work: “separate but equal” or “inefficient and unfair”

PepsiCo Inc. chairman and chief executive Indra K. Nooyi, left, and Jill Beraud, PepsiCo president of sparkling brands, meet with Barclays Capital investor relations representative Carmen Barone, right, at the post that trades Pepsi on the floor of the New York Stock Exchange Monday, Feb. 1, 2010. (AP Photo/Richard Drew)

Fifty years after the arrival of the contemporary women’s movement on the national stage, the U.S. workforce and the U.S. economy are the beneficiaries of the enormous strides in gender equality. Women are working in nearly all occupations that once were exclusively the domain of men, and many are in prominent leadership roles in business and government. Yet sex segregation in the workplace remains a problem as social norms continue to restrict occupational choices by women and men, thereby distorting labor markets, depressing wages, and hurting business innovation and productivity.

Despite the early gains of women in professional and service jobs that require a college education, many such occupations remain disproportionately male, particularly at the highest levels. Furthermore, most technical and manual blue-collar jobs have undergone little to no integration since the 1970s. Economists Francine Blau at Cornell University, Peter Brummund at the University of Alabama, and Albert Yung-Hsu Liu at Mathematica Policy Research, Inc., examined trends in occupational segregation between 1970 and 2009 and found that the process of desegregation has slowed significantly in recent decades, regardless of the education level necessary for a job. (See Figure 1.)

Why does occupational segregation by gender persist

Traditional economic theory explained occupational segregation by gender as an inevitable consequence of “natural differences” in skills between women and men, but contemporary economists have refocused the blame on gender discrimination by employers, coworkers, and other actors. According to the standard model, levels of segregation should be constant over time as they are determined by occupations’ supposed compatibility with “male” and “female” labor market preferences. Contradicting this prediction, economist Jessica Pan at the National University of Singapore finds that men abandoned formerly all-male professions in droves after women’s participation reaches “tipping points,” fearing the social stigma and wage penalties associated with belonging to “feminine” occupations.

Contemporary economic research has sought to better understand the causes of this male aversion to working with female colleagues. On one hand, the discrimination in hiring and promotion that reinforces segregation is based on stereotypes about women’s skills. As Harvard University economist Claudia Goldin argues in her “pollution theory of discrimination,” men often underestimate women’s skills based on their current underrepresentation in certain occupations and thus discriminate against women in these occupations on the false assumption that increasing their representation would lower overall productivity.

On the other hand, economists George Akerlof at Georgetown University and Rachel Kranton at Duke University argue that discrimination in male-dominated professions is caused by social pressures, interpreting women’s inclusion as a threat to the professions’ masculinity. By this account, men don’t discriminate against women because they view women as less qualified but rather because they are trying to protect the social power men hold through membership in the “boys’ club.” In a similar model of “stratification economics,” economists Sandy Darity of Duke, Darrick Hamilton of the New School for Social Research, and James Stewart of Pennsylvania State University detail how socially dominant groups create and reinforce prejudices against other groups in order to protect their economic, political, and social advantages.

Despite a decline in explicit sexism, researchers argue that gender discrimination today, whether in the form of stereotypes or social pressures, is perpetuated by a new, “egalitarian” form of gender essentialism—the belief that women and men’s social, economic, and familial roles are and should be fundamentally different. While most people now support women’s access to all economic opportunities, they simultaneously expect men and women to pursue traditionally “male” and “female” jobs and regard parenting as the primary responsibility of mothers. Sociologist Paula England at New York University and other researchers note that the resurgence in differential expectations is responsible for the recent stagnation in occupational desegregation and in other indicators of women’s economic inclusion.

Assuming different roles for men and women at work and at home, male-dominated occupations remain mostly structured to meet the needs of a stereotypical male who is expected to have a spouse at home, a work-schedule issue that not only fails to accommodate women but also often actively pushes women out. The idea that women are freely “opting out” of workforce opportunities because they have different career aspirations than men has been thoroughly debunked. Instead, women usually leave their jobs because of negative experiences in the workforce, especially in male-dominated fields. In particular, jobs in these fields often demand a culture of long hours, which does not accommodate flexibility for caregiving, forces many mothers to quit, and likewise discourages fathers from helping out at home.

To make matters worse, male-dominated workplaces are often hostile work environments for women, featuring the highest rates of sexual and gender-based harassment. Overt forms of sexual harassment remain part of the “culture” of many male-dominated jobs, particularly given the limited of application of anti-discrimination laws in many blue-collar occupations, as the late Barbara Bergmann, a pioneering feminist economist, once observed. Subtler forms of gender-based harassment in which men exclusively hire, socialize with, and promote each other are even more common in the STEM (science, technology, engineering, and mathematics) professions, in finance, and in other professional environments and have been demonstrated to limit women’s prospects for advancement, decrease female labor force attachment, and reinforce segregation.

How occupational segregation drives down wages and slows economic growth

At the microeconomic level, occupational segregation by gender substantially depresses female wages and contributes to the gender wage gap. Most of the U.S. economy’s highest paying occupations are predominantly male while most of the lowest paying occupations are predominantly female. (See Figure 2.)

By pushing women into lower-paying occupations, occupational segregation depresses female wages and hurts family economic security. A recent empirical review on trends in the gender wage gap since 1980 by economists Blau and her colleague at Cornell, Lawrence Kahn, attributes half of the present gap to women working in different occupations and industries than men. In addition to keeping women out of the highest-paying occupations, a report by the Institute for Women’s Policy Research authored by Heidi Hartmann, Barbara Gault, Ariane Hegewisch, and Marc Bendick details how segregation also excludes women from the best-paying middle-skills jobs in information technology, logistics, and advanced manufacturing, even though these jobs require similar skills as predominantly female jobs with worse pay. Other researchers clearly demonstrate that this “wage penalty” for occupational feminization is a product of discrimination against women’s labor as opposed to productivity differences between predominantly male and female jobs.

As AFL-CIO chief economist William Spriggs and Case Western University historian Rhonda Williams argue, these trends also are highly racialized: women of color at all education levels are segregated into jobs with lower wages than their white female peers of similar skill level. Conversely, occupational integration produces huge wage increases for women and people of color: econometric analysis by Chang-Tai Hsieh and Erik Hurst at the University of Chicago and Charles Jones and Peter Klenow at Stanford University shows that occupational integration since 1960 was responsible for 60 percent of real wage growth for Black women, 40 percent for white women, and 45 percent for Black men (after accounting for inflation). These patterns indicate that the persistence of segregation today results in a significant loss of income for working women and their families, which should be disconcerting to policymakers given the ameliorative effects of lifting women’s wages on poverty, unemployment, and inequality.

Beyond its effect on individual workers, occupational segregation limits optimal matching of workers with jobs where they can best leverage their skills and fulfill their ambitions. If men and women are pushed into careers based on societal definitions of “masculinity” and “femininity” then they aren’t able to choose the labor market opportunities that best match their skills and ambitions. Most of this issue brief is focused on how segregation limits women’s ability to contribute to traditionally male occupations, but it also limits men’s ability to contribute to traditionally female occupations—a significant policy issue as globalization and technology continue to decrease the availability of many predominantly male blue-collar jobs in the United States.

Indeed, a growing body of evidence demonstrates that occupational integration helps both sexes contribute their human capital to enhancing the productivity of firms. A variety of studies show that establishing a “critical mass” of at least 30-percent women in corporate leadership enhances firm innovation and overall performance. This is consistent with behavioral research that gender integration improves teams’ “collective intelligence.” In the financial sector in particular, occupational integration decreases systemic risk driven by masculine-stereotyped behaviors encouraged in sex-segregated environments, argues economist Julie Nelson at the University of Massachusetts-Boston.

These individual- and firm-level gains can have a massive impact on overall productivity and growth. Research by economists Hsieh, Hurst, Jones, and Klenow demonstrates that occupational integration was responsible for driving 15 percent to 20 percent of the increase in aggregate output per worker since 1960.

Where policymakers can jumpstart integration

To counteract gender discrimination, firms should set explicit targets for increasing female representation at all levels. Because children’s labor market preferences are largely shaped by the representation of women in leadership roles, increasing women’s representation in private- and public-sector institutions can decrease stereotypes and expand opportunity for women at all levels. According to research by economists Marianne Bertrand at the University of Chicago, Sandra Black at the University of Texas-Austin, Sissel Jensen at the Norwegian School of Economics, and Adriana Lleras-Muney at the University of California-Los Angeles, Norway’s 40 percent minimum requirement for women on corporate boards increased female representation, attracted female board members with greater qualifications, and reduced gender wage gaps on boards. While it may take time for these effects to trickle-down to entry-level workers, a study by Lori Beaman at Northwestern University, Esther Duflo at the Massachusetts Institute of Technology, Rohini Pande at Harvard University, and Petia Topalova at the International Monetary Fund, shows that a law mandating increased representation for women on municipal councils in India dramatically decreased bias against women in the population as a whole while expanding girls’ educational opportunities and career aspirations.

In addition to interventions at the top, researchers, including Harvard’s Rosabeth Moss Kanter, argue that by establishing a critical mass of women in all work environments employers can dramatically reduce the prevalence of discriminatory behaviors and force their workplaces to adapt to their female employees’ needs and demands. As Yale Law professor Vicki Schultz argues, anti-discrimination law and policy should thus emphasize increasing women’s numerical strength across occupations and dismantle the workplace structures discussed above that create sex differences in labor market choices—as opposed to simply reflecting them. Sociologists Sheryl Skaggs of the University of Texas-Dallas, Kevin Stainback of Purdue University, and Phyllis Duncan of Our Lady of the Lake University find significant “bottom-up” effects of increasing women’s general representation on their representation in managerial positions, complementing the “top-down” effects of increasing their numbers on corporate boards.

While work-life reforms benefiting both fathers and mothers are essential to developing an inclusive workplace, setting explicit targets for women at all levels would help reverse discrimination against women in promotion decisions based on their greater probability of taking leave, as Cornell economist Mallika Thomas documents. Furthermore, while male-dominated occupations can and must change to include women, it is equally important to elevate and integrate female-dominated occupations by mandating equal pay for jobs of equal value or “comparable worth,” as noted by, among others, economist and IWPR president Heidi Hartmann as well as economist and former Bennett College President Julianne Malveaux.

Beyond reforms within labor markets, ending occupational sex segregation will require a comprehensive strategy to prevent the formation of gender stereotypes at a young age that later “spillover” into the workplace. Cultivating inclusion must start early in order to have a lasting impact on children’s beliefs and experiences. Research demonstrates, for example, that unnecessarily segregating boys and girls in educational or social activities creates arbitrary categories of “us” and “them,” sending a message that children’s opportunities should be determined by their gender. Efforts to counteract gender stereotypes can also help women later on in their careers. Indeed, the IWPR report by Hartmann, Gault, Hegewisch, and Bendick argues for public-private partnerships to train and match women from “on-ramp occupations” to higher paying traditionally male jobs that require similar skills.

Achieving successful integration at all levels will take work. However, social scientists including legal scholar Joan Williams at the University of California’s Hastings School of Law and behavioral economist Iris Bohnet at Harvard are proposing a variety of strategies for decreasing bias, overcoming difference, and advancing women throughout their educational and professional careers. As Goldin and Princeton University economist Cecilia Rouse argue in their seminal study on the gender equity benefits of blind auditions for symphony orchestras, these strategies should focus on results-based approaches that decrease the influence of social networks and gender biases in evaluation, hiring, and promotion of women.

Leveraging these behavioral changes to promote gender equity and inclusion in all institutions boasts enormous potential to raise wages, boost productivity, drive innovation, and expand opportunity for women and men across the economy.

Will McGrew is an intern at the Washington Center for Equitable Growth and a Dahl Research Scholar at the Yale Institution for Social and Policy Studies. He is studying Economics and Political Science at Yale University.

Credible research designs for minimum wage studies

The employment consequences of increasing the minimum wage in the United States continue to be a major subject of debate, but how researchers choose to estimate the effects of raising the minimum wage can substantially affect the results of their work. In “Credible research designs for minimum wage studies”,168 my coauthors and I examine one group of low-wage workers—teenagers—whose hourly wages are significantly raised by minimum wage increases.

Download File
Issue Brief: Credible research designs for minimum wage studies

A common objection to raising minimum wages is that doing so will reduce the employment opportunities of low-skilled workers such as teenagers. We show, however, that some studies find negative effects of the minimum wage on teen employment because they fail to control for other economic factors that independently reduced employment around the time of a minimum wage increase. After controlling for these factors, we demonstrate that the large, negative effect on teen employment disappears.

State minimum wage increases are heavily concentrated in different regions of the country

After the frequency of federal minimum wage increases slowed during the 1980s and 1990s, many states began experimenting with setting their own wage floors above the federal level. By last year, more than half of all states had a minimum wage higher than the federal floor. This extensive history of state-level policies offers an attractive set of experiences for researchers to assess the effects of minimum wages.

Economists have developed a large body of research comparing the labor market outcomes in states that raise their minimum wage versus those that don’t. Yet a naive comparison of these two groups of states can lead to misleading conclusions because the variation of state-level minimum wage policies is not random (which is ideal for assessing the impact of government policies) and is instead geographically concentrated. (See Figure 1.)

Figure 1

My coauthors and I explain in our paper that the map divides states into two groups: states with high average minimum wages and states with low average minimum wages during the 1979-2014 period. States that have high minimum wages were more likely to have been raising their respective wage floors above the federal floor. States with low minimum wages typically followed federal policy. This difference is clearly region-specific.

This clustering of minimum wage policies within regions of the country is an obstacle for credible research on the minimum wage because comparing the employment of minimum wage-raising and non-raising states effectively compares regions such as the Northeast versus the South. Employment patterns differ in these regions because of a host of economic and political reasons not affected by the minimum wage. High minimum wage states, for example, also boast higher unionization rates and experienced smaller declines in unionization over the past three decades. They were much more likely to vote Democratic in the 2012 presidential election. In low minimum wage states, over the past 20 years, the foreign-born share of the population grew much faster.

In summary, there are reasons to be concerned that states that tend to raise their minimum wages have different employment trends than states that do not, irrespective of the minimum wage. Simply comparing minimum wage-raising and non-raising states can therefore give misleading estimates of the effects of the policy.

States where the minimum wage is high were experiencing employment problems even before minimum wages went into effect

Some minimum wage research does not adequately address the problems caused by the non-random pattern of minimum wage increases. In our paper my co-authors and I re-examine a key 2014 study, “More on Recent Evidence on the Effects of the Minimum Wage in the United States,” by David Neumark at the University of California-Irvine, Ian Salas at Johns Hopkins University, and William Wascher at the Federal Reserve Board.169 This study finds large, negative employment effects of the minimum wage on teenagers, a demographic group with a large share of minimum wage workers.

The methodology behind this study, however, also generates an implausible conclusion—that teen employment in high minimum wage states was falling in the years before the minimum wage was increased. The mistaken results of this study are a consequence of not controlling for the striking spatial pattern of minimum wage increases in different regions of the country.

One simple way to assess directly whether minimum wage-raising and non-raising states are comparable is to look at labor market outcomes before a minimum wage increase actually occurs. Borrowing from the language of randomized control trials in medicine, this can be thought of as a placebo or falsification test. We should not see the effects of drug before a drug is administered in a well-designed experiment. If we observe in a drug trial that the health of the treated group was improving relative to the control group even prior to taking the drug, then we should be hesitant to ascribe subsequent improvements in health to the causal effect of the drug itself.

Similarly, my co-authors and I examine the estimated effects of the minimum wage on teen employment in the years before and after minimum wage increases. We compare the results from the approach favored by Neumark, Salas, and Wascher to the approach we favor. First, we estimate the effects of the minimum wage using the preferred model of Neumark, Salas, and Wascher, in which any state is on average a good control for another state in the absence of minimum wage increases. Second, we consider the model that we prefer, one that controls for the non-random geographic pattern of minimum wage increases, allowing states to have different teen employment trends and restricting comparisons to nearby states.170

With these two models in hand, my co-authors and I calculate the elasticity of teen employment with respect to the minimum wage—specifically the percent change in teen employment in response to a 1 percent change in the minimum wage. Our findings show that the minimum wage did not lower teen employment in our preferred model (with rich spatial controls) which passes the falsification test. (See Figure 2.)

Figure 2

The model preferred by Neumark, Salas, and Wascher shows large, negative effects of the minimum wage at the time of the minimum wage increase and afterwards (years 0 through year 3, in the left panel of Figure 2). At the same time, the model decisively fails the falsification test. Teen employment in minimum wage-raising states is already low in all three years prior to the minimum wage increase (years -3 through -1). For every year prior to the minimum wage increase, their model produces a statistically significant negative employment effect—even though no minimum wage increase was enacted in those years.

This violation of the “parallel trends” assumption—that states on average have similar teen employment trends in the absence of minimum wage differences—is a clear sign not to trust the estimated employment effects of this model.

In contrast, my co-authors and I successfully control for the non-random pattern of minimum wage increases by using a model with a richer set of geographic controls (see the right panel of Figure 2). As is expected by a credible research design, there is not much change in teen employment in the years before the minimum wage increase. Teen employment elasticities during the pre-treatment period are generally small and are all statistically insignificant. In addition, there are no indications of negative employment effects in the years after the minimum wage increase. None of the point estimates are economically large or statistically significant by conventional standards.

Although these geographic controls are natural choices to account for the non-random spatial pattern of minimum wage increases presented in Figure 1, there are other research designs one could consider. In our paper, we present additional evidence from research designs that incorporate other controls for the non-random nature of minimum wage policies, such as limiting comparisons to nearby counties, or using estimators based on techniques that select alternative control groups. Many of these estimates also suggest small-to-no employment effects for teens.

As my coauthors and I explain, teenagers are a small share of the total workforce, but the studies of this group are nevertheless informative for understanding the overall employment effects of the minimum wage. If there were widespread employment losses due to the minimum wage, then we would likely see them among low-skilled groups such as teenagers. Yet the evidence we present in our paper suggests that teenagers did not suffer job losses for the kinds of minimum wage increases typically experienced in the United States over the past 35 years.

(Photo by Adam Croot, via Flickr)

The employment effects of a much higher U.S. federal minimum wage: Lessons from other rich countries

Overview

Not long ago, most U.S. economists agreed that a statutory minimum wage with any “bite”—any meaningful effect on wages at the bottom of the labor market—would cause job losses and lead to a reduction in aggregate employment opportunities for low-wage workers. But as a result of path-breaking research by leading economists (first David Card at the University of California-Berkeley and Alan Krueger at Princeton University, and then by Arindrajit Dube at the University of Massachusetts-Amherst and Michael Reich at University of California-Berkeley and their associates, that has changed. Today, a vast majority of economists now understand that modest increases in the (currently very low) federal minimum wage would have little or no effect on overall job opportunities for minimum wage workers.

Download File
The employment effects of a much higher U.S. federal minimum wage: Lessons from other rich countries

Read the PDF in your browser

But what about the effects of a sizable increase of, say, more than double the current federal $7.25-an-hour minimum wage? What would a wage floor of $15 an hour mean for low-wage workers and U.S. economic growth?

This policy brief documents big differences in the national statutory minimum wage floor across several other affluent countries compared to the United States. The analysis shows how these differences translate into very large consequences for the incidence of low pay and the buying power of low-wage workers—using a wide variety of data, including workers’ starting pay and the famous “Big Mac” index of burger prices at McDonald’s restaurants in these countries—and concludes by reporting evidence that these substantial differences in approaches to low pay across the rich world show no correspondence to standard indicators of employment performance.

In short: Neither employment nor unemployment rates reflect the vast gap between the United States and other rich countries that have all but outlawed the payment of extremely low wages by establishing legal wage floors far above the U.S. federal minimum wage.

The minimum wage landscape in affluent nations

Rich countries have taken dramatically different paths on setting a lower boundary for wages. Some, including Denmark and the Scandinavian countries, have relied on extensions of collective bargaining agreements to set legal wage floors. This obviously is not how the U.S. labor market operates, so the focus of this issue brief is on those nations with statutory national minimum wages.

First, consider France. The French minimum wage climbed from about 35 percent of the median wage for full-time workers in the 1960s to 61 percent in 2014. In contrast, the U.S. minimum wage floor was around 50 percent of the median in the 1960s but has since fluctuated between 35 percent by the late 1980s and 37 percent in 2014. Then there is Australia, where the minimum wage also fell—from 65 percent in the early 1990s to 53 percent in 2014—but only because the country’s median wage rose faster than the statutory wage. Canada’s minimum-to-median wage rate followed about the same trajectory as the United States from the 1960s to about 1990 and has since ranged between 40 percent and 45 percent of the median wage, where it is today—well above the United States. The United Kingdom introduced a statutory minimum wage only in 1999, and as the chart shows, its value has increased relative to the median from about 40 percent in 2000 (like Canada) to 47 percent in 2014 (slightly above Canada and far above the United States). (See Figure 1.)

Figure 1

Another way to compare the minimum wage across national borders is in terms of purchasing power. The minimum wage in Australia and France buys a lot more than in the United Kingdom and Canada, and substantially more than in the United States. In Australia and France, the purchasing power of their minimum wage was equivalent to $10.90 in 2015. The wage floors in the United Kingdom and Canada are much lower—about $8.15 in 2015—but still considerably higher than the United States, where the federal minimum wage was $7.24 (below $7.25 because the figure uses 2014 constant dollars and there was slight inflation between 2014 and 2015). (See Figure 2.)

Figure 2

But the take-home pay of minimum-wage workers depends on both taxes and the effects on eligibility for benefits. A recent report on the minimum wage by the Organisation for Economic Cooperation and Development put it this way:

Without effective co-ordination, minimum wage hikes may not result in significant income gains for the targeted individuals, especially in countries where tax burdens on low-wage earners are sizeable, or where means-tested out-of-work transfers provide a comprehensive income safety net.

The OECD’s estimates of the weekly working hours a minimum wage worker needs to keep a family out of poverty varies enormously, from 50-to-59 hours in the United States (depending on the type of family) to 31-to-38 hours in France, to just 7-to-19 hours in Australia. Given taxes and benefits, Canada and the Netherlands are more like the United States, Ireland and the United Kingdom are more like Australia, and France and Germany fall in the middle. A one-earner couple with two children in the United States, for example, would require 59 hours of minimum wage work a week to keep that family out of poverty compared to 53 hours in Canada, 41 hours in Germany, 38 hours in France, 20 hours in the United Kingdom, and 19 hours in Australia. (See Figure 3.)

Figure 3

We can also get a good idea of the relative purchasing power of the minimum wage in different countries by comparing the starting wages at McDonald Restaurants, which is closely associated with the national minimum wage in each country, and by calculating the number of Big Mac burgers a minimum wage worker can buy for an hours work (at the pre-tax wage). The starting pay for a crewmember in these fast-food restaurants is, indeed, highly correlated with the nation’s minimum wage. In 2014, for example, starting pay at the restaurant chain in Australia averaged $13.33 compared to the minimum wage $11.31. This compared with $11.84 (and $11.64) in France, and just $8.22 (and $7.25) in the United States. The takeaway is that, not surprisingly, starting pay for fast food workers is far higher in countries that have a higher national minimum wage. (See Figure 4.)

Figure 4

Not only is starting pay at McDonald’s extremely low in the United States compared to other rich countries, but so too is the price of a Big Mac relatively high in this country compared to other affluent countries. The combination of low pay and high prices means that the number of Big Macs a McDonald’s entry-level worker can buy is 3.8 in Australia, 2.5 in France and only 1.7 in the United States. The pattern is the same for workers’ ability to buy Big Macs at the national minimum wage: 3.3 in Australia, 2.4 in France, and 1.5 in the United States. (See Figure 5.)

Figure 5

The employment effects of the minimum wage in the United States and other affluent countries

According to conventional thinking, there are big wage-employment tradeoffs associated with a high minimum wage. As a result, while there may be some low-wage workers in Australia and France who will benefit from higher wages, many will be “priced-out” of a job. In this view, a higher minimum wage, together with higher rates of collective bargaining (among other factors) explains cross-country differences not only in the incidence of low pay, but in employment and unemployment rates for minimum wage workers.

If these so-called “labor market rigidities” price workers out of the labor market, then reducing the low-wage share of employment (via a higher minimum wage) should also reduce the low-education employment rate because young, less-educated workers should have a harder time finding and keeping jobs.

Yet the data offer little support for this orthodox tradeoff view. Rather, OECD data show that while there is a huge 14-percentage point gap in the low-wage share of employment between France (11 percent) and the United States (25 percent), the employment rates for young, less-educated workers are only moderately higher in the United States (57.4 percent compared to 54.9 percent). Similarly, Australia’s incidence of low pay is more than 10 percentage points below the U.S. level, but the low-education employment rate is more than 4 points higher, illustrating the lack of any statistical relationship across affluent countries between the incidence of low pay and the employment rate for less-educated young adults. (See Figure 6.)

Figure 6

But what about youth unemployment rates? There are two alternative unemployment rates that enable comparisons across countries. One is unemployment measured as a share of the labor force; the other is unemployment as a share of the working age population. Comparing these two measures in the United States and France and in the United States and Australia among young workers ages 15 to 24 shows no obvious correspondence between either measure and the level or trajectory of the national minimum wage.

First let’s look at the United States and France. If the conventional wisdom were correct, then United States-French youth unemployment rates should have sharply diverged. But what we see instead is considerable convergence. From 1997 to 2007 the French unemployment rate for 15-to-24 year olds fell dramatically, from 30 percent to 19.1 percent, while the U.S. rate increased from 11.3 percent to 12.8 percent, and France continued to close the unemployment gap between 2007 and 2010 (see Figure 7). This 1997-2007 convergence took place as the French minimum wage increased from 54 percent to 62 percent of the nation’s full-time median wage while U.S. federal minimum wage fell from 39 to 31 percent—exactly half the French ratio (see figures 1 and 2). Over the entire 1997-to-2014 period, the conventional French unemployment rate improved by 6.8 percentage points and the U.S. rate worsened by 2.1 points.

Figure 7

Figure 7 also compares France and the United States on a much better measure of youth unemployment: the unemployment-to-population rate. This indicator shows that these countries have tracked each other closely since 1983, with the rate in both countries fluctuating between 6 and 10 percent. In short, neither unemployment measure shows any evidence of the predicted divergence in French-U.S. employment performance.

Comparing these two unemployment-rate measures for Australia and France also fails to confirm the conventional tradeoff prediction. As in France, Australia has legislated a high minimum wage by international standards. (See Figures 1 and 2.) Yet, by both indicators, youth unemployment fell sharply between the early 1990s and the global 2008-2010 economic crisis—to levels below the United States. (See Figure 8.)

Figure 8

Other affluent countries provide much higher and more universal support for working families than the United States, in the form of health care, housing, education, and child subsidies. This means the legal wage floor must carry a much higher burden for maintaining minimally decent incomes for working families than in other rich countries.

Yet, as the data presented in this policy brief demonstrates, the United States is at the extreme low-end among affluent countries on the level of the minimum wage, whether measured in terms of buying power or relative to the median wage. (See Figures 1 and 2.)
As a result, after taking into account taxes and benefits, it typically takes a minimum wage worker six to seven times as many hours of work per week to keep a lone parent or two child family out of poverty compared to the United Kingdom or Australia (50 hours versus 7 or 8 hours). (See Figure 3.)

This gigantic gap in the payoff to working at the minimum wage for U.S. workers can also be illustrated by the much lower starting pay at McDonald’s franchises, and the far fewer Big Macs a U.S. worker at McDonald’s can buy with an hour’s work than her counterparts in other rich countries. (See Figures 4 and 5.) At the same time, standard measures fail to show the predicted worsening of youth employment performance between the United States and countries that set a much higher legal wage floor, such as Australia and France. (See Figures 6, 7, and 8.)

All of this international evidence strongly suggests that, properly designed and implemented, much higher living standards are possible for working families in the United States by setting the federal minimum wage far above the current level of $7.25 without affecting overall employment opportunities for minimum-wage workers.

—David Howell is a professor of economics and public policy at The New School in New York City. This note reflects and builds on the material that appears in the Washington Center for Equitable Growth working paper, “What’s the Right Minimum Wage? Reframing the Debate from ‘No Job Loss’ to a ‘Minimum Living Wage,” co-authored with Kea Fiedler and Stephanie Luce. Special thanks to Kea Fiedler for her work on the McDonald’s data.

Photo by Remy De La Mauviniere, Associated Press

New analysis shows it is more difficult for workers to move up the income ladder

Against a rising chorus of concern about increasing income inequality, some economists are pushing back, suggesting that it is not income inequality we should be concerned with but rather income mobility. Income mobility describes the ability of individuals to move up and down the income ladder over some period of time. As long as mobility is healthy, they argue, society can remain egalitarian in the face of inequality, because the poor can move up and the rich down.

Intuitively, some observers assume that higher income inequality should be correlated with decreased income mobility as the rich build a bigger lead on the rest of society. But there is little consensus about whether and how income mobility has changed. What little research does exist is inconsistent with regards to findings, methods, and data sources. Equitable Growth grantees Michael D. Carr and Emily E. Wiemers at the University of Massachusetts-Boston used a new dataset to revisit the measurement of earnings mobility, the part of income that comes from work. Their results suggest that lifetime earnings mobility has declined in recent years.

The authors construct a snapshot of earnings mobility in two time periods: 1981 to 1996 as well as 1993 to 2008. In each one, workers are observed at the beginning and end of the time period to capture mobility over a 15-year span. Workers are divided into ten income deciles (each representing 10 percent of workers, ordered from lowest to highest paid) and categorized at the beginning and end of the 15-year span. Use the interactive below to explore their results in each of these two time periods.


To see how mobility changed over these two time periods, Carr and Wiemers look at how the probability of moving up or down rungs on the earnings ladder has changed between the two periods. As the interactive below shows, they find that most workers are less likely to move up the income ladder now (1993-2008), and a bit more likely to fall down the income ladder than they were in the past (1981-1996). The exception is earners at the very top of the income distribution. By definition, these workers at the top rung cannot rise up any farther, but in recent years, members of the top group are less likely to slip down than they used to be.

Use the dropdown menu to look at different slices of the population. A particularly notable finding from the paper is that the largest declines in upward mobility are among workers with college degrees who start in the middle of the earnings distribution. It has become increasingly difficult for these college-educated, middle-class workers to ascend into high income jobs. In general, a worker’s starting position has become more predictive of their final position across the income spectrum.


Carr and Wiemers use a new data source that they contend has some advantages over data used in previous research. They use the Survey of Income and Program Participation, or SIPP, to obtain demographics on a large number of workers over a long period of time. The Census Bureau merged this survey with administrative records from the Internal Revenue Service and the Social Security Administration and has made the product available to researchers. This gives Carr and Wiemers accurate information on earnings and benefits for each worker. This approach yields a large, nationally representative sample with demographic information on each individual in the data set. Better still, the researchers are able to follow individuals for a long period of time.

Economics is undergoing a kind of data revolution as administrative datasets become more common. Studies like this one may shed new light on areas of research that were previously marked by inconsistent findings. It may be some time before we can say with certainty what is happening to economic mobility in America, but this research makes an important new contribution to the existing literature.