Equitable Growth in Conversation: An interview with Lawrence H. Summers

Today, Equitable Growth kicks off “Equitable Growth in Conversation”—a recurring series where we’ll talk with economists and other social scientists to help us better understand whether and how economic inequality affects economic growth and stability in particular ways.

In this first installment, Heather Boushey, Executive Director and Chief Economist here at Equitable Growth, interviews renowned economist and former U.S. Treasury Secretary Lawrence H. Summers. The two dig into secular stagnation—what it is, what problems it creates, and the issues for policymaking—as well as how inequality plays a role in the phenomenon.

Read their conversation below.


Heather Boushey: You’ve been talking a lot about secular stagnation. That’s what we want to dig into, and in particular we want to talk about what it is, what problems it creates, and what the issues are for policymaking. But then we want to talk about how you see inequality playing a role in secular stagnation. I know in a couple of pieces, you’ve referenced inequality playing a role, so that’s what we want to take a close look at today.

To open up this interview, can you briefly sketch out what secular stagnation is?

Larry Summers: Secular stagnation, as I use the term, refers—and I think this was the essence of Alvin Hansen’s argument in the 1930s—to a situation in which there’s a chronic excess of savings, desired savings, relative to investment in an economy—in an individual economy or in the global economy.

The consequence is downwards pressure on real interest rates, a weakness in demand leading to slow growth, and leading to sub-target inflation. In a situation of secular stagnation, there will be normal fluctuations, centered around a relatively low level of performance. And there will be a tendency for those moments of rapid growth to be financially unsustainable because they’re based on unsustainable levels of borrowing and, perhaps, of asset prices.

HB: So what do you think are the key problems that this creates for policymakers?

LS: Look at the global economy. Look at the industrialized world today. If you look across the United States, Europe, and Japan, inflation is expected to be less than 1 percent over the next 10 years, and real interest rates are expected to be below zero. And that’s over a 10-year period.

That’s a market judgment—and it’s a judgment that markets have had for quite some time now—that economic performance is going to disappoint substantially in the industrial world. And the key to it is that there’s a lack of demand. That leads ultimately to reduction in supply potential, as lack of demand inhibits investments and leads to more unemployment and labor force withdrawal through hysteresis effects.

But if you see a tendency toward “low-flation” and deflation, and you see sluggish economic growth, and you see that in progress for a long period of time, you have to think that something’s going wrong on the demand side of the economy.

HB: So let’s set aside the politics if we can, which I know is not a rational thing to do. But let’s start with what you think we need to be thinking about. For policymakers—both on the fiscal and monetary side, but let’s start on the fiscal—what do you think needs to get done that would address these kinds of issues? Is it all demand management?

LS: The least rational political cliche in economics is the idea that, because in downturns people and businesses are tightening their belts, government should as well.

HB: I believe President Obama said that when you were working for him.

LS: I think it was after I was working for him, but he did say it. He did say it and I regretted it when he said it. Virtually every American president has said some version of that at some time or another. The reality is that it’s government’s responsibility to be countercyclical—that when private saving is substantially exceeding private investment, that is precisely when government should be borrowing and investing.

This is a moment when the United States can borrow money at less than 3 percent for 30 years, in a currency we print ourselves. It is a moment when materials costs are extraordinarily low. It is a moment when construction unemployment rates remain high.

Has there ever been a better moment to fix LaGuardia or Kennedy Airport? It is crazy that at a moment like this, the United States has the lowest rate of federal infrastructure investment, relative to the economy, than we’ve had since 1947. And on a net basis—that is, taking into account depreciation—we’re essentially not investing at all.

So there is a compelling case, in my view, for expanded public investment. Even the International Monetary Fund, hardly a group of radical socialists, has recognized that in situations like the present one, where the economy is close to being in a liquidity trap, the likelihood is that increased public investments will, over time, reduce rather than increase debt-to-GDP ratios, as they call forth increased economic growth.

I yield to no one, not Pete Peterson, not the Concord Coalition, in my concern for the well-being of my children’s generation and future generations. It’s just that I think a deferred maintenance liability of trillions of dollars compounds at a far higher rate than the interest rate at which the United States is now able to borrow. So addressing that deferred maintenance liability is actually reducing the financial burden that we will place on future generations.

HB: So for the deficit hawk that’s in Congress, what do you think is the best illustration of the effectiveness of the policy agenda that you just outlined? If you were to show one chart, one figure, one country example, what would you point to that you think really hammers that home for the non-economist—somebody who’s a politician?

LS: You know, I’m not sure. Judging by the decisions Congress has made on infrastructure, I’m not sure those of us on this side of the argument have been successful. I suppose I would show what’s happened, show the growing deferred maintenance burden that we are incurring as a country, and I would show the available evidence, which suggests that when you defer maintenance, you can raise its total costs by a factor of two or more.

I do think that some part of the skepticism about public investment comes from a sense that the government doesn’t always do it as well as it could. There’s a bridge across the Charles River right near Harvard Square, right near my office. The bridge was constructed around 1915, in 10 months. It’s now in its 50th month of being repaired.

So I think there are legitimate concerns about how public investment projects are executed. And I think there is a tendency for some macroeconomists and some progressives, in their enthusiasm for public investment, to lose sight of valid concerns about the competence and efficiency with which public investment projects are executed.

HB: Yes, which poses a lot of political problems.

LS: Yes.

HB: That might be an interesting segue into the next set of questions. I want to come back to monetary policy, but I want to move now to thinking about the role of inequality.

What role do you think inequality plays in the problem of secular stagnation? And my follow-up question to that: There are a variety of dimensions in inequality that we could think about. I don’t want to limit you to a particular dimension, but I am going to ask you if you think there are other dimensions than whatever you mentioned in the first part of the answer.

LS: You know, I think there’s a broad issue. When I went to graduate school in the 1970s, the prevailing view among economists, captured by Art Okun’s book “Equality Versus Efficiency: The Big Tradeoff,” was that equality and efficiency were both desirable, but they were likely to trade off—that more progressive taxation would achieve more equality but would inevitably in some way distort economic choices and, so, reduce efficiency, for example.

I believe there are still many areas in which one does have to trade off equality versus efficiency. But I also believe there are many areas in which it’s possible to reform policy to promote both economic efficiency and equality. One such area is policy to mitigate secular stagnation by promoting demand at times when there is slack in the use of resources.

Recall that I defined secular stagnation as having at its essence an excess of savings over investment, desired saving over desired investment. There are many reasons for that. Some of them have to do, for example, with reduced investment demand because so much more capital can be purchased with fewer dollars. I think of the fact that my iPad has more computing power than a Cray supercomputer did when Bill Clinton came into office in 1993.

One aspect of that excess in saving over investments is that rising inequality has operated to reduce spending. We are fairly confident that what economists call the “marginal propensity to consume” of those with high incomes is less than the marginal propensity to consume of those with middle incomes.

And so the combination of rising inequality in the distribution of income across income levels and a shift in inequality toward the higher profit share slows economic growth. In normal times, such a change might be offset by easier monetary policy. But in the current environment, where interest rates are very close to the zero lower bound, the capacity for that kind of offset is greatly attenuated.

There’s another aspect of the connection between secular stagnation and inequality that bears emphasis. Experience suggests that in an economy where there are more workers seeking jobs than there are jobs seeking workers, the power is on the employer side, and workers do much less well. A tight economy, where employers are seeking workers, shifts the balance of power toward workers and leads to higher pay and better benefits. That, in turn, leads to more spending being injected into the economy, which supports further economic growth.

And so, as Keynes recognized when he wrote to FDR in the late 1930s urging the importance of wage increases, measures that strengthen workers’ capacity to earn income by increasing spending power can promote both equality and strengthen the economic performance of the country.

HB: A number of economists are now talking about the rise of inter-firm inequality—that it’s not necessarily just a gap between the typical worker and all bosses, but that some firms are pulling further and further away. Do you have any sense that that might be playing any role in the dynamics that you just mentioned?

LS: I’m familiar with that argument, but I don’t yet have a view. I have a concern that we may be seeing some increases in monopoly power. That, because of overly rigorous protection of intellectual property, for example, because of the rise of industries where there are very important network or first mover advantages, we may be seeing more monopoly power. And monopoly power exacerbates secular stagnation in two respects.

On the one hand, it means more income going to groups that are likely to have a high marginal propensity to save. On the other hand, it means less investment demand because monopolists have a desire to constrict supply.

HB: So I just have two questions left. We talked a lot about problems. We talked a lot about the role of inequality. We talked about secular stagnation. Just to remind us all of what we covered.

The big questions that I have are: What solutions should policymakers pursue, above and beyond the things you already mentioned, around infrastructure investment? And what, importantly, do they need to know to help them make those decisions? What I’m looking for is what solutions we should pursue, and what questions we, as an organization, should be encouraging researchers to ask in order to help inform those decisions.

LS: Let me answer them in the opposite order.

HB: OK.

LS: I think we need more research on the links between inequality and spending. It’s an area where there’s a lot of talk and relatively little hard data. In particular, there was a previous generation of research on the impact of a profit share of corporate-retained earnings on aggregate levels of savings. But that work has not been extended in recent years.

There’s a great concern on the part of progressives about mechanisms through which corporations distribute cash, like excessive stock buybacks and dividends. If the alternative is investment, that concern is very understandable. If the concern is cash that is held on corporate balance sheets, then reducing payouts may have the effect of reducing spending and hurting the economy. And I don’t think we understand those aspects of corporate behavior as well as we might think.

In the wake of the financial crisis and the Great Recession, there’s been an entirely appropriate concern with curbing excessive lending and with maintaining prudential standards. But, of course, an inadequate capacity to support lending operates to discourage investments and in turn to exacerbate secular stagnation.

I don’t think we know as much as we should about the determinants of a flow of credit to small business. And I have a particular concern that if we had an excessive flow of credit to housing for many years, we may have an insufficient flow of credit to some who want to buy homes at the present time. And this seems to me to be a valuable area for future inquiry.

An additional area that I have tried to do some work in recently, with Gauti Eggertsson, but where much more needs to be done is the open economy aspect of considering secular stagnation.

Increasingly, the United States is the single engine that is driving large parts of the world economy, and policy measures that lead to a much stronger dollar may have the effect of shifting demand from the United States to the rest of the world in ways that are not fully in our interest. And so, what the appropriate attitude is, for example, toward capital outflows from China, is an issue that I think deserves careful consideration and research.

At the broadest level, the concern with excessively low interest rates in the United States—and the danger that the United States will hit the zero lower bound on interest rates repeatedly in the years ahead—raises the question of what the appropriate public policy posture is toward promoting savings versus promoting investments. For many years, we have seen the promotion of savings as a central objective. Perhaps in an environment of such low returns to savings, and an environment with the shortage of demand, we should be more concerned with promoting demand.

It’s ironic to remember that when Keynes visited the United States during the Second World War, he saw one important virtue of the Social Security system as being that, by making retirement secure, it would support spending—spending that would help to drive the economy forward and avert what might otherwise be a stagnant outcome.

For a whole variety of reasons, those arguments haven’t looked very relevant for most of the last 60 years, but we may be coming into an era when they are increasingly relevant. And so, the question of the right attitude toward savings is one on which I think there is valuable future work to be done.

One critical area is with respect to the relationship between macroeconomic policies and financial stability. The secular stagnation hypothesis raises a possibility that I think needs to be considered much more thoroughly in future research. That possibility is that financial instability is obviously in part a reflection of inadequate regulation. But in a deeper sense, it may be that the structure of the economy has become such that the kinds of flows of credit that are necessary to maintain full employment are inconsistent with financial sustainability.

From that point of view, efforts to contain dangerous credit flows or avoid monetary policies that risk bubbles and asset price inflation may have the very adverse side effect of holding down demand and thereby inhibiting economic growth. If so, there needs to be much more emphasis on structural measures and fiscal measures as tools for maintaining consistently adequate levels of aggregate demand.

There may also be a scope for further research on unconventional aspects of monetary policy. A central concern coming out of the secular stagnation thesis is this: If you look at the experience of economies that are in the mature stage of recovery, and where the unemployment rate has fallen to reasonably low levels, historical experience suggests that the odds of a recession within three years are very high, and the odds of a recession within the next year are certainly not small. Traditionally, the Federal Reserve has lowered interest rates by between 300 and 500 basis points to combat a recession. We are unlikely to have that much room when the next recession comes.

What are the alternative tools? Part of the answer lies in choosing fiscal policy, and I think we need to do more than we normally do to have contingency plans for the use of fiscal policy. But an additional part of the answer, I would submit, will lie in creativity with respect to possible unconventional monetary policy. How much easing can be achieved in a world where quantitative easing has already brought loan rates down to very low levels? What is the full extent to which negative interest rates are or are not a viable economic possibility? What are the toxic side effects in terms of financial stability of easy monetary policies? These are all crucial questions raised by secular stagnation.

HB: Thank you. Those are all great. My last question is, on this policy question around inequality, are there things that policymakers should be thinking about—specifically in the area of non-macro policy—about addressing inequalities that would ultimately be important for macroeconomic stability in ways that perhaps policymakers aren’t thinking about now?

And then, if inequality plays any role in this instability, should we be thinking more about addressing inequality at the top or the bottom and putting it into that larger economic framework for people?

LS: No, as Keynes recognized in the late 1930s, traditional economics of measures to support wages—like stronger collective bargaining or increases in the minimum wage—are quite different in the context of an economy that is demand-constrained compared to one that is not demand-constrained.

And so I think it is an appropriate moment for more active consideration of structural measures that influence inequality. The minimum wage is one such measure. Collective bargaining is another. The appropriate application of regulatory and antitrust policy is yet another that deserves consideration.

I think the agenda of seeking to identify areas within the economy where large rents are being earned and to contain those rents is very worthy of consideration. One needs to also be mindful that one person’s rent can be another person’s incentive. And so I think one needs to consider policy quite carefully in these areas, but I don’t think that issues surrounding rents have received the appropriate amount of attention in recent years.

HB: Well, that’s a great place to end it. This has been wonderful, and I really appreciate your time. Thank you.

LS: Thank you.

This interview has been edited for length and clarity.

Paid leave is good for our families and our economy

Heather Boushey, Executive Director and Chief Economist at the Washington Center for Equitable Growth, testifies before the Committee of the Whole, Council of the District of Columbia on the Universal Paid Leave Act of 2015 (Bill 21-415).

Thank you, Chairman Mendelson, for calling this hearing. And thank you to the D.C. Council for extending an invitation to speak to you today. I am honored to be here.

My name is Heather Boushey and I am Executive Director and Chief Economist at the Washington Center for Equitable Growth. We seek to accelerate cutting-edge analysis into whether and how structural changes in the U.S. economy, particularly related to economic inequality, affect economic growth.

I am also the author of a forthcoming book from Harvard University Press, Finding Time: The Economics of Work-Life Conflict, where I go into great detail on the need for policies such as the Universal Paid Leave Act of 2015. What I’ve learned through my research is that the economic evidence points in one direction: Smoothing and securing people’s participation in the economy is good for families, good for firms, and good for the economy. Family and medical leave insurance would help all D.C. workers be less economically vulnerable when balancing work, illness, and family care.

I recognize that there are some added costs for businesses when implementing paid family leave—most importantly, the expenses incurred when coping with an employee’s absence. However, the cost of coping with an employee’s absence is not new to businesses in the District of Columbia since the District of Columbia Family and Medical Leave Act of 1990 already grants employees 16 weeks of family leave and 16 weeks of medical leave within any 24-month period. The additional step of universal paid leave will enable workers to meet the needs of their families and of the firms they work for in better and more productive ways. This will help make the District of Columbia more—not less—economically competitive and broadly benefit families.

I will make four points in my testimony today:

  1. Paid family leave is a necessary policy for modern families.
  2. Family economic security is important for our overall economic strength and stability.
  3. Localities—like the District of Columbia—should consider action because neither private employers nor federal policymakers have thus far addressed this urgent economic issue.
  4. There are models from three states that have led the way that show paid family leave is good for the economy.

Download the full pdf for a complete list of sources

Paid family leave is a necessary policy for modern families

The majority of families do not have a stay-at-home parent to provide care for children or for ailing family members. At the top of the income ladder, families are more often comprised of two earners, while at the bottom, they typically have one earner, often someone playing the dual role of sole earner and sole caretaker/parent. Among children, 71 percent live in a family with either two working parents or a single working parent, and the percentage of adult children providing care for a parent has tripled over the past 15 years. Among workers who were employed at some time while caregiving, one in five reported that they took a leave of absence from work in order to address caregiving responsibilities.

Because of the changes in how families interact with the economy, when a new child comes into the family, when a family member is seriously ill, or when a worker himself is ill, an employee needs a few weeks or more to be at home. Most families no longer can rely on a stay-at-home caregiver to provide this care, and firms cannot assume that families have someone at home. Instead, employees must negotiate time off with their employer. The District of Columbia was at the forefront of addressing the need to better balance family care and work responsibilities when it established the right to 16 weeks of unpaid leave in 1990.

However, for many low-, moderate-, and even high-income families, unpaid leave is nice, but unaffordable. The loss of income—even for just a few months—can cause a serious economic pinch for most families. Most families’ savings will cover barely a few months’ expenses.  Families must have the money to pay the rent or mortgage and put food on the table (and pay the utility bill, the health insurance copayments, and everything else), which is possible only with a regular paycheck, or at least a portion of it. This leads many to refuse unpaid leave, even when it would help them and their families address their care needs. According to a recent survey by the U.S. Department of Labor and Abt Associates, 46 percent of those who need leave but don’t take it cited an inability to afford the time off.

Paid family leave addresses a key conflict caused by the lack of a full-time, stay-at-home caregiver and keeps caregivers in the workforce. Over the past 40 years, this added employment of women has been responsible for much of the gains in family income across the income distribution. From 1979 to 2007, low-income women were responsible for all of the growth in their family income. Their earnings as a source of total family income increased by 156 percent, which more than made up for the 33 percent decrease in men’s contribution during the time. Families cannot afford to go back to having a stay-at-home caregiver.

Family economic security is important for our overall economic strength and stability

The economy is a system in which both firms and families matter. Each is a key player in our economy. Families buy goods and services from firms and, in turn, supply firms with workers by selling time. Firms buy people’s labor, or time, to produce goods and services, which they then sell to families, completing the cycle.

However, where the very purpose of a firm is to engage in the economy, the purpose of families is both economic and non-economic. Families are where we raise children and care for one another. These roles may be subjectively more important to family members than their role in the economy, which raises the importance policies such as paid family leave play in our economy.

In order to see how paid family leave will affect the D.C. economy, we need to look at all kinds of costs and benefits. Costs include all the hidden costs that may be hard to see. Costs aren’t only what firms pay out of pocket, and benefits aren’t only about more money. We also need to look at the long-term effects. Upfront costs might be obvious, but benefits may take a while to show up, especially those that affect productivity.

Policies that keep good people in their jobs save firms money. Sociologist Sarah Jane Glynn and I conducted a review of the literature on the cost of job turnover and found that up and down the pay ladder, businesses spend about one-fifth of a worker’s salary to replace that worker. Among jobs that pay $30,000 or less, the typical cost of turnover was about 16 percent of the employee’s annual pay, only slightly below the 19 percent across all jobs paying less than $75,000 a year.

Paid family leave improves wages and earnings for caregivers. In my research, I found that women who had access to paid leave when they had their first child had wages years later that were 9 percent higher than similar women who had not had access to paid leave. Other researchers have found that women who had access to job-protected maternity leave were more likely to return to their original employer. This reduced the gap in pay that mothers experience relative to nonmothers. The Rutgers University Center for Women and Work found that working mothers who took paid family leave for 30 days or more for the birth of their child are 54 percent more likely to report wage increases in the year following their child’s birth, relative to mothers who did not take leave.

Economists find that the lack of paid family leave is one reason that the United States ranks 17th out of 22 OECD countries in female labor force participation. In one recent study, Cornell University economists Francine D. Blau and Lawrence M. Kahn found that the failure to keep up with other nations and adopt family-friendly policies such as parental leave is a reason for this lack of employment.

A lower employment rate for caregivers has dramatic economic consequences. In my work with Eileen Appelbaum and John Schmitt, we estimated that, between 1979 and 2012, the greater hours of work by women accounted for 11 percent of the growth in gross domestic product. In today’s dollars, had women not worked more, families would have spent at least $1.7 trillion less on goods and services—roughly equivalent to the combined U.S. spending on Social Security, Medicare, and Medicaid in 2012.

The economic effects of paid leave are also important for families caring for an elder. According to the Bureau of Labor Statistics, about one in six Americans (16 percent) cares for an elder for an average of 3.2 hours a day. Most unpaid family caregivers—63 percent—also hold down a job; most of those with a job are employed full time. The National Alliance for Caregiving’s 2015 survey found that among those caring for an aging or ailing loved one, 61 percent reported that this negatively affected their paying job, because they needed leaves of absence, had to reduce their work hours, or received performance warnings. The survey also found that 38 percent of caregivers reported feeling high stress. This means that the “family” part of family and medical leave is important for large swaths of the U.S. workforce. This is especially true since, unlike in other countries, few elders receive support from government—about 6.4 percent of seniors are in long-term care in the United States compared with 12.7 percent across other developed economies.

Because paid family leave protects families from suffering financial setbacks when working, parents are not forced to take unpaid leave or exit the labor force entirely in order to provide care for their children. This can reduce long-term costs for state and local governments. Researchers from Rutgers University’s Center for Women and Work found that paid family and medical leave reduced the number of women who relied on public assistance. In the year after they had their child, women who took paid leave were 39 percent less likely to receive public assistance, like TANF, compared with mothers who did not take leave but returned to work. They were also 40 percent less likely to receive food stamp income in the year following a child’s birth.

Paid family leave improves a family’s ability to care for the next generation. The economists Raquel Bernal and Anna Fruttero explain that paid parental leave can increase a child’s average human capital as parents use their leave to spend time with their new baby, which, as research indicates, increases a child’s future skill level. Parental leave also enhances children’s health and development and is associated with increases in the duration of breastfeeding and reductions in infant deaths and later behavioral issues. Similarly, returning to work later is associated with reductions in depressive symptoms among mothers.

Localities—like the District of Columbia—should consider action because neither private employers nor federal policymakers have thus far addressed this urgent economic issue 

Private employers do not typically provide paid family leave. A paid family leave program covers only about 13 percent of employees. There are a number of high-profile exceptions, such as Google, which now provides 18 weeks of paid maternity leave and 12 weeks of paid paternity leave for its employees, but they are rare.

When firms do provide leave, they often only give it to their higher-paid employees. Only 5 percent of workers in the bottom quarter of earners have paid family and medical leave through their employer, compared with 21 percent in the top quarter. The trends look similar across educational categories. Unlike pensions and health insurance, uniform leave policies are not mandatory. Low-income families are least likely to be able to afford paid help to care for loved ones, so this lack of leave can quickly lead to an exit from employment or a sharp reduction in family spending.

There is no federal guarantee of paid family leave. In the absence of federal action, there is an opportunity for states and localities to develop programs and policies that provide this increasingly critical piece of help to working families. The United States is the only advanced industrialized nation without a federal law providing workers access to paid maternity leave, and one of only a handful of nations that does not offer broader family and medical leave insurance. In fact, among OECD countries, mothers are, on average, entitled to 17 weeks of paid maternity leave around childbirth alone, so the D.C. proposal is modest.

Three states—California in 2002, New Jersey in 2008, and Rhode Island in 2013—provide a model for this kind of program. In these states, paid caregiver leave for new parents and workers who need to care for a seriously ill family member was an expansion to their longstanding statewide temporary disability insurance programs. Benefits are for six weeks in California and New Jersey, four weeks in Rhode Island, and typically cover about half or more of an employee’s pay, capped at around what the typical, or median, worker earns in a week. Benefits in those states are paid for through an employee payroll deduction for family leave, though the New Jersey temporary disability insurance plan, the most expensive portion of their paid leave program, is two-thirds employer funded.

In the current bill, D.C. employers pay the insurance premium for paid leave, which makes it different than in these three states. This is due to the unique nature of our city’s ability to tax. However, like in the three states, the program spreads the costs of leave through an insurance pool. While the tax is on employers, economic research tells us that they will pass on this additional cost to either consumers, through minimal price increases, or to employees through nominal salary adjustments over time.

Paid family leave is good for the economy

Research on the effects of paid leave policies finds that leave periods up to a reasonable length of time is positive for employment outcomes, and those positive employment outcomes are consequently beneficial to the entire economy. In an extensive survey of employers and employees, the sociologist Ruth Milkman and the economist Eileen Appelbaum found that in California, the overwhelming majority of employers—9 out of 10—reported that the paid family leave program has had either no effect or positive effects on profitability or performance. Further, the researchers found that 9 out of 10 employers (87 percent) reported no increase in their costs.

Some might also argue that paid leave is bad for business because it hurts their bottom line. The truth of the matter is that this argument fails to consider the opportunity costs of not providing paid leave, the costs that businesses here in the District and around the United States face currently. Further, a standard that provides workers with paid leave that is funded in a fair, administratively effective way levels the playing field and gives all businesses the ability to compete for talent, not just those that are large and can treat paid leave as a perk rather than a right.

Paid family and medical leave fosters economic security—boosting local demand—by making it possible to sell time in a way that works for families. After California implemented paid family leave, researchers found workers, especially low-wage workers, who took paid family leave through the state program were more likely than those who did not to transition back into their job and remain in the labor force. Among workers in low-paying jobs, 88.7 percent of those who used the leave returned to their jobs, compared with 81.2 percent of those who did not use the leave. The economist Tanya Byker found that the paid family and medical leave programs in California and New Jersey increased the number of mothers in the labor force around the time when they had a child. This was particularly the case for women without a college degree. Similarly, access to family leave to care for an elder can keep people in the workforce.

Paid family leave helps close the gender pay gap because it gives both men and women time to care for their families, boosting family incomes. The percentage of leave taken by men in California has increased since the institution of the state’s paid leave program. Men’s share of parent-bonding family leave—as a percentage of all parent-bonding family leave claims—increased from 17 percent in the period from 2004 to 2005 to 30.2 percent in the period from 2011 to 2012. In addition, men in California are taking longer leaves than they did before family and medical leave insurance was available.

Conclusion

As a District resident, I am proud that the D.C. Council is considering legislation that would help not only families across the income spectrum, but our entire economy. Families living in the District and considering moving here are different from those decades ago. They don’t often have the luxury of having a parent who doesn’t have to work, but they still have to deal with the challenges of welcoming a new baby or caring for an aging spouse or parent. And helping these families stay connected to the workforce helps businesses retain quality employees and keep people who otherwise might drop out connected to the workforce. That means these families can still spend time shopping at D.C. stores and paying income taxes, rather than cutting their budgets or relying on public assistance. We know from experience in states that have implemented paid leave that these changes are benefiting both workers and businesses. I, again, am honored to be here testifying about the Universal Paid Leave Act of 2015, and I thank you for the opportunity.

Allow me to restate two key points from my testimony. First, with an added cost per employee, it is less important whether the employer or the employee pays the bill. In the end, the cost will in all likelihood be passed onto employees through either changes in nominal pay over time or a marginal addition to consumer prices.

Second, the key economic point is that having families with working caregivers isn’t just nice, it’s an economic imperative for families and for our economy more generally. This is the kind of policy that keeps people in the workforce and sustains family income. This will, in turn, sustain consumer buying power, boost local tax revenues, and lower government expenditures on programs to support the unemployed and caregivers who have trouble addressing conflicts between work and life.

The State of the Union: a Rorschach test

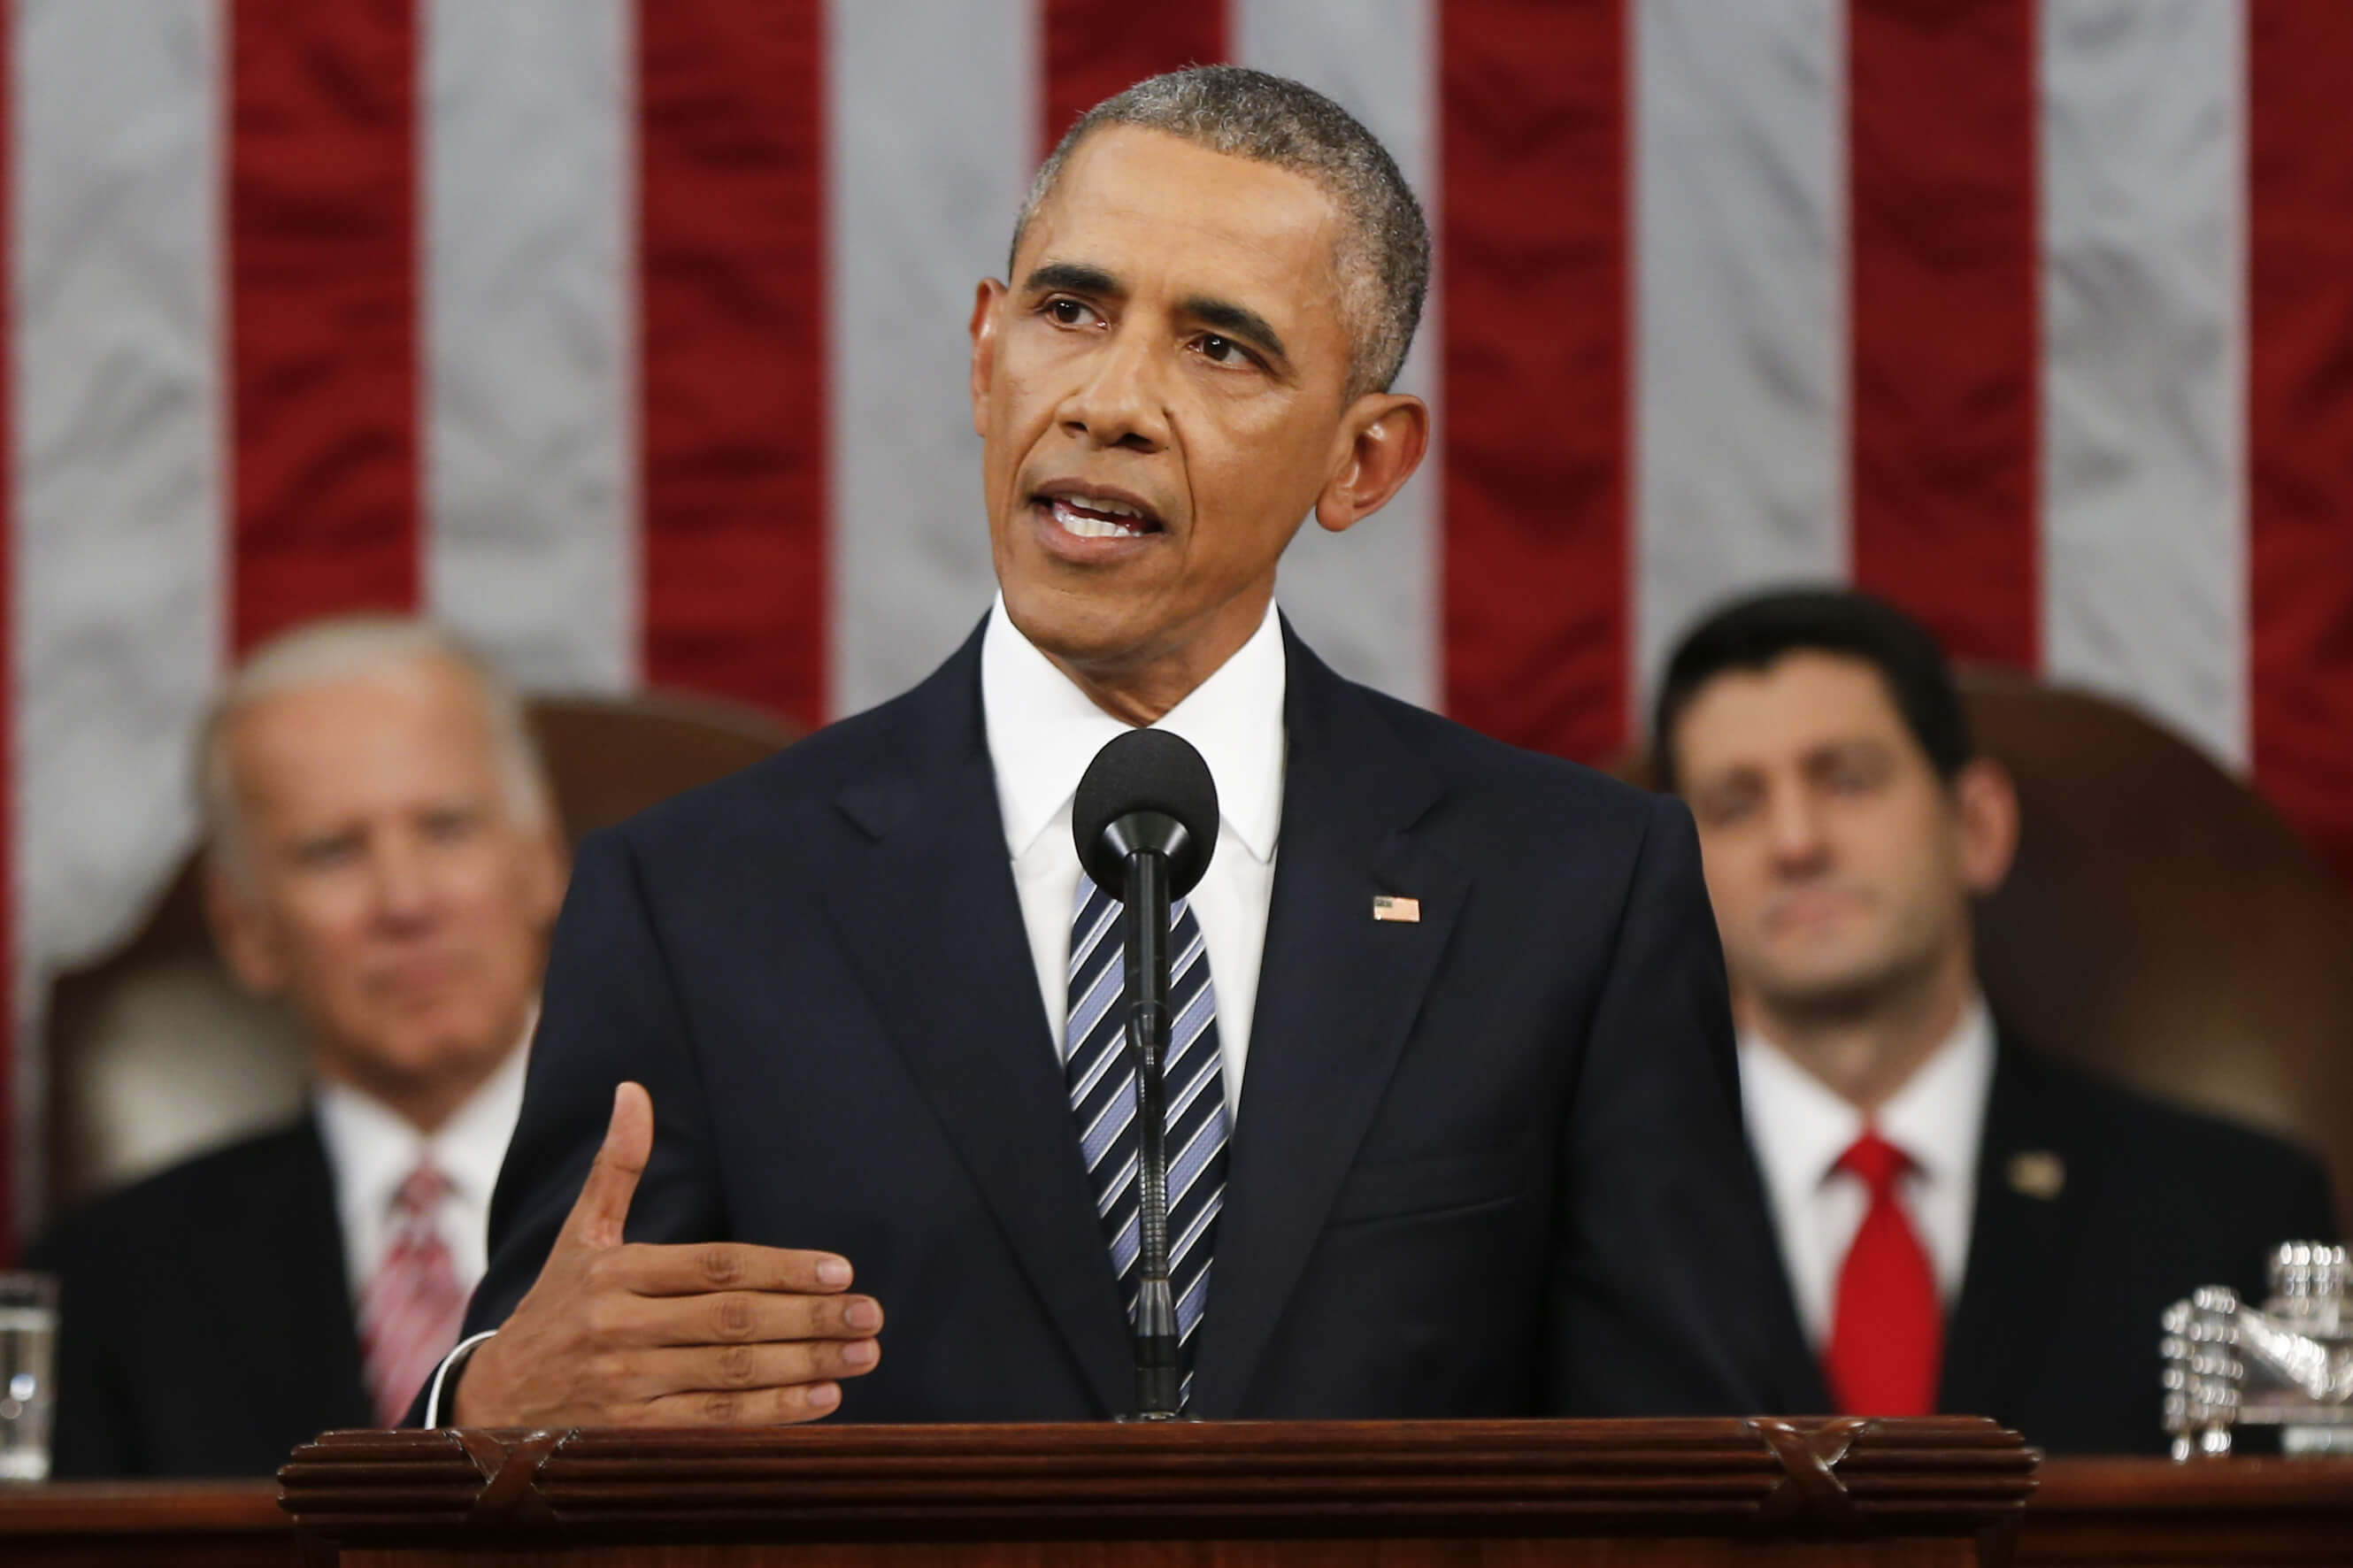
President Barack Obama delivers his State of the Union address before a joint session of Congress on Capitol Hill in Washington, Tuesday, January 12, 2016. (AP Photo/Evan Vucci, Pool)

Sometimes the truth seems like a Rorschach test. Two people can both look at the same inkblot but where I see a bunny, you see a bulldozer. We’re both right, of course, but we’re also both wrong.

Last night, as President Obama gave his final State of the Union speech, I was struck by how today’s economy seems like that famous inkblot. A large percentage of Americans believe the U.S. economy is performing poorly and that their jobs are seriously in jeopardy. The president looks at the same evidence and sees a strengthening economy.

“We’re in the middle of the longest streak of private-sector job creation in history,” he told Congress and the nation. “More than 14 million new jobs; the strongest two years of job growth since the ‘90s. An unemployment rate cut in half. Our auto industry just had its best year ever. Manufacturing has created nearly 900,000 new jobs in the past six years. And we’ve done all this while cutting our deficits by almost three-quarters.”

This is all true and it is good news. It’s especially so relative to the condition of the U.S. economy eight years ago. In January 2009 when President Obama entered the White House, the economy was shedding jobs at a rate of more than 20,000 per day. About 2.65 million homeowners were estimated to be in default in 2008, up dramatically from around 800,000 in 2005. And the stock market had shrunk by 44 percent from the beginning of 2008 to President Obama’s first inauguration. The economy appeared to be in free-fall.

Decisive action on the part of the President and Congress averted a full-scale economic collapse. But it didn’t prevent a multiplicity of smaller economic crises from happening inside families all across the United States. While there were immediate fixes made to avert a second Great Depression, serious long-term economic problems remain—ones that many Americans are fully aware of.

As President Obama acknowledged, not everyone is benefiting from the strong economic gains. For the past 40 years, our economy has been on an upward march of increasing inequality. The Great Recession and our policy responses to it didn’t change this course. According to the latest data from University of California-Berkeley economist Emmanuel Saez, between 2009 (when the economic recovery began) and 2014 (the latest year for which we have data), the top 1 percent of Americans have taken 58 percent of all economic gains. As of 2014, the bottom 99 percent had recovered just under 40 percent of the losses they suffered between 2007 and 2009.

Economic progress is important, but it must be shared. This is not just about values—although that’s important. Shared prosperity promotes economic stability. A key strength of our economy has always been our middle class. Yet the Pew Research Center reports that the share of Americans that are in middle-income households is at its lowest point since 1971.

As the president pointed out during his speech, the kind of economic security that families crave is more likely seen inside the halls of Congress than on Main Street. What’s more, many families have a nagging sense that the jobs being created aren’t as good as the ones we’ve lost. There’s fear that solid, middle-class jobs aren’t coming back. Some blame globalization or immigrants, but last night President Obama pushed the American people to focus on how “working families won’t get more opportunity or bigger paychecks by letting big banks or big oil or hedge funds make their own rules at the expense of everyone else; or by allowing attacks on collective bargaining to go unanswered.”

How do we give everyone a fair shot at opportunity and security in this new economy? Looking at what’s happening at the top of the income and wealth ladders is a good place to start. Economists are looking into the question of whether those at the top are getting more than their fair share—and they’re finding evidence that this may be the case. Armed with this data-driven research, policymakers can investigate the kind of pro-growth economic policies that may create the kind of economy that looks good to those at the top, the middle, and the bottom of the U.S. wealth and income spectrum.

Heather Boushey is Executive Director and Chief Economist at the Washington Center for Equitable Growth.

The Earned Income Tax Credit

The Earned Income Tax Credit is a federal refundable tax credit designed to encourage work, offset federal payroll and income taxes, and raise living standards for low- and middle-income working families. Introduced in 1975, the EITC has grown to be one of the largest and least controversial elements of the U.S. welfare state, with 26.7 million recipients sharing $63 billion in total federal EITC expenditures in 2013.

The placement of the EITC within the tax code has three important effects:

  1. It provides a simple means of administering the credit without the large overhead of caseworkers and other staff needed for traditional means-tested spending.
  2. It symbolically links the credit to participation in the formal economy—non-workers are ineligible. This is also an important source of popularity among politicians and policymakers on both sides of the aisle, and also likely reduces the “stigma” that attaches to recipients of traditional welfare.
  3. Tax credits are not always perceived as spending, and may not count toward congressional spending caps.

The broad political support is buoyed by an expansive academic literature that details the EITC’s benefits. Research over the past two decades has documented large increases in net incomes for low-income families who work, and startling improvement in the well-being of children in those families. EITC expansions of the 1990s dramatically increased work among single parents as well (though the expansions may have had much smaller negative effects on the employment of secondary earners in married couples). Recent research has also found extremely important benefits for children’s educational achievement and attainment.

This brief will provide an overview of the academic research evaluating the EITC’s success in boosting well-being, reducing poverty, and encouraging work among working parents. It will also detail some unintended consequences of the EITC, and provide a brief outline of proposed modifications.

View full PDF here alongside all endnotes

Who is eligible for the Earned Income Tax Credit, and for how much?

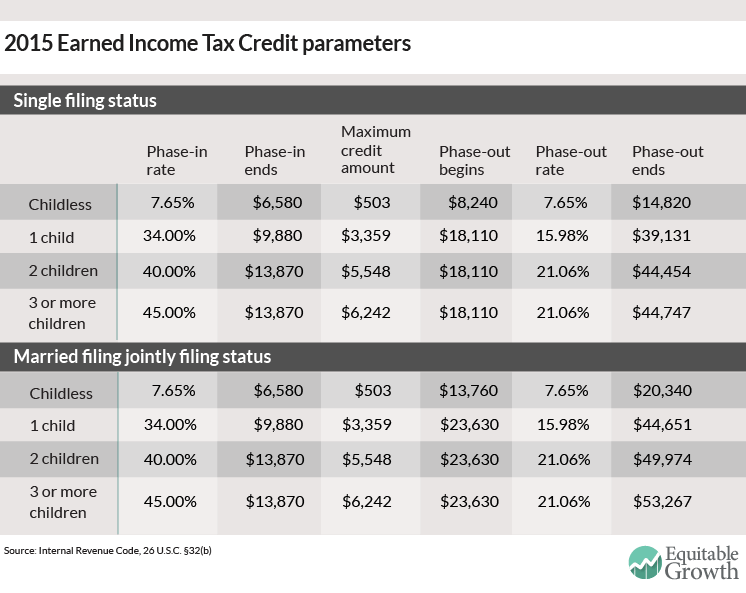
The EITC primarily goes to working parents with children, although a small number of childless individuals are also eligible. In the 2015 tax year, families with incomes below $29,000 to $53,300 (depending on the number of children and marital status) were eligible. For childless individuals, the threshold is $14,820 (or $20,300 for a married couple), and the credit is much smaller. (See Table 1 in Appendix.)

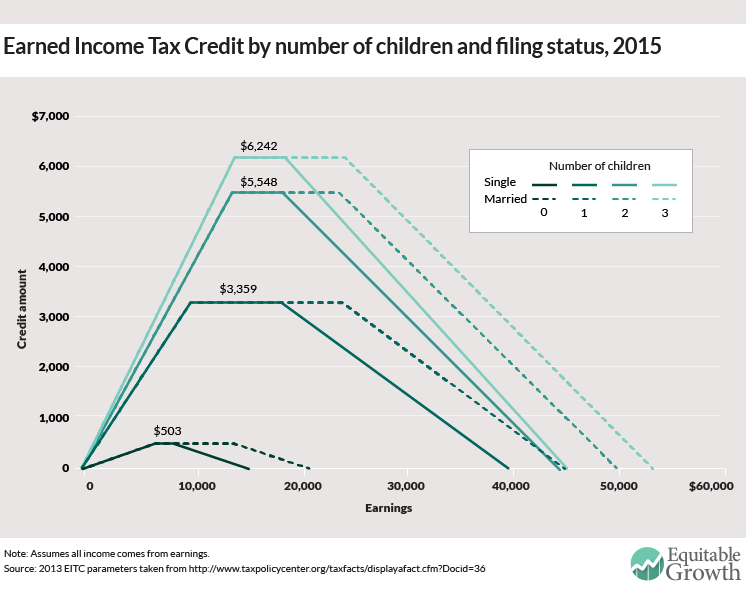
The size of the credit is dependent on how much a worker earns, the family structure (married or single), and the number of children. (See Figure 1.) For each family type, the credit is a fixed percentage of earnings until it reaches its maximum. Beyond this point, the credit is unchanged even as earnings continue to rise. For a married couple with two children, this “plateau” range spans earnings from $13,870 and $23,630, over which the credit is a constant $5,548. The credit then phases out until it reaches zero, at an earnings level of $49,974 for a married couple with two children.

In addition to the federal Earned Income Tax Credit, a number of states have incorporated EITCs into their own tax systems. These states typically offer a refundable (but sometimes non-refundable) credit equal to a percentage of the tax filer’s federal EITC. As of now, 26 states and the District of Columbia have their own EITC programs, ranging from 4 percent (for a family with one child in Wisconsin) to 40 percent (Washington, D.C.) of the federal credit. California is the most recent state to add a state EITC, with a program that takes effect in tax year 2015.

Does the Earned Income Tax Credit encourage work?

The EITC’s structure can be expected to encourage work among single parents, but to discourage it for many would-be secondary earners in married couples. Among workers, some face incentives to work more while many more face incentives to work less.

We begin with the case of a single parent faced with a decision whether to work at all. If she does not work, she will not receive an EITC (although she may receive Temporary Assistance for Needy Families, food stamps, or other transfers). If she does work and her earnings are less than $44,454 (for a two-child family), she will receive a positive EITC. This will partially offset other income taxes if any are owed, and will be refunded if they are not. Clearly, the EITC tilts this decision in favor of working, dramatically so for an individual with potential earnings below the end of the plateau range (which is $13,870 in 2015 for a single mother with two children).

For married couples, the effect can be the opposite. If one spouse makes enough to take the family out of the phase-in range on their own, then the second earner can only reduce the family’s credit by working. And while families in the phase-in range are encouraged to work more, those in the phase-out range may be encouraged to work less in order to be eligible for a larger EITC payment.

A large body of literature empirically examines the labor supply effects of the EITC expansion in the 1990s. Essentially all of the studies agree that this expansion led to sizeable increases in single mothers’ employment rates, concentrated among less-skilled women and among those with more than one qualifying child. There is some evidence of declines in married women’s labor supply, but this effect is unambiguously smaller.

What are the unintended consequences of the Earned Income Tax Credit?

Standard public economic theory implies that a negative effective tax rate that encourages more people to work will lead to a decline in overall pre-tax wages. This implies that a portion of the money spent on the EITC actually benefits employers of EITC recipients and of other workers competing in the same labor market as the recipients. This means that the EITC (like any other policy that increases labor supply, importantly including welfare work requirements) functions in part as a subsidy to employers of the workers in question. As the target recipients of the EITC tend to be relatively low income, the employer share of the benefit flows to employers of low-skill labor.

One implication is that the minimum wage can be an efficient complement to the EITC, improving the latter’s effectiveness by limiting employers’ ability to capture the credit. This runs contrary to many policy discussions in which minimum wage opponents point to the EITC as a superior alternative. Incidence considerations imply that the two policies are best thought as complements rather than substitutes, and that EITC increases strengthen the case for raising the minimum wage.

How does the Earned Income Tax Credit help the well-being of low-income working families?

Poverty

The EITC is extremely successful as an anti-poverty program. Credit eligibility is concentrated among families whose incomes (after taxes and transfers) would otherwise be between 75 percent and 150 percent of the poverty line, and take-up rates are substantially higher than in many other anti-poverty programs.

The dramatic expansion of the EITC in the mid-1990s was associated with a decline in child poverty rates in the United States (though this was almost completely reversed during the Great Recession). There were a number of causes for this decline—welfare reform and the strong economy of that period among them—but several studies have found that the EITC was an important contributor to the reduction in poverty due to its work incentives. The Census Bureau’s Supplemental Poverty Measure estimates that the poverty rate was 15.5 percent in 2013, but would have been 18.4 percent without the EITC and Child Tax Credit.

This estimate does not count the extra earnings that EITC recipients have due to their increased work. Hilary Hoynes of the University of California-Berkeley and Ankur Patel of the U.S. Treasury Department find that labor supply effects approximately double the EITC’s anti-poverty effectiveness, and that the mid-1990s expansion reduced the share of families below the poverty line by 7.9 percentage points.

The program’s effect on child poverty is even stronger: The poverty rate for those under 18 years of age was 16.4 percent, but (again ignoring labor supply responses) would have been 22.8 percent without the refundable tax credit. Based on these numbers, the EITC can be credited with lifting 9.1 million people—including 4.7 million children—out of poverty. The effects on total poverty are far larger than those of any single program except Social Security, and the effects on child poverty are the largest without exception. Again, accounting for the program’s effects on employment and earnings would lead to even larger anti-poverty effects.

Children’s educational outcomes

There is robust evidence that the EITC has quite large effects on children’s academic achievement and attainment, with potentially important consequences for later-life outcomes. Gordon Dahl of the University of California, San Diego and Lance Lochner of the University of Western Ontario find that EITC income raises combined math and reading test scores by about 6 percent of a standard deviation per $1,000 received. The EITC test score impacts appear to be larger for boys, children under 12, black or Hispanic children, and for children whose parents are unmarried. Effects of this magnitude are likely to translate into substantially better life outcomes.

There is also evidence of effects on the amount of education obtained, as distinct from achievement on standardized tests. The University of Michigan’s Katherine Michelmore found that a $1,000 increase in the maximum EITC is associated with 18- to 23-year-olds in likely EITC-eligible households being one percentage point more likely to have ever enrolled in college, and 0.3 percentage points more likely to complete a bachelor’s degree. A rough estimate of the present value of a college degree is $1 million, meaning that a 0.3 percent increase in college graduation is worth about $3,000. That means the return is about 3-to-1 for the initial investment—a large effect, especially considering that college graduation rates are not the main intention of the EITC to begin with. Similarly, Day Manoli of the University of Texas-Austin and Nick Turner of the Treasury Department also find that an extra $1,000 of EITC rebate in the senior year of high school increases college enrollment by 0.2 to 0.3 percentage points.

Health

William Evans of the University of Notre Dame and Craig Garthwaite of Northwestern University examine the EITC’s effects on women’s health before and after the 1993 expansion, finding that women reported improved mental and physical health. The expansion also led to sizable improvements in infant and child health. Hilary Hoynes; Douglas Miller of the University of California-Davis; and David Simon of the University of Connecticut find that the EITC expansion reduced the incidence of low birth weight, a widely used indicator of poor infant health.

What are some proposed modifications to the Earned Income Tax Credit?

Changes within the same basic structure

There have been a number of proposals to expand the EITC either as a whole or for particular groups. Recently, these discussions have centered on temporary EITC expansions (a larger credit for three-child families and an extended schedule for married couples) introduced in 2009, which are due to expire in 2017.

One area of concern has been incentives for non-custodial parents, or parents who do not have primary custody of their children. A focus in this area has been to create incentives for the payment of child support, by allowing these parents to receive the credit but conditioning it on the payment of child support. Non-custodial parent credits have recently been implemented in New York and Washington, D.C. An evaluation of the New York program by Austin Nichols, Elaine Sorenson, and Kye Lippold at the Urban Institute found increased work and payment of child support among non-custodial parents eligible for the credit.

A more consequential change would be to expand the EITC for childless workers more generally. This has attracted support of late from President Obama as well as prominent Republicans (notably Representative Paul Ryan (R-WI), now Speaker of the House). President Obama’s most recent proposal, part of his 2016 budget, would double the childless worker credit and extend the age ranges at which taxpayers are eligible. Work I did earlier this year with Hilary Hoynes examines the distributional impacts of the Obama proposal and of a more aggressive proposal that would bring the childless EITC to parity with that available to families with children.

Gordon Berlin, president of MDRC (a non-profit social policy research organization), proposes a more radical modification in the structure of the EITC. He would make EITC eligibility depend on individual earnings, without regard to marriage or children. This would eliminate the second worker penalty, alter marriage incentives, and generate tens of billions of dollars in additional credit payments, mostly to married couples. The expansion of the plateau phase for taxpayers married filing jointly during the 2000s have made the proposal cheaper to implement, but budgetary concerns make implementation of the proposal unlikely. A somewhat less aggressive proposal comes from the Hamilton Project’s Melissa Kearney and Lesley Turner, who propose a secondary earner deduction that would reduce but not eliminate the second worker penalty in the EITC.

There are also several recent proposals for a new EITC aimed exclusively at workers with a documented work-limiting disability, aimed at increasing employment of those with disabilities and thereby reducing strain on the Social Security Disability Insurance trust fund. Two studies done by Jun Huang of Columbia Business School and Maximillian Schmeiser at the Board of Governors of the Federal Reserve, as well as Boston College’s Matthew Rutledge, examine the likely impact of EITC expansion on people with work-limiting disabilities and find an increase in labor force participation among workers with resident children compared to those without.

Administration of the Earned Income Tax Credit

Many EITC recipients hire tax preparers to help file their taxes. In fact, the IRS estimates that 15 million EITC recipients used paid tax preparers in 2013, and one study estimates total tax preparation fees at $2.75 billion. Until recently, many of these for-profit preparers were also in the business of marketing short-term loans (known as refund anticipation loans) against eventual EITC refunds, at very high implicit tax rates.

Recent bank regulation efforts have largely eliminated refund anticipation loans, although there are still other financial products designed to capture a portion of the tax refund. The IRS encourages claimants to simply write “EITC” on their tax returns rather than attempting to calculate it, presumably in part to simplify returns so that recipients do not need to engage preparers. Moreover, not-for-profit tax preparation services exist in many areas. Nevertheless, the high cost to recipients of tax filing services remains a concern.

A second administration issue relates to the EITC’s arrival as a lump-sum payment, months after the period that it nominally covers. It seems clear that the EITC would be more effective in supporting low-income families if it could somehow be delivered more evenly throughout the year. Until 2011, EITC recipients could choose to receive a portion of their credit with each paycheck rather than as a lump sum at tax filing time via the Advance EITC program. But take-up of this option was very low—only 1 percent to 2 percent of EITC claimants—leading to its cancellation. The reasons for this are not well understood. Thus, while there is the desire to change the method of payment, I am not aware of workable proposals to do so.

Conclusion

The Earned Income Tax Credit has become the centerpiece of the U.S. safety net, surpassing all other transfer programs (save perhaps Social Security) in the number of beneficiaries, total expenditures, or poverty reduction impacts. The evidence clearly indicates that it is a remarkably successful program, with important impacts on recipients’ labor supply and health and on their children’s health and educational outcomes.

Appendix

Photo of mother and daughter, veer.com

A snapshot of the long-term impacts of universal pre-k in New Hampshire

If the United States were to invest in a public, voluntary, high-quality universal prekindergarten program starting in 2016 and fully phased in by 2017, what would the long-term impacts be for ? Our study looks to quantify the long-term benefits and costs of investing in a high-quality universal prekindergarten program available to all 3- and 4-year-olds across the United States. Use the data and interactives below to explore how a universal prekindergarten program would affect .

Who would participate?

Currently, in , percent of 3- and 4-year-olds ( children) participate in state-sponsored prekindergarten. Unfortunately, the quality of these programs varies significantly, which means that preschoolers do not always experience the same benefits or long-term effects. If a universal prekindergarten program were enacted in 2016 and fully phased in by 2017, percent of 3- and 4-year-olds ( children) would be enrolled in public prekindergarten, benefiting from a high-quality early childhood education.

What are the benefits of a universal prekindergarten program?

High-quality prekindergarten education can generate significant long-run benefits for participating children, their families, and even other non-participants. Longitudinal studies have shown, for example, that aside from improved educational achievement, children who have attended a prekindergarten program have spent less time in special education and had lower grade retention rates. These children also experience less child maltreatment and reduced crime, smoking, and depression rates over the course of their lives. In addition, both participating children and their parents have higher projected earnings, which subsequently increases government tax revenue.

If a universal prekindergarten program were to start in the United States in 2016, would see more than $ million in total benefits in 2050, amounting to savings of $ per capita that year. Here’s how these total benefits break down:

  • $ per person is attributed to savings to government.
  • $ per person comes from increased compensation.
  • The remaining $ per person is accounted for by savings to each individual from better health and less crime.

What are the costs?

Currently, spends $ per capita per year on preschool programs, special education services, and Head Start. In 2017, when a universal prekindergarten program is fully phased in, it would take an investment of $ more per capita per year to maintain a high-quality prekindergarten program.

There are three main costs associated with a high-quality universal prekindergarten program: the cost of the program, increased high school attendance, and increased college attendance. The program itself is based on Chicago’s comprehensive high-quality Child-Parent Center half-day program, so the costs take into account the multitude of services that are provided at the Child-Parent Center offset by the current spending on similar early childhood education programs as to not double-count expenditures. Because studies have shown that students who attend prekindergarten have higher high school completion rates and are more likely to attend college, these usage costs are also factored into the total cost of a universal prekindergarten program.

In 2050, these costs add up to an additional $ million, or $ per capita in . $ per capita is attributed to program costs, $ comes from increased high school usage per person, and the remaining $ per person is accounted for by increased college attendance.

How do the benefits compare to the costs?

If a high-quality universal prekindergarten program were to start in the United States in 2016 and be fully phased in by the end of 2017, the program would require a total of $ million in taxpayer dollars. Over time, the cost would eventually grow to include the cost of additional high school and college attendance. And by 2050, there would be more than $ million in total benefits compared to merely $ million in total costs, yielding net benefits of $ million. By 2050, for every dollar invested in a universal program, there would be $ in returns.

To see the national numbers, return to the full report.

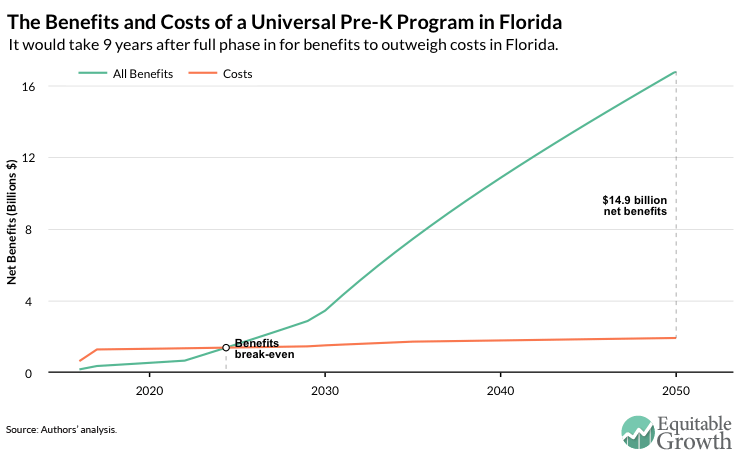
A snapshot of the long-term impacts of universal pre-k in Florida

If the United States were to invest in a public, voluntary, high-quality universal prekindergarten program starting in 2016 and fully phased in by 2017, what would the long-term impacts be for ? Our study looks to quantify the long-term benefits and costs of investing in a high-quality universal prekindergarten program available to all 3- and 4-year-olds across the United States. Use the data and interactives below to explore how a universal prekindergarten program would affect .

Who would participate?

Currently, in , percent of 3- and 4-year-olds ( children) participate in state-sponsored prekindergarten. Unfortunately, the quality of these programs varies significantly, which means that preschoolers do not always experience the same benefits or long-term effects. If a universal prekindergarten program were enacted in 2016 and fully phased in by 2017, percent of 3- and 4-year-olds ( children) would be enrolled in public prekindergarten, benefiting from a high-quality early childhood education.

What are the benefits of a universal prekindergarten program?

High-quality prekindergarten education can generate significant long-run benefits for participating children, their families, and even other non-participants. Longitudinal studies have shown, for example, that aside from improved educational achievement, children who have attended a prekindergarten program have spent less time in special education and had lower grade retention rates. These children also experience less child maltreatment and reduced crime, smoking, and depression rates over the course of their lives. In addition, both participating children and their parents have higher projected earnings, which subsequently increases government tax revenue.

If a universal prekindergarten program were to start in the United States in 2016, would see more than $ million in total benefits in 2050, amounting to savings of $ per capita that year. Here’s how these total benefits break down:

  • $ per person is attributed to savings to government.
  • $ per person comes from increased compensation.
  • The remaining $ per person is accounted for by savings to each individual from better health and less crime.

What are the costs?

Currently, spends $ per capita per year on preschool programs, special education services, and Head Start. In 2017, when a universal prekindergarten program is fully phased in, it would take an investment of $ more per capita per year to maintain a high-quality prekindergarten program.

There are three main costs associated with a high-quality universal prekindergarten program: the cost of the program, increased high school attendance, and increased college attendance. The program itself is based on Chicago’s comprehensive high-quality Child-Parent Center half-day program, so the costs take into account the multitude of services that are provided at the Child-Parent Center offset by the current spending on similar early childhood education programs as to not double-count expenditures. Because studies have shown that students who attend prekindergarten have higher high school completion rates and are more likely to attend college, these usage costs are also factored into the total cost of a universal prekindergarten program.

In 2050, these costs add up to an additional $ million, or $ per capita in . $ per capita is attributed to program costs, $ comes from increased high school usage per person, and the remaining $ per person is accounted for by increased college attendance.

How do the benefits compare to the costs?

If a high-quality universal prekindergarten program were to start in the United States in 2016 and be fully phased in by the end of 2017, the program would require a total of $ million in taxpayer dollars. Over time, the cost would eventually grow to include the cost of additional high school and college attendance. And by 2050, there would be more than $ million in total benefits compared to merely $ million in total costs, yielding net benefits of $ million. By 2050, for every dollar invested in a universal program, there would be $ in returns.

To see the national numbers, return to the full report.