What happened to the job ladder in the 21st century?

The job ladder, Veer.com

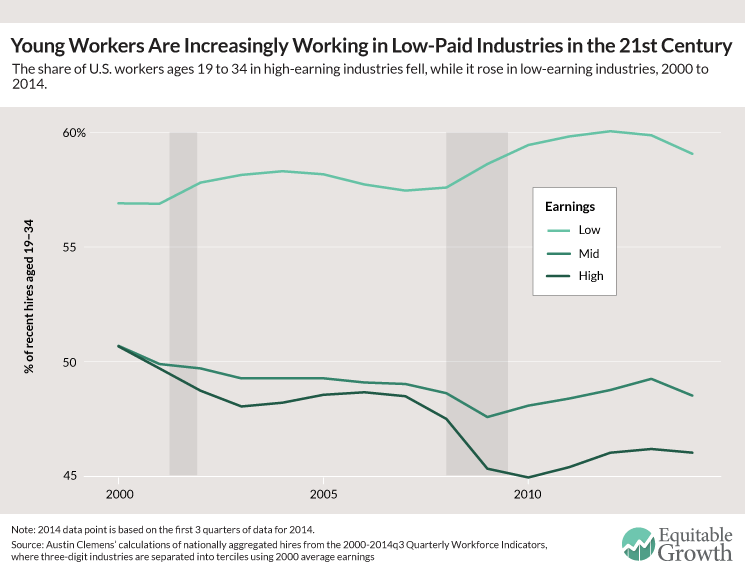
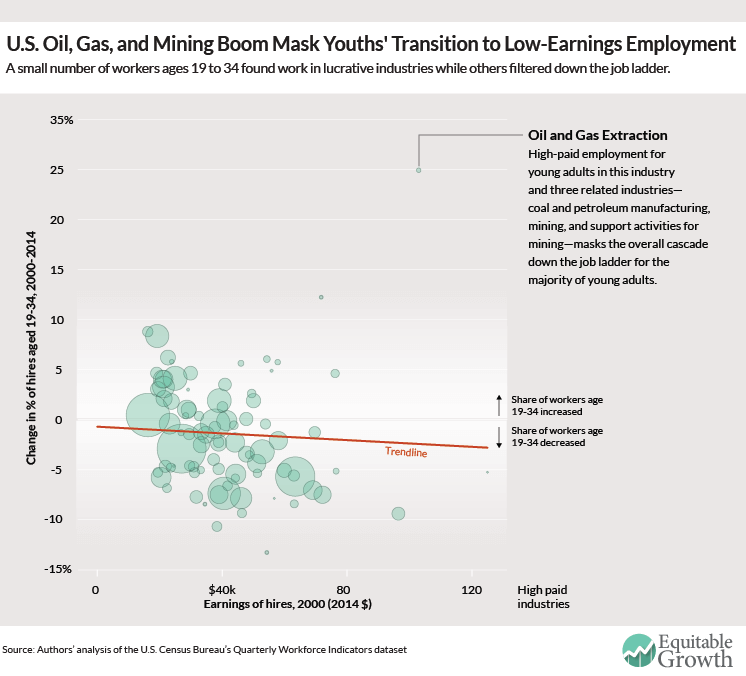
A few weeks ago, we published an analysis showing that the lowest-paying industries saw the largest increases in workers with a college degree between 2000 and 2014. Today, we follow that up by showing that the pattern is similar among young workers ages 19 to 34 (as opposed to workers with a college degree), but with one big difference—the oil, gas, and mining resource extraction and refining industries, which pay relatively well, saw a substantial increase in the share of young workers hired.

Considered alongside our previous results, this new analysis implies that resource extraction and refining industries provided an outlet for young workers without college degrees to attain well-paying employment. These industries profited from the development of hydraulic fracturing and other new technologies, as well as a worldwide boom in demand for natural resources that seems to have reversed since late 2014.

Figure 1

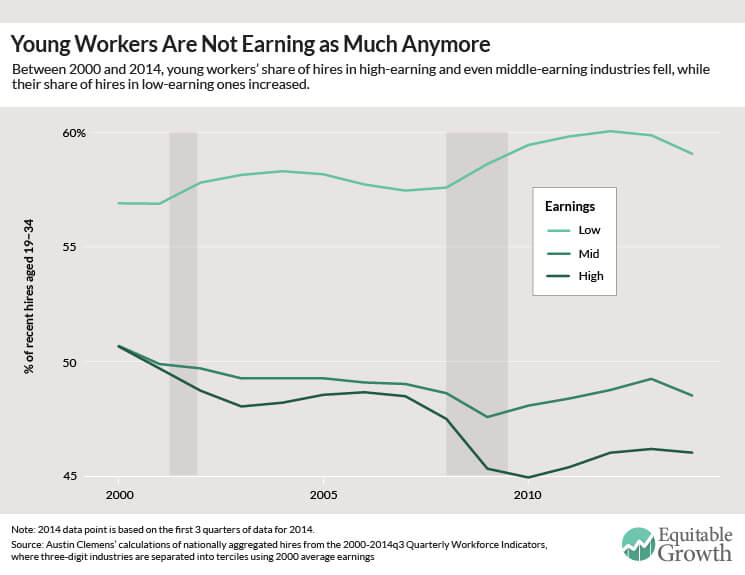
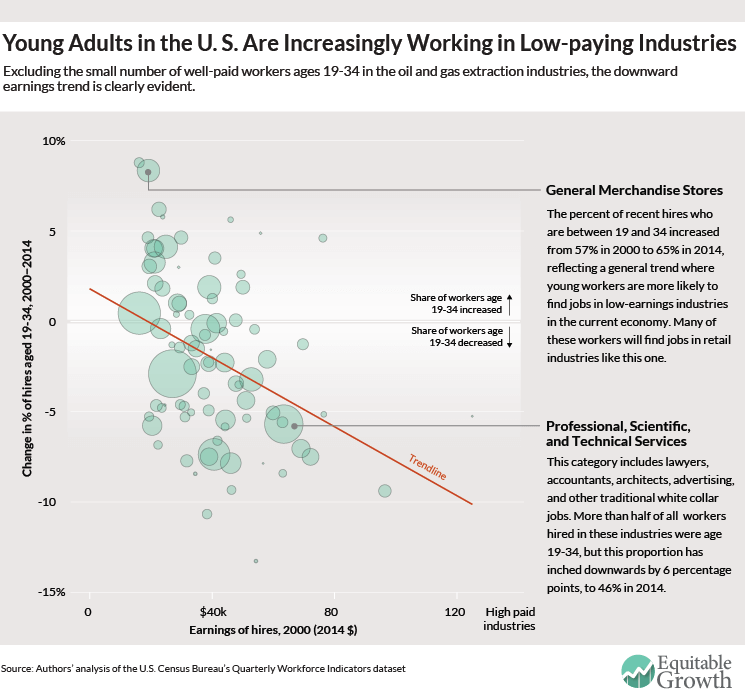
But these young adults working in the high-paid extraction and refining sectors obscures the larger picture of the U.S. job ladder: Outside those industries, young workers are increasingly being hired into low-paying ones. That is important to document because, as we discussed in our previous column, the education level for most workers in the U.S. Census Bureau’s Quarterly Workforce Indicators database is imputed rather than observed directly—and that imputation is potentially faulty since it is based on the 2000 Census. In contrast, the age of workers is observed directly for the vast majority of workers.

Figure 2

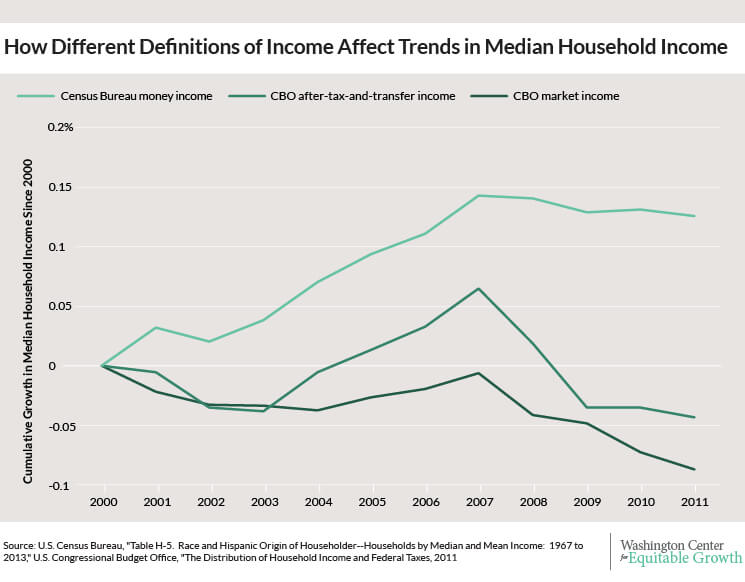
Looking at the share of young workers hired in each quarter between 2000 and 2014 yields further insight, which our colleague Kavya Vaghul discussed in part in her column last week on the impact of student debt on economic security. It divides industries into thirds based on their average earnings in 2000, then traces the share of hires in each industry that went to young workers. The share of young workers hired in high-paying industries shrank right at the onset of the Great Recession, while in its aftermath that share grew in low-paying ones. (See Figure 3.)

Figure 3

These findings are consistent with previous findings on the evolution of the job ladder during and after the Great Recession of 2007-2009, though our analysis indicates that the job ladder had already started deteriorating even before that, following the recession of the early 2000s.

The labor market has always been characterized by what economists call a “last in/first out” or “last hired/first fired” structure, meaning that workers who are laid off during recessions are generally those with the shortest job tenure, many of whom tend to be young. We also know that high-paying firms exhibited the greatest decline in hiring during the Great Recession. In combination, these two patterns imply that young adult workers disproportionately lost out at high-paying firms and industries, which is what the darkest green line in Figure 3 shows.

Following the Great Recession, employment grew most in low-wage jobs, so that is where young adults entering the workforce could find work—even if they had a college education. And because the high-wage firms and industries aren’t hiring, many of these workers are stuck in low-wage jobs. That failure of the job ladder portends dire consequences for young workers’ lifetime earnings since the peak years for job-switching and wage growth are the early ones. If these workers do not find opportunities to climb, then they will potentially be stuck on the lower income rungs for the rest of their lives.

Appendix

The construction of the U.S. Census Bureau’s Quarterly Workforce Indicators, the data from which these charts are constructed, is discussed in the appendix to our previous column. To make these charts on young adult workers’ share of hires, we define “young adult workers” as QWI age groups 2, 3, and 4 (comprised of workers ages 19 to 34), and we exclude groups 1 (ages 14 to 18) and 8 (ages 65 to 99) from the analysis entirely. Industry average earnings of full-quarter hires in 2000, or EarnHiraS, are deflated to 2014 dollars using the U.S. Consumer Price Index for all Urban Consumer, or CPI-U. When industries are divided into thirds according to earnings levels in Figure 3, the three groups are weighted by employment so that each group corresponds to approximately one third of the total U.S. workforce.

The observations excluded between Figures 1 and 2 are the North American Industrial Classification System (three-digit) industries 211 (Oil and Gas Extraction), 212 (Mining except Oil and Gas), 213 (Support Activities for Mining), and 324 (Petroleum and Coal Products Manufacturing, including Oil Refineries).

The pernicious effects of growing student debt on the economic security of young workers

Student debt illustration by David Evans, Equitable Growth

Student loans in the United States are now the second-largest source of debt, totaling $1.1 trillion shared among 42 million people with no sign of slowing down. Unfortunately, many questions about student debt, the characteristics of borrowers, and the nature of delinquency remain unanswered, primarily because agencies and researchers alike lacked access to the rich data in the U.S. Department of Education’s loan portfolio.

That changed last week when Adam Looney of the U.S. Department of the Treasury and Constantine Yannelis of Stanford University released an impressive new report that makes use of administrative data on student borrowing and earnings from linked, de-identified tax records to explore the student debt terrain.

Student debt nearly quadrupled over the past 15 years, and Looney and Yannelis find that the accelerated growth is largely due to a new type of borrower: students attending for-profit colleges. During the Great Recession, the number of students attending for-profit universities grew significantly in response to poor employment opportunities and a weak labor market. As a consequence, the number of borrowers grew too. Looney and Yannelis find that most of these “non-traditional” borrowers are vulnerable individuals who mostly come from lower-income backgrounds. Although average loan balances for borrowers who graduate from for-profit schools are smaller than those of nonprofit undergraduates or graduate students, these for-profit students face worse labor market opportunities, lower earnings, and, ultimately, much higher delinquency rates than their traditional college counterparts.

But just because the student loan crisis is concentrated among non-traditional borrowers does not mean that students attending a selective, non-profit, four-year university have it easy: The current labor market is not kind to young workers, even with traditional college degrees.

Young workers rely on job-to-job flows—transitioning between jobs to find better offers—in order to build their careers, move up the job ladder, and grow their earnings. Low unemployment allows workers to quit their jobs to search for more fruitful employment. When the labor market contracted during the Great Recession of 2007-2009, however, these job-to-job flows fell. Economists Giuseppe Moscarini of Yale University and Fabien Postel-Vinay of University College London find that during the recession, the jobs ladder shut down, trapping young workers in low-wage jobs. (See Figure 1.)

Figure 1

The danger for recent college graduates is that carrying a large load of student debt requires young people to remain employed, even at jobs that don’t pay well, and hence restricts their ability to search out better opportunities for long-term earnings growth.

Joseph Altonji, Lisa Kahn, and Jamin Speer of Yale University report that all recessions have a damaging long-term effect on recent college graduates no matter what they majored in. For the average major, a recession means a 10 percent reduction in earnings in their first year out of college. In past recessions, high-paying majors such as engineering were less adversely affected, but in the Great Recession, even an engineering degree wasn’t sufficient protection. The three researchers find that between 2007 and 2009, the effect of unemployment on earnings halved the relative advantage that a high-paying major previously guaranteed.

So if young, traditional college graduates are being challenged by the post-recession labor market, what happens when high levels of student debt are thrown into the mix? In a recent paper, Emmanuel Saez and Gabriel Zucman of the University of California-Berkeley find that between 1986 and 2012, the wealth of the bottom 90 percent of the wealth distribution in the United States didn’t grow at all. With the little wealth that is, it’s unlikely that recent graduates with large student debt are able to accumulate any savings after servicing their student debts. In fact, the Pew Research Center’s tabulations of the Survey of Consumer Finances show that college-educated householders under 40 who have student debt have one-seventh of the wealth of people who don’t.

Student debt is a long-term burden in other ways too. Paying off college loans displaces other costs associated with our traditional perception of U.S. adulthood and the economic life-cycle. Economists David Cooper and J. Christina Wang of the Federal Reserve Bank of Boston find that homeownership rates among college graduates ages 30 to 40 are lower for households with student debt. Similarly, other studies show that car ownership and marriage rates are also lower for young student borrowers.

As the student debt load grows for young borrowers, it is clear there may be long-term effects on young workers’ economic security. Just a generation ago, higher education was considerably more affordable or at least heavily subsidized by state governments, enabling young workers to begin saving and eventually realize the American Dream. But now, higher education is a transformative economic burden for the young workforce. And for the amount of student debt that graduates face upon entering the workforce, higher education certainly has not yielded commensurate benefits.

Putting the new U.S. Census data on income and poverty in context

Earlier this morning, the U.S. Census Bureau released new data on the state of incomes in 2014. According to the new data, the share of income going to the top 5 percent of American households is at 21.9 percent, a 0.3 percentage point decrease from 2013. Similarly, the Gini coefficient (a broad measure of income inequality) was essentially unchanged at 0.480. The official poverty rate stood still at 14.8 percent.

The important new data released today, however, are far from the only source of data on income and poverty trends in the United States. Other datasets paint a different story of family economic wellbeing. For instance, the flat levels of income inequality over the course of 2014 in the Census data diverge from evidence of rising inequality in other data on family incomes. Using tax data, University of California-Berkeley economist Emmanuel Saez finds that the share of income going to the top one percent increased by 1.1 percentage points in 2014. Understanding the state of income inequality and poverty in the United States means we have to be aware of what the Census data can and cannot tell us about the broader trends.

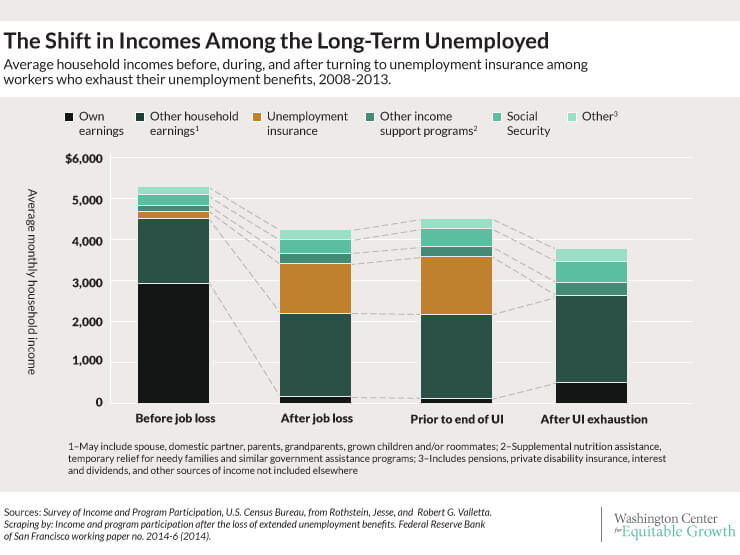
Case in point: it’s important to keep in mind what the Census Bureau considers as “income,” which can be defined in a number of ways. It could focus on income that’s earned strictly from work or investments (“market income”), or it could focus on income after accounting for the effects of government spending programs and taxes (“after-tax-and-transfer income”). The Census takes a third route with its preferred measure, called “money income.”

Money income includes some government programs (such as Social Security or unemployment compensation) but not all of them (such as in-kind transfers including the Supplemental Nutrition Assistance Program, also known as food stamps). It doesn’t include the value of some market income (such as employer-provided health insurance). And it doesn’t include the effects of taxation.

The difference between the Census’s definition of money income and data sources that use a different definition can paint different pictures of what’s happening to the U.S. economy.

Consider trends in income for the median household (the household that’s directly in the middle of the distribution of income in the United States). According to the Census Bureau data using money income, median household income dropped by 8.7 percent from 2000 to 2011. But Congressional Budget Office data on after-tax-and-transfer income shows a much different picture. Over the same time period, that data set shows median household income increasing by 13 percent. The CBO data on market income show a decline of only 4.3 percent. (See Figure 1.)

Figure 1

Something similar happens when we look at the poverty rate in the United States. The Census Bureau’s official poverty rate shows an essentially flat trend over the past few decades, rising only from 14 percent in 1967 to 15 percent in 2012. But the official rate doesn’t include the effects of many anti-poverty programs that aren’t straight cash transfers.

Researchers at Columbia University created a series that accounts for these additional programs among other factors, and the trend is quite different from the official series—poverty starts much higher at 26 percent in 1967 and then declines to 16 percent in 2012. So while this trend shows a decline in the poverty rate over the years (due mainly to an expanded social safety net), it also illustrates the significant share of the population still in poverty. In 2014, the supplemental poverty measure was slightly above the official poverty rate.

The Census has its own preliminary alternative measure of poverty (the “Supplemental Poverty Measure”) that takes into account the research communities’ findings on how best to measure poverty. Like the Columbia University team’s measure, the Supplemental Poverty Measure also includes many anti-poverty programs that offer “in-kind” support rather than cash benefits. Today’s Census data using the Supplemental Poverty Measure pegs poverty at 15.3 in 2014.

The data released today are an important update on the state of income and poverty in the United States. The Census data fill out a picture of a U.S. economy where too many families are struggling, and where the typical family’s income remains 6.5 percent lower than it was prior to the Great Recession. While the Census figures certainly aren’t the final word on the issue, this release is a key addition to our ability to understand some of the most important trends—inequality and poverty—in the U.S. economy today.

Understanding economic inequality and growth at the top of the income ladder

Thanks in large part to the ground-breaking work of Paris School of Economics professor Thomas Piketty, and his co-authors, including University of California-Berkley economics professor Emmanuel Saez, we know that we are living in an era of widening inequality. The share of post-tax-and-transfer income going to the top 1 percent of earners increased from nearly 8 percent in 1979 to about 17 percent in 2007. Over the course of the current economic recovery, the top 1 percent has received 95 percent of all pre-tax income gains—seeing a 31 percent increase in their incomes—while the bottom 99 percent saw a meager 0.4 percent increase.

Economists hypothesize several reasons for this sharp increase in income inequality, among them rising pay for chief executives and other senior executives, increasing returns to superstar workers, the rise of the financial industry, and the decline in top-income tax rates.But this debate is far from over. And the issue is not just income inequality. Economic inequality is on the rise across a variety of dimensions, including wealth. According to research by Saez and Gabriel Zucman, assistant professor of economics at the London School of Economics, the share of wealth owned by the top 0.01 percent has increased 4-fold over in the past 35 years.

Graphical-top

Piketty’s data makes the case that the steady accumulation of wealth at the top of the income spectrum is one of the most important ways that income inequality affects our economy. While there may be a theoretical argument for why higher incomes provide greater incentives for individual effort or inventing the next “big thing,” it may also be that, beyond a certain point, income and wealth inequality dampens incentives as the wealthy increasingly seek to preserve their wealth rather than risk it in potentially productive endeavors while the non-wealthy are locked out due to “opportunity hoarding” by those at the top.

One fundamental issue that Piketty’s book, “Capital in the 21st Century,” compels us to consider is the interaction between the flow of income and the stock of wealth. Does today’s flow of income to the very top of the economic ladder calcify into tomorrow’s wealth inequality? After all, the very high incomes that some people earn will allow them to build larger and larger stocks of capital over time.

Do we need to address rising income or wealth inequality in order to save our capitalist economy? How can we do so without hurting the vibrancy of today’s economy? The three essays in this section of our conference report—by UC-Berkeley economist Emmanuel Saez, Michael Ettlinger, founding director of the University of New Hampshire Carsey School of Public Policy, and Northwestern University sociology PhD candidate Fiona Chin—discuss the state of top incomes, the consequences of their rise, and possible policies to promote more widely shared economic growth. —Heather Boushey

Download the full 2014 conference booklet, with full citations included for all of the essays, including those addressing the top of the income ladder on this page

The Explosion of U.S. Income and Wealth Inequality

by Emmanuel Saez

In the United States today, the share of total pre-tax income accruing to the top 1 percent has more than doubled over the past five decades. The wealthy among us (families with incomes above $400,000) pulled in 22 percent of pre-tax income in 2012, the last year for which complete data are available, compared to less than 10 percent in the 1970s. What’s more, by 2012 the top 1 percent income earners had regained almost all the ground lost during the Great Recession of 2007-2009. In contrast, the remaining 99 percent experienced stagnated real income growth—after factoring in inflation—after the Great Recession.

Another less documented but equally alarming trend has been the surge in wealth inequality in the United States since the 1970s. In a new working paper published by the National Bureau of Economic Research, Gabriel Zucman at the London School of Economics and I examined information on capital income from individual tax return data to construct measures of U.S. wealth concentration since 1913. We find that the share of total household wealth accrued by the top 1 percent of families— those with wealth of more than $4 million in 2012—increased to almost 42 percent in 2012 from less than 25 percent in the late 1970s. Almost all of this increase is due to gains among the top 0 .1 percent of families with wealth of more than $20 million in 2012. The wealth of these families surged to 22 percent of total household wealth in the United States in 2012 from around 7.5 percent in the late 1970s.

The flip side of such rising wealth concentration is the stagnation in middle-class wealth. Although average wealth per family grew by about 60 percent between 1986 and 2012, the average wealth of families in the bottom 90 percent essentially stagnated. In particu­lar, the Great Recession reduced their average family wealth to $85,000 in 2009 from $130,000 in 2006. By 2012, average family wealth for the bottom 90 percent was still only $83,000. In contrast, wealth among the top 1 percent increased substantially over the same period, regaining most of the wealth lost during the Great Recession.

For both wealth and income, then, there is a very uneven recovery from the losses of the Great Recession, with almost no gains for the bottom 90 percent, and all the gains concentrated among the top 10 percent, and especially the top 1 percent. How can we explain such large increases in income and wealth concentration in the United States and what should be done about it?

Contrary to the widely held view, we cannot blame everything on globalization and new technologies. While large increases in income concentration occurred in other English-speaking countries such as the United Kingdom or Canada, other developed-nation members of the Organisation for Economic Cooperation and Development, such as those in continental Europe or Japan, experienced far smaller increases in income concentration. At the same time, income tax rates on upper income earners have declined significantly since the 1970s in many OECD countries, particularly in English-speaking ones. Case in point: Top marginal income tax rates in the United States and the United Kingdom were above 70 percent in the 1970s before President Ronald Reagan’s administration and Prime Minister Margaret Thatcher’s government drastically cut them by 40 percentage points within a decade.

New research I published this year with Paris School of Economics profes­sor Thomas Piketty and Stefanie Stantcheva at the Massachusetts Institute of Technology shows that, across 18 OECD countries with sufficient data, there is indeed a strong correlation between reductions in top tax rates and increases in the top 1 percent’s share of pre-tax income from the 1960s to the present. Our research shows that the United States experienced a 35-percentage point reduc­tion in its top income tax rate and a ten-percentage point increase in the share of pre-tax income earned by the top 1 percent. In contrast, France and Germany saw very little change in their top tax rates and the share of pre-tax income accrued by the top 1 percent over the same period.

The evolution of top tax rates is a good predictor of changes in pre-tax income concentration. There are three scenarios to explain the strong response of top pre-tax incomes to top tax rates. They have very different policy implications and can be tested in the data.

First, higher top tax rates may discourage work effort and business creation among the most talented—the so-called supply-side effect of higher taxes. In this scenario, lower top tax rates would lead to more economic activity by the rich and hence more economic growth. Yet the overwhelming evidence shows that there is no correlation between cuts in top tax rates and average annual real (inflation-adjusted) GDP-per-capita growth since the 1960s. Countries that made large cuts in top tax rates, such as the United Kingdom and the United States, have not grown significantly faster than countries that did not, such as Germany and Denmark.

Second, higher top tax rates could increase tax avoidance. In that scenario, increas­ing top rates in a tax system riddled with loopholes and tax avoidance opportuni­ties is not productive. A better policy would be first to close loopholes in order to eliminate most opportunities for tax avoidance and only then increase top tax rates. Conservative commentators argue that the surge in pre-tax incomes discussed above could be indicative of tax avoidance in the 1970s, when top earners were presumably hiding a large fraction of their income amid high taxes.

If this tax avoidance scenario were true, then charitable giving among top earners should have decreased once top tax rates were cut. After all, charitable giving is tax deductible and thus is more advantageous precisely when top tax rates are high. In fact, charitable giving among the rich surged pretty much in the same proportion as their reported incomes over the past several decades. If the rich are able to give so much more today than in the 1970s, it must be the case that they are truly richer.

Third, while standard economic models assume that pay reflects productivity, there are strong reasons to be skeptical, especially at the top of the income ladder where the actual economic contribution of managers working in complex organizations is particularly difficult to measure. In this scenario, top earners might be able partly to set their own pay by bargaining harder or influencing executive compensation com­mittees. Naturally, the incentives for such “rent-seeking” are much stronger when top tax rates are low.

In this scenario, cuts in top tax rates can still increase the share of total household income going to the top 1 percent at the expense of the remaining 99 percent. In other words, tax cuts for the wealthiest stimulate rent-seeking at the top but not overall economic growth—the key difference from the supply-side scenario that justified tax cuts for high income earners in the first place.

Up until the 1970s, policymakers and public opinion probably considered—rightly or wrongly—that at the very top of the income ladder pay increases reflected mostly greed or other socially wasteful activities rather than productive work. This is why poli­cymakers were able to set marginal tax rates as high as 80 percent in the United States and the United Kingdom. The Reagan-Thatcher supply side revolutions succeeded in making such top tax rate levels unthinkable, yet after decades of increasing income concentration alongside mediocre economic growth since the 1970s followed by the Great Recession, a rethinking of that supply side narrative is now underway.

Zucman and I show in our new working paper that the surge in wealth concentra­tion and the erosion of middle class wealth can be explained by two factors. First, differences in the ability to save by the middle class and the wealthy means that more income inequality will translate into more inequality in savings. Upper earners will nat­urally save relatively more and accumulate more wealth as income inequality widens.

Second, the saving rate among the middle class has plummeted since the 1980s, in large part due to a surge in debt, in particular mortgage debt and student loans. With such low savings rates, middle class wealth formation is bound to stall. In contrast, the savings rate of the rich has remained substantial.

If such trends of growing income inequality and growing disparity in savings rates between the middle class and rich persist, then U.S. wealth inequality will continue to increase. The rich will be able to leave large estates to their heirs and the United States could find itself becoming a patrimonial society where inheritors dominate the top of the income and wealth distribution as famously pointed out by Piketty in his new book “Capital in the 21st Century.”

What should be done about the rise of income and wealth concentration in the United States? More progressive taxation would help on several fronts. Increasing the tax rate as incomes rise helps curb excessive and wasteful compensation of top income earners. Progressive taxation of capital income also reduces the rate of return on wealth, making it more difficult for large family fortunes to perpetuate themselves over generations. Progressive estate taxation is the most natural tool to prevent self-made wealth from becoming inherited wealth. At the same time, complementary policies are needed to encourage middle class wealth forma­tion. Recent work in behavioral economics by Richard Thaler at the University of Chicago and Cass Sunstein at Harvard University shows that it is possible to encourage savings and wealth formation through well-designed programs that nudge people into savings. –Emmanuel Saez is a professor of economics  and Director of the Center for Equitable Growth at the University of California-Berkeley

Addressing Economic Inequality Requires a Broad Set of Policies and Cooperation

by Michael Ettlinger

There are any number of policies suggested by policymakers, academics and commentators for addressing economic inequality. A representative sample would include tax redistribution, improving education, raising the minimum wage, direct government job creation, employer hiring incentives, subsidized child care, better retirement security, a stronger social safety net, direct middle- and low-income subsidies, ending the socialization of environmental degra­dation, aggressive financial market regulation, stronger trade unions, more invest­ment in public goods (paid for by the better off), socially responsible trade policy, immigration reform, corporate governance changes, and campaign finance reform.

That’s certainly a formidable list, but interestingly most analysts and advocates who care about economic inequality focus on just one or two of these—typically offer­ing a concise, but ultimately unsatisfying recipe. Given the rapidly rising levels of inequality, when one reads the typical, short, policy agenda, it’s hard not to have a feeling of ennui—a sense that the solution offered falls well short of what’s needed to solve the problem or is completely impractical.

It is, for example, hard to believe that better educational opportunities is the com­plete answer. Improving education has huge virtue in terms of economic advance­ment at the individual level, creating opportunity, personal fulfillment, and overall economic growth. But, aside from anything else, at the rate we’re going, we’ll have again doubled our level of inequality by the time substantial numbers of people are likely to benefit from improved education. And it’s not like we’ve licked how exactly to improve education or that it’s clear that improved education solves the problem.

After all, if the result of boosting educational attainment is simply more competi­tion for a slowly increasing number of jobs that require further education, then the effect might primarily be that different people are on the winning and losing ends of inequality, not a lessening of inequality itself—at least from a global perspective. And the historical record is not encouraging. So, we should improve education, but we shouldn’t count on it as the silver bullet for addressing inequality.

There are other policies, of course, that are blunter instruments and clearly could fundamentally change the distribution of income and wealth. Taxes are the most clear cut example. If we take a sizable portion of the income of the wealthy and, one-way-or-another, distribute it to everyone else, inequality would, unequivocally, be reduced (call this the Sherwood Forest approach). But redistribution on that scale is unlikely and, at truly the scale that would be needed to reduce the levels inequal­ity to what it was even a few years ago, would probably be damaging to the overall economy. While there is ample evidence that the moderately higher levels of income tax on the well off are not the economic disaster sometimes claimed, addressing extreme economic inequality exclusively through the income tax could get us to the point at which higher taxes do cause harm. As with education, raising income taxes on the wealthy is not, alone, the answer.

“Wealth” or “capital” taxes on the assets of the better off, another favored approach, face a number of practical limitations. One problem in the United States is that a federal wealth tax would almost certainly require an amendment to the constitution. But even aside from that “technicality,” there is a limit to what one could reasonably expect to accomplish with a wealth tax.

One of the virtues of an income tax is that it taxes money going between two parties who both are typically required to inform the tax authorities of the transaction—so to outright cheat on taxes requires the complicity of at least two people. It happens, but the requirement of trust limits it. Wealth, in contrast, can be held without active engagement of another party.

Another virtue of an income tax is that if the transaction is honest then the dollar amount involved is usually clear-cut. That is less true for a tax on wealth. Assets held in publicly traded corporations or real estate in areas where there are frequent land deals are relatively easy. But the valuation of closely held corporations, let alone art and obscure intellectual property rights, can be extremely difficult—and one can count on more wealth ending up in those forms if a substantial wealth tax were put in place. A very small wealth tax would not necessarily spark this sort of tax avoid­ance. A substantial one would.

I can make similar arguments for almost the entire list I started with. Even if one believes that the minimum wage is too low, most everyone would agree that it can be too high. Even if one believes that our trade regimes are a factor in increasing inequality and that reforms are needed, overly restrictive policies would be coun­terproductive. Even if you believe that the outsized incomes from Wall Street are a consequence of power and influence—not genuine contributions to our overall prosperity—the national economy would surely be hurt if we tried to address eco­nomic inequality purely through restraints on the financial sector.

If you didn’t have ennui when you started reading this you probably do now. But the point isn’t that it’s impossible to address income inequality. The point is that it’s going to take a range of approaches. And, arguably, a range of approaches is easier to accomplish than trying to put all of one’s eggs in a single basket. If the whole solution doesn’t depend on a confiscatory tax on the wealthy, or vastly increasing educational attainment, or world-wide consensus on a socially responsible, equi­table, trade agreement—but instead on incremental change in range of areas—that is a much less daunting task.

There are agreements to be had in many of these areas. None of those individual policies will be at the scale needed to address inequality in a meaningful way, but together they can add up to make a difference.

There are reasons to do this. Extreme inequality leaves many people having harder lives than is necessary while, at the other end of the spectrum, personal wealth can reach a point where its growth does little to improve the lives of its beneficiaries—with the overall result being a net reduction in the aggregate quality of life. And there are real dangers to our society of such severe stratification. It’s an issue that is going to require a broad range of effort and cooperation around the world to address. But it’s achievable if we don’t try to accomplish it with just one or two highly contested policies. — Michael Ettlinger is the founding director of the Carsey School of Public Policy at the University of new Hampshire

What the Wealthy Know and Believe About Economic Inequality

by Fiona Chin

The wealthiest one percent among us in the United States are pulling away from everyone else, a trend documented by numerous economists and highlighted often by the media. Despite all this attention on inequality, there is a dearth of empirical research on what the wealthy know and believe to be true about this trend.

Recent research on social stratification and mobility in our country examines the beliefs of ordinary Americans about the growing wealth and income gaps, but few academics are talking directly to the wealthiest Americans about their own per­ceptions. It is notoriously difficult to interview wealthy subjects. It is hard to find them, given their scarcity in the population. Once you identify possible subjects, it is hard to gain their cooperation, particularly when discussing topics they find uncomfortable, such as income and wealth inequality.

How the very affluent view economic inequality is important because what they know and think influences how they interact with our political leaders responsible for translating these views into public policies. If policymakers respond disproportionately to the affluent and the majority of the wealthy do not favor government programs to ameliorate inequality then it is especially important for scholars and policy experts to learn what ideas and preferences the wealthy embrace. In contrast, if the majority of the very affluent favor steps to rectify the wealth and income gaps, then policymakers can consider enacting programs that are favored more by the general public.

I study wealthy Americans to find out what they believe about income and wealth inequality.1 My data come from two sources. The first is the Survey of Economically Successful Americans and the Common Good, or SESA, which was pioneered by Northwestern University political science professor Benjamin Page and Vanderbilt University political science professor Larry Bartels and funded by the Russell Sage Foundation.2 NORC at the University of Chicago conducted the survey in 2011. Respondents had an average of $14 million in household wealth (median of $7.5 million), making the sample representative of the wealthiest one-to-two percent of Chicago-area residents.

Most national surveys with representative samples capture very few respondents from the top of the wealth distribution. While it targets the Chicago metropolitan area, SESA is among the very few data sets on the wealthy and includes questions on a variety of topics, from economic mobility to taxes, retirement, philanthropic and charitable volunteering and giving, and other areas. As a survey, however, SESA was limited in the depth to which respondents could answer any particular question.

Upon reviewing the original survey sheets with interviewer notations in the margins, I found that the wealthy were eager to express more nuance than closed-ended survey responses provided. To complement the survey data with more detail, I am compiling a second source of information by conducting in-depth interviews with economically successful Americans from across the country. These interviews focus much more specifically on subjects’ beliefs about eco­nomic inequality and mobility, politics, and public policy.

As of August 2014, I have conducted 89 interviews ranging from 45 minutes to three hours in length. I spoke with top income earners and top wealth hold­ers, who I recruited based on the chain-referral method. Although my sample is not statistically representative, this methodology has allowed me to collect data on the beliefs of wealthy Americans from different geographic regions and backgrounds. Interview respondents had an average of $8.2 million in household wealth (median of $4.7 million). The interview sample was not as wealthy as the SESA sample overall, but more than half of my interviewees were within the top one percent of the income or wealth distributions. Interview subjects were from 18 different metropolitan areas across 15 states and the District of Columbia and worked in a variety of occupations and industries.

Despite the methodological differences, the interview questions that duplicated SESA questions yielded very similar patterns of answers. My research is on-going, but I have some preliminary results to share, with the important caveat that I am continuing to analyze my data and hope to conduct approximately ten more interviews.

The wealthy are aware of economic inequality and recognize that it has grown in recent decades. In the SESA data and my own in-depth interviews, the vast majority of respondents knew that income inequality is larger today than it was 20 years ago. They also tended to express a desire for a lower level of income inequality. Approximately two-thirds of respondents believed that income differences in our society are too large.

The wealthy also recognize that the distribution of wealth across society is very skewed. In fact, they tend to overestimate the proportion of wealth held by the top one percent. Based on the SESA data and my preliminary interviews, the median perception of the respondents so far was that the top one percent hold approxi­mately half of all U.S. wealth. (According to New York University economist Edward Wolff, the wealthiest one percent held a 35 percent share of the country’s household net worth, as of 2007.3) In my interviews, I also probe subjects about how large a share the wealthiest one percent “ought” to hold. Only about two-fifths of interview respondents believed that the wealthiest one percent ought to hold less.

In short, both survey and interview respondents tended to agree that income inequality is too high. But my interview data show that the wealthy did not neces­sarily believe that there should be less wealth inequality.

As much as the wealthy appear to be aware of growing economic inequality, they did not necessarily favor any kind of public intervention to remedy or ameliorate the trend. In fact, the wealthiest SESA respondents favored cutting back federal government programs such as Social Security, job programs, health care, and food stamps. Only 17 percent of SESA respondents thought that the government should “redistribute wealth by heavy taxes on the rich.”

Among my interviewees, very few were in favor of raising taxes to redress eco­nomic disparities, although a minority supported public intervention in the form of job training and other programs aimed at increasing economic opportunity. In general, many interview subjects were very pessimistic about the future of inequality trends and did not foresee any slow down in the growing bifurcation between the wealthy and the rest of society.

As a group, then, the wealthy are well informed about current events and public affairs, according to my preliminary interviews and the SESA data. They pay atten­tion to the news and are very politically active, so understanding and considering their preferences are important. My preliminary findings indicate two emerging patterns: The wealthy know that economic inequality is rising, but they do not agree that anything should or can be done to reverse the trend. My analysis is at an early stage, and much more research must be done in this arena in order to inform a productive dialogue between scholars and policymakers. –Fiona Chin is Ph.D. candidate in sociology at Northwestern University and a graduate research assistant at the Institute for Policy Research
 

All American youth need opportunities to grow our economy

Fast forward to 2030, when the last baby boomers are moving into retirement, the millennials are middle aged, and within 10 years about 50 percent of the U.S. population will be people of color.  This demographic destiny—coming our way amid rising economic inequality and inadequate investments for growth—will define our nation’s economic strength in the 21st century.  In 15 years, the needs of an aging population and the earnings power and capacity of our workforce to drive growth and support a thriving U.S. economy will simply not match up.

Unless we do something about it now.

Economic research on the overall earnings of young people entering the workforce in the teeth of the recessions indicates their future earnings power will be stunted by their poor job prospects and low starting wages. These adverse economic conditions further constrict the already limited employment prospects for 16-to-24 year olds—disproportionately individuals of color—who are neither in school nor in the workforce.

There are at least 6.7 million Opportunity Youth nationwide, or about one-sixth of the U.S. youth population. These youth do not have the skills and education they need to productively contribute in our society. Their disconnection—often precipitated or exacerbated by the failure of critical education, training, and social service systems—places an enormous and unnecessary economic burden on our nation. The direct service costs and the losses that will accrue in the form of forgone earnings and taxes over their lifetime are estimated at $4.75 trillion.

Yet this same segment of the population is expected to help generate wealth to maintain the intergenerational social contract encapsulated in Social Security, Medicare and Medicaid.  To ensure a productive workforce that can also shoulder the costs associated with an aging population, we need to invest in our talent pipeline. And because people of color will account for all of net workforce growth in the United States by 2030, our economic vitality demands that the education and workforce systems meet their needs—not just the “talented tenth,” but all American youth.

Improving life outcomes for future generations of children is a moral imperative and an economic necessity. We need to ensure opportunity youth become productive, active members of society— and in doing so, eliminate the inevitable societal loss if we continue down our current path. These youth are a vital but as yet untapped source of intellectual energy, cultural vitality, and innovation. But for their talents to achieve escape velocity, we must work with them to overcome significant barriers.

We should start by making sure our education system meets their needs. Innovative models that bridge high school and postsecondary education have demonstrated success at increasing completion rates of students from backgrounds underrepresented in higher education. Early college high schools, for example, provide opportunities for students to earn an Associate’s degree or significant college credits while still in high school. There is variation—some early college high schools are located on a college campus while others bring college faculty to high schools—but the main idea is the same: exposing students to a college environment early and providing support while setting high expectations.

These programs are based on the need for every student to continue their education after high school and a belief that students’ past failures do not define their educational potential. This design has produced dramatic outcomes for students including our opportunity youth. One in three early college students complete an Associate’s degree or other credential prior to graduating high school, whereas nationally only 10 percent of students earn any college credit in high school.  Early college high school students are also more likely to graduate from high school, enroll in college, and persist for a second year.

Despite impressive results, the availability of these types of programs remains limited. According to analysis by Jobs for the Future, there are 280 early college high schools in 32 states, with an additional 56 new schools under development. In order to ensure that our opportunity youth have a chance to participate in high-growth occupational sectors and realize their full potential, we must move beyond our current status, which is best described as “program rich but system poor.” Instead, we must retool our education systems at the local, state, and federal level to help scale successful models of early college high schools.

We have examples of young people beating the odds, but that’s not enough. To continue to drive growth in the economy, we need to change the odds so that we capture the overlooked and underutilized talent of a significant portion of those 6.7 million opportunity youth. Smart education and workforce training policies, enacted now, can change the earning power and career trajectories for millions of these youth. That’s the America we must create in order to secure our economic future in 2030 and beyond.

Melody Barnes is the former Domestic Policy Advisor to President Obama and now Vice Provost for Global Student Leadership Initiatives at New York University, Chair of the Aspen Institute Forum for Community Solutions, a member of the Year Up national board of directors, and a steering committee member of the Washington Center for Equitable Growth, a new grantmaking and research institution. 


Is Piketty’s treatment of housing an excuse to ignore him?

French economist Thomas Piketty’s treatment of housing as capital in his blockbuster “Capital in the 21st Century” is not an excuse to ignore his predictions about rising economic inequality. “Capital in the 21st Century” is clear from the beginning that housing—and real estate generally—ought to be included in the definition of “capital” for the book’s purpose, which is to examine the aggregate effect of accumulated wealth that produces an annual return through no effort on the part of its owner.

A whole set of Piketty “rebuttalsattacks that treatment of housing as capital. The critics focus on that aspect of his analysis because a large proportion of the increase in the capital-to-income ratio that he emphasizes is thanks to the accumulation of housing and real estate at market prices. In some countries, the rise in the value of housing accounts for all of the increase in the capital-to-income ratio since 1970. And even beyond housing, Piketty’s approach is not consistent with standard neo-classical economic theory in several important ways—and so the critics have looked to housing as a reason to cling to their theory in the face of his countervailing facts.

But if housing were not counted as part of capital in Piketty’s analysis then the wealth distribution patterns he explores would be even more skewed. He identifies one key historical phenomenon that is unique to the 20th century—the rise of what he calls a  “patrimonial middle class,” that is, non-trivial, inheritable wealth holdings by those between the 50th and 90th percentiles of the wealth distribution in advanced economies, rather than the top decile holding nearly all the wealth as was true in the 19th century and previously.

So, even though total capital accumulated (as a percentage of national income) has already reached the level where it was in the late 19th century, inequality has not yet attained its prior height, at least not in Europe, because that capital is partly held by the middle class. And their wealth is largely in housing.

This means that removing housing from consideration would by fiat skew the wealth distribution as much as Piketty predicts it will be skewed in the future if that patrimonial middle class dwindles, which is the dire outcome his whole book warns against. In other words, the arguments put forward as part of an attempt to discount Piketty’s prediction about the rise in capital’s share of income would, if accepted, put his prediction about the evolution of wealth inequality into effect mechanically. So how should economists interpret housing wealth?

Is housing capital?

Claim:  Housing is not “productive” capital, like machines or factories or even farmland.

Response: In fact, housing is productive in the sense that it produces a good—shelter, broadly conceived—that economic agents value. Someone who owns his or her home doesn’t have to pay rent, and the owner of an investment property will earn rent exactly as does the owner of some piece of “productive” capital equipment. Second, capital functions as a store of value, and not simply as an input to production—a function that Piketty’s historical data show has been vital over the long run.

To take the argument a bit further, the value in real estate is often a matter of proximity—of “location, location, location”—and proximity to productive economic activity or to agents whom it is valuable to know is a very real economic resource. That proximity is capitalized as real estate. An identicallysized and equipped dwelling in Manhattan, Kansas costs much less than one in the more famous Manhattan because of the productivity and amenity benefits that come from living and working near many other people in New York City.

Arguably, in a world of increasing population density, location has been getting more important, and incumbent owners of real estate have been the main beneficiaries. Klaus Desmet at the University of Charles III and Esteban Rossi-Hansberg at Princeton University have a 2014 paper called “Spatial Development” that emphasizes population densification as the cause of productivity gains, location rent dynamics, and inter-sectoral employment flows in the United States. Piketty doesn’t discuss spatial trends as such, but the dynamics of housing wealth are entirely consistent with the argument in “Capital in the 21st Century.”

Excluding housing and real estate from the capital stock is convenient if the goal is to dismiss Piketty’s data and predictions, but that interpretation is not warranted by economic theory or empirical analysis.

How should the value of housing be calculated?

 Claim: Piketty’s use the market price of housing distorts his analysis because housing should be priced according to its discounted rental stream, which is a measure of its “fundamental value.” The market price is subject to bubble dynamics, which according to the standard economic theory of bubbles would occur when the price deviates from some notion of its fundamental value, such as if a fruit tree were to cost more than the appropriately discounted sum of all the fruit it will ever produce.

Response: This critique fails for the same reason the argument that housing isn’t capital fails—because capital, broadly conceived to include wealth, is a store of value, and thus the stream of annual rent from its users isn’t the only relevant aspect of the return to its owner. The price of housing in central metropolitan areas has been on an upward march for the past several decades, in part because economic agents foresee dynamics of the kind described by economists Desmet and Rossi-Hansberg and in part because investing in real estate abroad is an effective way for the wealthy global elite to stash their cash overseas. At times, this has given rise to the property bubbles observed in Japan before 1990 and in the United States before 2006, but the resulting firesales do not erase the long-run trend. The fluctuation in housing market prices probably occurs in part because of misperceptions or misevaluations of the timing of long-run trends, but that does not imply the trend doesn’t exist.

Is housing really as substitutable with labor as Piketty assumes?

Claim:  Including housing in the stock of capital should reduce Piketty’s assumed value for the marginal rate of substitution between capital and labor, and hence his prediction of an increasing capital share of income. Piketty’s assumption that the marginal rate of substitution between capital and labor is greater than one is important since it implies that the aggregate rental rate of capital will not decline by as much as the stock of capital increases.  In other words, workers face no threat of losing their jobs just because more houses exist since there’s “no way to substitute a house for a worker.”

Response: Piketty’s main argument that the marginal rate of substitution is greater than one—that workers are indeed threatened by capital accumulation, including housing—is based on the dual U-shaped historical evolutions of the capital-to-income ratio and capital’s share of income in the very long run. That implies that when capital is accumulated, the resulting decline in the price of capital is not large enough to offset the increase in its quantity. Hence, the total share of income going to capital is higher when there’s more capital. If the marginal rate of substitution were less than one, the capital share would move inversely with the capital-to-income ratio, and if it were equal to one, as neo-classical theorists generally assume, the capital share would not change at all with the capital-to-income ratio.

All the evidence that the marginal rate of substitution between capital and labor is less than one cited by the critics is drawn from relatively short-run studies of the tradeoff between capital and labor at the firm- or industry-level, and there are very good reasons to believe that long-run elasticities are higher. Piketty’s long-run, aggregate evidence already includes the historical value of housing in capital, so this critique doesn’t bring anything more to the table—Piketty already has an excellent empirical case for assuming the marginal rate of substitution is high: the dual U shapes cited above.

Moreover, the aggregate marginal rate of substitution incorporates a much larger range of empirical economic phenomena than simply how easy it is to substitute between two factors in the production of a single good. So interpretations that adhere narrowly to that premise—such as econometric estimates at the firm or industry level—are bound to fail. The neo-classical argument holds that the price of capital is determined by its marginal productivity, and that marginal productivity declines mechanically as the quantity of capital increases. That is the so-called Ricardian scarcity principle, named for the 19th century thinker David Ricardo.

The rate at which it declines depends on how substitutable capital and labor are. The argument that they are not very substitutable implies that additional capital is relatively useless—and hence that its price will get much lower as its quantity increases. Notably, if what is relevant about housing and its value dynamics is that it acts as a store of value, then there’s no reason to believe that diminishing marginal productivity is operative. That concept relates to the additional output produced by increasing the use of one input in production while holding all others constant, but there’s no production going on if what’s being amassed is a store of value.

In this sense, housing wealth accumulation is like hording a precious metal: how useful the metal is in the production of other goods is irrelevant to the value of the horde. Finally, there are strong empirical reasons to believe that the price of housing, and of capital in general, is not only determined by marginal productivity as in the traditional, neo-classical macroeconomic model. That is the subject of my next response.

Are housing price increases due to supply restrictions?

 Claim: There’s been a great deal of research into the dynamics of the housing market since the housing bubble burst, starting in 2006, and especially the unsurprising conclusion that local housing supply elasticity is related to price dynamics, and further, that political pressure by homeowners and the mortgage lending industry, especially on the west coast of the United States, has constrained housing supply and led to the enormous price swings. Those supply restrictions have nothing to do with the rise in the capital-to-income ratio and the reasons for it proposed by Piketty.

Response: This explanation for housing price dynamics isn’t actually distinct from Piketty’s narrative. The Economist commentator Ryan Avent wrote about this eloquently: “Over the last few decades technological changes have greatly increased the return to locating in large cities filled with skilled people. Being in such places makes workers more productive and raises the income they are able to earn. But skilled cities have not allowed housing supply to expand to meet rising demand. Housing has therefore been rationed by price, pushing less productive workers toward cities where housing supply growth is higher and housing cost growth is lower.

As a result, fewer people live in the most productive places, and quite a lot of the gain from employment in productive places is captured by landowners earning rents thanks to artificial housing scarcity. This may mean lower overall productivity, more income inequality, and more income flowing to capital rather than labour.” In other words, what we have here is collective political action to make sure the price of housing remains high just as increases in the bargaining power of capital relative to labor have contributed to the decline of the labor share. There is no room in the neoclassical model for these effects—only for the Ricardian scarcity principle and diminishing marginal productivity—but that doesn’t mean they aren’t there.

The answers are clear

Piketty’s framework, including his decision to count housing as capital, does not map directly onto the standard neoclassical economic growth model—but his approach is more consistent with empirical reality in several key ways. The critics who want to cling to their outdated theories have latched onto his interpretation of housing as a way to do so, but given their theory’s many empirical shortcomings, they are seriously misguided.

Job quality matters: How our future economic competitiveness hinges on the quality of parents’ jobs

Being the parent of young children in the United States today is no easy task. Many have to juggle multiple jobs with unpredictable hours—single-parent and two-income families alike—and whether wealthy or poor, the question of childcare is ever present. Only adding to this stress is the growing evidence of the importance of the years between conception and kindergarten for a child’s development. No wonder parents, and particularly mothers given their traditional role as the primary caregiver and increasingly as breadwinner, are so concerned about how to balance work and raise their young children.

image-storypage
Read a pdf of the full document

The findings of many new studies on the importance of children’s early years for future outcomes should give pause to parents and policymakers. As this paper documents, the research shows that children’s kindergarten skill levels are correlated with their subsequent success (or failure) in the job market as adults, even accounting for the quality and quantity of elementary, secondary, and post- secondary schooling.1 An even more worrisome finding is that experiencing stress during childhood or adolescence (such as experiencing a parent working a low- quality job—or worse—losing a job) can negatively affect mental and physical health, and educational attainment and have lasting effects into adulthood.2

No wonder harried working mothers and fathers, up and down the income ladder, report conflicts between their job and meeting their children’s needs. Our work- place policies largely fail to help the majority of working parents—a substantial majority of whom lack the income to compensate for the lack of family-friendly workplace policies in our nation. In 2013, only 61 percent of private-sector workers had employer-provided paid sick days and only 12 percent had access to employer-provided paid family leave.1 Access to workplace flexibility policies is also extremely limited: in 2011, only half of workers had access to flexible hours policies and about one quarter of workers had access to flexible location policies.4

Low-income workers have even more limited access to policies to help them address conflicts between earning a living and caring for the next generation. Too many families rely on a fragile patchwork of familial and non-relative care to try to balance the demands of work and home.5  In a 2000 study of low-income working parents, the majority of parents reported that they did not expect to be able adjust their work schedules or create arrangements to better balance work and family, other than through finding another job.6

 In short, the structures of our workplaces today do not at all match the needs of working parents or their children. This crisis in the home is not just a private problem—it is one of national importance. In not meeting the needs of today’s children, we risk a lower-productivity future, which will have serious implications for our nation’s economic growth.

Economists have long argued that human capital, that is, the level of skills, education, and talents of the potential workforce, is one of the most important factors in deter- mining economic growth.7  Human capital has long been the engine powering our nation’s global competitiveness. Yet, growing evidence suggests that the United States is falling behind other countries in terms of skill acquisition. New data from the Organisation for Economic Co-Operation and Development found that across 34 developed countries, U.S. teenagers rank 17th in reading, 21st in science, and 26th in math.8

Read a pdf of the full document

In the national debate over how to improve skills of the U.S. workforce, economists and policymakers are looking to early childhood and finding compelling evidence that the early years matter far more than we previously understood. Economists traditionally measure human capital in terms of educational attainment or levels of training, but this may overstate the importance of post-secondary education.9  This is not to say that later investments are not important, but that recent research in economics points to the conclusion that, in order to improve our nation’s economic growth and competitiveness, policymakers must also focus on early childhood.10

 Early childhood is so important because this is when we acquire what economist and Nobel laureate James Heckman terms “non-cognitive” skills, also known as “soft skills,” which are both important on their own as well as provide the foundation for later skill acquisition.11 Non-cognitive skills are skills that are not specifically intellectual or analytical in nature, such as a child’s perseverance or ability  to get along with others. By and large, these soft skills are learned from primary caregivers very early in life—be they mom and dad, grandparents, childcare professionals, some combination of these role models, or sadly sometimes hardly anyone at all. This is why it is so important for our society and our policymakers tounderstand the largely under-explored issue of children’s widely differing early childhood experiences due to changes in inequality and the kinds of jobs in which their parents are engaged.

Two interrelated trends define the economic experience of families over the past 50 years. First, families have altered the way they work and care for children. Most children no longer have a full-time, stay-at-home parent, which means that where and how children spend their days are markedly different compared to a generation or two ago.12  The typical American middle-income family put in an average of 11 more hours a week at work in 2007, just before the start of the Great Recession, than it did in 1979 and, in 2010, fewer than one third of children lived in a family with a full-time stay-at-home parent.13 Abundant economics research has explored the effects of greater maternal employment and the quality of childcare on children’s outcomes, but we know much less about how the quality—and flexibility—of parents’ jobs interacts with these processes. What we do know from the research points to the conclusion that parental job quality, including the ability to have some control over when work happens, is a very important issue.

Second, the United States has seen a sustained rise in economic inequality, widening the gap between low-and high-incomes to unprecedented levels.14 As has been well documented, inequality in the United States has taken the form of the top pulling apart from the rest of the income distribution, with little income gains for the bottom 90 percent of families.15  This means that while some children have access to immense resources, others lack access to the resources they need to be fully productive members of our society and economy. Just as importantly, high inequality is associated with greater divergence in access to high-quality jobs— those that pay good wages, offer stable and predictable schedules, and provide benefits that allow workers to address conflicts between work and family.16 This means that low-income children are experiencing the double-whammy of less income just as their parents cope with less control over their time to provide care.

This report examines what is known about the importance of early childhood for the development of human capital, then turns to what we know about the effects of family income, employment patterns, and job quality on children’s development. We find that job quality, especially control over schedules and access to benefits that allow workers to address conflict between work and family, is an under-examined issue in the economics literature. However the research that does exist shows that this is an important issue to include in our policy agenda to improve children’s outcomes.

Briefly, here is what we discovered:


  • The time parents spend with their child affects the child’s cognitive and non-cognitive development, with strong effects during a child’s earliest years.


  • Mothers’ movement into the workplace and the rise in income inequality means there is a growing divergence across families in terms of resources that parents can devote to their children.


  • Money matters. Parents’, and particularly single mothers’, access to well-paying work has real impacts on child outcomes through a variety of mechanisms. Perhaps most significantly, access to quality childcare is highly dependent on income.


  • The level of stress among parents due to juggling work and family responsibilities has a direct effect their child’s development.


  • Most working parents have limited or no access to work-family policies such as workplace flexibility, paid leave, and paid sick days and those who do are more likely to be from higher income families. These policies help parents address conflicts between work and home, with real implications for parenting and children’s outcomes.


Read a pdf of the full document

All of these factors have a direct impact not only on the future human capital available in our country, but also, by extension, the productivity of our economy in the decades ahead.A key conclusion of this paper is that we need to better understand the links between developing our children’s human capital and the quality of their parents’ jobs, including wages, the ability to have some control or flexibility on hours or scheduling, and the stress that they experience and bring home from work. One thing is very clear: our future economic competitiveness depends on getting this right.


1      Almond, Douglas, and Janet Currie. Human Capital Devel- opment Before Age Five. NBER Working Paper. Cambridge, MA: National Bureau of Economic Research, 2010. http:// www.nber.org/papers/w15827.pdf.

2      National Scientific Council on the Developing Child. Excessive Stress Disrupts the Architecture of the Developing Brain. Working Paper. Cambridge, MA: Harvard University, Center on the Developing Child, June 2009; Strazdins, Lyndall, Megan Shipley, Mark Clements, Léan V. Obrien, and Dorothy H. Broom. “Job Quality and Inequality: Parents’ Jobs and Children’s Emotional and Behavioural Difficulties.” Social Science & Medicine 70, no. 12 (2010): 2052–60. doi:10.1016/j.socscimed.2010.02.041; Kalil, Ariel,and Ziol-Guest, Kathleen M. “Single Mothers’ Employment Dynamics and Adolescent Well-Being.” Child Development 76, no. 1 (2005): 196–211.

3      U.S. Bureau of Labor Statistics. “Table 32. Leave Benefits: Access, Private Industry Workers, National Compensation Survey, March 2013.” U.S. Department of Labor, 2013. http://www.bls.gov/ncs/ebs/benefits/2013/ownership/ private/table21a.pdf.

4      Glynn, Sarah Jane. Working Parents’ Lack of Access to Paid Leave and Workplace Flexibility. Washington, DC: Center for American Progress, November 2012. http://cdn. americanprogress.org/wp-content/uploads/2012/11/ GlynnWorkingParents-1.pdf.

5      Williams, Joan C., and Heather Boushey. The Three Faces of Work-Family Conflict: The Poor, the Privileged, and the Miss- ing Middle. Washington, DC: Center for American Progress and the Center for WorkLife Law, University of California, Hastings College of the Law, 2010.

6      Dodson, Lisa, Tiffany Manuel, and Ellen Bravo. Keeping Jobs and Raising Families in Low-Income America: It Just Doesn’t Work. Radcliffe Institute for Advanced Study, 2002.

7      DeLong, J. Bradford, Claudia Goldin, and Lawrence Katz. “Sustaining U.S. Economic Growth.” In Agenda for the Nation, edited by Henry J. Aaron, James M. Lindsay, and Pietro S. Nivola. Washington, DC: The Brookings Institution, 2003; Mankiw, N. Gregory, David Romer, and David N. Weil. “A Contribution to the Empirics of Economic Growth.”The Quarterly Journal of Economics 107, no. 2 (1992): 407–37; Barro, Robert, and Jong-Wha Lee. “Educational Attainment in the World, 1950-2010.” Vox, 2010. http://www.voxeu.org/index.php?q=node/5058.

8      Organization for Economic Co-Operation and Development. PISA 2012 Results: What Students Know and Can Do: Student Performance in Mathematics, Reading and Science (Volume I). Revised edition. OECD Publishing, 2014. http://www.oecd.org/pisa/keyfindings/pisa-2012-results- volume-i.htm.

9      Heckman, James J., and Lakshmi K. Raut. Intergenerational Long Term Effects of Preschool – Structural Estimates from a Discrete Dynamic Programming Model. NBER Working Paper. National Bureau of Economic Research, May 2013. http://www.nber.org/papers/w19077.

10   On the importance of later interventions, see, for example: Heller, Sara, Harold A. Pollack, Roseanna Ander, and Jens Ludwig. Preventing Youth Violence and Dropout: A Randomized Field Experiment. Working Paper. National Bureau of Economic Research, May 2013. http://www.nber.org/papers/w19014.

11   Heckman, James J. Schools, Skills, and Synapses. Working Paper. National Bureau of Economic Research, June 2008. http://www.nber.org/papers/w14064.

12   Boushey, Heather. “The New Breadwinners.” In The Shriver Report: A Woman’s Nation Changes Everything, edited by Heather Boushey and Ann O’Leary. Washington, DC: Center for American Progress, 2009.

13   Mishel, Lawrence, Josh Bivens, Elise Gould, and Heidi Shierholz. “Table 2.18 – Annual Hours Worked by Married Men and Women Age 25-54 with Children, by Income Group, Select Years, 1979-2010.” In The State of Working America, 12th ed. Ithaca, NY: Cornell University Press, 2012; Glynn, Sarah Jane. The New Breadwinners: 2010 Update. Washington, DC: Center for American Progress, 2012.

14   Piketty, Thomas, and Emmanuel Saez. “Income Inequality in the United States, 1913–1998.” The Quarterly Journal of Economics 118, no. 1 (February 2003): 1–39.

15   See: Saez, Emmanuel. Striking It Richer: The Evolution of Top Incomes in the United States (Updated with 2012 Preliminary Estimates). Berkeley, CA: University of California – Berkeley, September 2013. http://elsa.berkeley. edu/~saez/saez-UStopincomes-2012.pdf; Mishel, Lawrence, Josh Bivens, Elise Gould, and Heidi Shierholz. “Figure 4H – Cumulative Change in Real Annual Wages, by Wage Group, 1979-2010.” In State of Working Amer- ica, 12th Edition. Ithaca, NY: Cornell University Press, 2012. http://www.stateofworkingamerica.org/chart/ swa-wages-figure-4h-change-real-annual-wages/.

16  Schmitt, John, and Janelle Jones. Bad Jobs on the Rise. Washington, DC: Center for Economic and Policy Research, September 2012. http://www.cepr.net/docu-ments/publications/bad-jobs-2012-09.pdf; Schmitt, John, and Janelle Jones. Making Jobs Good. Washington, DC: Center for Economic and Policy Research, April2013.  http://www.cepr.net/documents/publications/good-jobs-policy-2013-04.pdf; Williams, Joan C., and Heather Boushey. The Three Faces of Work-Family Conflict: The Poor, the Privileged, and the Missing Middle.

Marriage promotion isn’t the only solution to America’s mobility problem

We at the Washington Center for Equitable Growth and much of the economics blogosphere have given substantial attention to the recent work on mobility in the United States by Harvard economists Raj Chetty and Nathanial Hendren and University of California—Berkeley economists Emmanuel Saez and Patrick Kline. One of the study’s key findings is that there is strong, statistically significant relationship between the share of single mothers in an area and the gap in mobility between children from high- and low-income families (Chetty and his co-authors refer to this as a measure of relative mobility).

Brad Wilcox, University of Virginia sociologist and Director of the National Marriage Project, employs this finding to promote pro-marriage policies. His research on the issue is intriguing (though he bases his recommendations on regressions that suffer from multicollinearity, because all of the independent variables are highly correlated with each other, and thus his analysis is statistically questionable). His analysis may leave policymakers with the wrong message. When policymakers focus on marriage as the most important path to higher economic mobility, it allows them to ignore the pro-family policies that can help improve mobility. After looking at the data more deeply, I think they are drawing the wrong conclusions and should look at ways to support families of all types instead of pushing a specific family model.

My issue brief, “A Regional Look at Single Moms and Mobility,” indicates that the Pacific states of California, Hawaii, Oregon, and Washington stand out for having relatively high rates of single mothers while also having relatively high mobility. (See map) These states tend to have more family-friendly laws like paid sick days so that parents can take care of sick children and they have relatively generous parental leave so that new parents can spend more time with their newborn children. This analysis is far from definitive, but it does imply that these kinds of pro-family policies can improve mobility in the absence of a high rate of two-parent households.

States with Family Friendly Policies have Better Economic Mobility

A regional look at single moms and upward mobility

One of the big takeaways from the recent work by Harvard economists Raj Chetty and Nathanial Hendren and University of California—Berkeley economists Emmanuel Saez and Patrick Kline is that differences in family structure are strongly associated with differences in economic mobility.[1] Some scholars and policymakers have used these findings as an opportunity to encourage marriage promotion policies, but a deeper look at the data raises some important questions.[2]

For example, why is it that the West Coast states of California, Oregon, and Washington stand out for having relatively high rates of single mothers while also having relatively high rates of economic mobility? Conversely, why are other parts of America characterized by low rates of single mothers but very low rates of economic mobility?

Understanding economic mobility can yield insights into whether and how economic inequality and economic growth are linked. And scholars and policymakers across academic disciplines and political divides agree that understanding how single mothers fare in our economy is critical to future economic growth, powered by their contributions today and the future contributions of their children.

Read a PDF of the full document
Read a PDF of the appendix

This issue brief explores where single mothers are more likely to be moving up the economic ladder, relying upon the latest research on mobility in the United States by Chetty and his colleagues.[3] One of their study’s key findings is that there is a strong, statistically significant relationship between a higher gap in mobility between children from high- and low-income families, which Chetty and his co-authors refer to as relative mobility, and a higher share of families headed by single mothers.

This insight enables us to look at this “mobility gap” in an area, compare the share of single-mother households, and then look at the difference between the share of single mothers and the mobility gap.[4] This difference tells us whether the mobility gap is higher, lower, or about what would be expected given the share of single mothers in an area. In the pages that follow, this issue brief will present these data analyses in more detail. But the upshot of this analysis is that states with more family friendly laws, [5] such as paid sick days so that parents can take care of sick children and relatively generous parental leave policies so that new parents can spend more time with their newborn children, are more likely to have a relatively high rates of economic mobility despite high rates of single mothers—among them California, Oregon, and Washington.

Conversely, parts of America, particularly parts of the Rust Belt, are significantly less mobile than one would expect given the relatively low share of households headed by single mothers. This analysis is far from definitive, but it does suggest that pro-family policies can improve mobility in the absence of a high rate of two-parent households.

Our first map in this issue brief tells the tale, at least for those born in the United States when the tail end of Generation X—1965-1980—gave way to the Millennials born between 1981 and 2000. (See Figure 1.)

Figure 1

States with Family Friendly Policies have Better Economic Mobility

Parsing the data on mobility and single mothers

These differences in the mobility of single moms that we mapped on Figure 1 can be further refined down to metropolitan regions of the country. Figure 2 below shows the relationship between the share of households led by single mothers and the gap in mobility between the children of high- and low-income families. Each dot represents a commuting zone (areas within which people are more likely to live and work). The arrow represents the “best-fit-line” on these points and indicates that places with a higher share of single mothers also tend to have a higher gap in mobility—indicating lower relative mobility. Because of the strength of this relationship, many commentators have identified marriage promotion as the silver bullet policy to improve economic mobility.

Figure 2

Single Mothers Struggle with Upward Mobility

While Figure 2 provides a pretty convincing picture that a higher rate of single motherhood is associated with a higher gap in mobility between children from high- and low-income families, there may be something missing. High- and low-income children born in large West Coast cities such as Seattle and San Diego have a much smaller gap in mobility than high- and low-income children born in cities such as Cincinnati or Indianapolis, despite having a similar share of single mothers. So before making sweeping policy proclamations, we should dig a little deeper to understand this relationship.

Figure 3 is a map of the mobility gap between the children of high- and low-income families. The mobility gap is the difference in incomes as adults between people born into the lowest-earning and highest-earning households. A lower ‘mobility gap’ implies greater mobility, and vice versa.[6] The lightly colored areas in the map are those that have a low mobility gap, while the dark green areas have a much higher mobility gap. The South and much of the Rust Belt have particularly low economic mobility, while the West Coast and many parts of the Great Plains states are particularly economically mobile.

Figure 3

How Hard is it to Climb the Ladder?

The mobility gap is an obviously useful measure of the chances of the children of families achieving the American Dream, but to complete our analysis presented in Figure 1, we need to calculate the share of single mothers in our nation. Figure 4 does that, with lightly colored places indicating an area in which a higher share of households are headed by single mothers than average for the country, while dark green indicates a lower share. The South and much of the West have higher shares of single mothers that the rest of the country, while the Great Plains states in particular have the lowest share of households led by single mothers.

Figure 4

Concentrations of Single Mothers

This brings us back to the first map in this issue brief. It looks at the difference between the actual mobility gap and what one would expect the mobility gap to be based only on knowing the share of single mothers. The brown indicates those places where you would expect mobility to be better given the relatively low share of households led by single mothers, while the green indicates those places where the mobility is better than you would expect given the high share of single mothers. The geographic distribution of the colors is telling. Table 1 details the states with the more long-standing family friendly policies.

Table 1

States with Longstanding Family-Friendly Policies

The West Coast states of California, Oregon, and Washington stand out for having relatively high rates of single mothers while also having relatively high mobility. Several New England states, among them Rhode Island, Maine, and Vermont, also have higher levels of mobility than would be expected given the share of households headed by single mothers. As seen in Table 1, these states tend to historically have had more family-friendly laws,[7] such as parental leave so that new parents can spend more time with their newborn children. This analysis is far from definitive, but it does imply that these kinds of pro-family policies can improve mobility in the absence of a high rate of two-parent households.

To look a little deeper into the relationship between mobility and marriage, we also did an international comparison akin to the famous Great Gatsby Curve.[8] Figure 5 has the intergenerational earnings elasticity (a measure of the variability in earnings for one generation that is associated with the variability in earnings from the previous generation.) from University of Ottawa economist Miles Corak[9] plotted against the share of children that live primarily with one parent using data from the OECD.[10]

At the international level, we find the opposite relationship between single parenthood and mobility that we see from data in the United States, as seen in Figure 2. While it appears that higher shares of children primarily living in single-parent households is weakly associated with lower intergenerational earnings elasticity, the United States is an outlier, and by excluding it from the calculations, the cross-country association is quite strong. This is almost certainly not an indication that single-parent households are better for mobility, but instead an indication that what matter are other differences between countries, such as public policy. Those countries that have a larger share of single mothers, other than the United States, also tend to do a much better job providing support services to families of all types.[11] (See Figure 5.)

Figure 5

The United States Compares Poorly in Economic Mobility

By comparing the maps of mobility with family structure and also seeing the international relationship, we see that those places with stronger support for families of all types appear to be less impacted by any adverse effect on mobility from having a high share of single mothers. This suggests that low mobility stemming from a high proportion of single-parent households may be largely a function of policy choices rather than an inherent characteristic associated with the prevalence of different family structures.

Conclusion

While none of this analysis constitutes definitive economic analysis, it does highlight areas for researchers to focus their efforts and also for policymakers to consider. Marriage promotion may be one possible policy solution to the low mobility in the United States, though evidence would be needed to show what it is about marriage that leads to higher economic mobility. But we may want to try what already appears to be working in some states and in other developed nations too.

The notion that low mobility is driven by family structure alone allows policymakers to ignore their role in the problem and implies solutions that ignore more fundamental economic and work-related problems. Thus, it is important for researchers to do more than just a cursory analysis of these data and to understand the mechanisms of mobility before making strong policy recommendations.

Endnotes

[1] Raj Chetty et al., Where Is the Land of Opportunity? The Geography of Intergenerational Mobility in the United States, Working Paper (Cambridge, MA: National Bureau of Economic Research, January 2014), http://www.nber.org/papers/w19843.

[2] W. Bradford Wilcox, If You Really Care About Ending Poverty, Stop Talking About Inequality, The Atlantic, January 8th, 2014,  http://www.theatlantic.com/business/archive/2014/01/if-you-really-care-about-ending-poverty-stop-talking-about-inequality/282906/

[3] Chetty et al, 2014.

[4] We used the residual from a regression of single mothers on the relative mobility as the difference.

[5] Waldfogel, Jane. 1999. “Family Leave Coverage in the 1990s.” Monthly Labor Review 10 (October): 13–21.

[6] Raj Chetty et al., Where Is the Land of Opportunity? The Geography of Intergenerational Mobility in the United States, Working Paper (Cambridge, MA: National Bureau of Economic Research, January 2014), pp.2-3, http://www.nber.org/papers/w19843.

[7] National Conference of State Legislatures, State family and Medical Leave Laws, December, 31st, 2013, http://www.ncsl.org/research/labor-and-employment/state-family-and-medical-leave-laws.aspx

[8] Alan Krueger, “The Rise and Consequences of Inequality” (Center for American Progress, January 12, 2012). http://www.whitehouse.gov/sites/default/files/krueger_cap_speech_final_remarks.pdf.

[9] Miles Corak, Inequality from Generation to Generation: The United States in Comparison, 2012, http://milescorak.files.wordpress.com/2012/01/inequality-from-generation-to-generation-the-united-states-in-comparison-v3.pdf.

[10] OECD, Living arrangements of children, OECD Family Database, January 7, 2010, http://www.oecd.org/social/family/41919559.pdf.

[11] Wikiprogress, Hours Worked, http://www.wikiprogress.org/index.php/Hours_Worked

Extended unemployment insurance remains critical

Unemployment Insurance is designed to help workers who are displaced, through no fault of their own, until they can find new jobs. It is natural to extend these benefits when the labor market is weak and job searches take longer to result in a new job. But benefits should not be so generous that the recipients delay taking new jobs.

Balancing these two policy prescriptions is difficult politically. Yet new analyses of recent data covering unemployed workers during the Great Recession and its aftermath indicate that the impact of unprecedented extensions of Unemployment Insurance on job uptake were smaller than previously thought while the benefits were extremely important to maintaining family incomes. The program helped sustain families and communities during an unusually long period of weak labor demand, helping to promote long-term labor market resiliency and higher future prosperity by helping the long-term unemployed remain out of poverty and attached to the labor market.

Extended Unemployment Insurance benefits expired at the end of 2013, and Congress is now considering whether and how to reinstate them. The new data and analysis detailed in this issue brief—based on the roll-out of extended benefits in 2008-2010 and the roll-back that began in late 2011—indicate that old views of the design of Unemployment Insurance need some updating. Specifically, the downsides of UI extensions are smaller than in past economic downturns, and there are some previously unanticipated upsides. Congress should take these findings seriously as it considers a possible reauthorization of the Emergency Unemployment Compensation program this year.

Read a PDF of the full document


Current labor market conditions

Unemployment insurance extensions are only authorized in weak labor markets, and understanding their effects requires understanding the context in which they operate. Although the Great Recession officially ended in 2009, a full five years later the labor market is still quite weak. The unemployment rate has fallen, from a peak of 10.0 percent in October 2009 to 6.7 percent in March 2014. But the share of the adult population that is employed is only 58.9 percent, down a full 4.0 percentage points from before the Great Recession and lower than at any point between 1984—when female labor force participation was much lower than today—and 2009.  And the long-term unemployment rate, the share of the labor force that has been out of work for six months or longer, remains extremely high.

This crisis has been devastating for working people. More than 30 million “person-years” of employment were lost.[1]  This represents potential earnings that vanished without a trace, cutting deeply into family budgets. And the overhang from the extended period of extreme labor market weakness will extend the pain much further, in at least three distinct ways.  First, the weak labor market held down wages even for those workers who kept their jobs—the median full-time worker has not had a real wage increase in a decade. Second, workers who lost their jobs will probably see long-run declines in their earnings, as high as 20 percent per year for as long as 20 years.[2] Third, the cohorts of young people who have entered the labor market since the crisis began have had trouble getting their feet on the bottom rungs of the career ladder. This, too, will have long-lasting effects, depressing wages for much of their lives.[3]

The most important component of the policy response to a shock of this magnitude must be to ensure that the economy recovers quickly so that the damage does not continue. On this score, policymakers in Washington have done exceptionally poorly.

A second important component is to cushion people from the ill effects of the crisis while it lasts. Unemployment Insurance is a very important part of this cushion. Ideally, it should help fill in the hole in household budgets that is created when a worker is laid off, allowing the family to maintain its consumption during the job search.

The design of unemployment insurance policy trades off two objectives: We want to insure workers against job losses, but we don’t want to create incentives for workers who have lost their jobs to delay finding new work. The former pushes us toward more generous benefits—higher replacement rates and longer durations—while the latter consideration pushes in the opposite direction.

There has always been good reason to think that the insurance function of Unemployment Insurance is more important in weak labor markets. When there are few jobs to be had, it takes displaced workers a long time to find new jobs and job seekers thus need more support. At the same time, incentive problems are less severe in weak labor markets—jobless workers will be loathe to turn down an available job in the hope of something better, and even if these incentives do dissuade a worker from taking a job, there will be a long line of other workers ready to fill the open position, with little net impact.

This argument provides a rationale for a policy of making Unemployment Insurance more generous in downturns. And indeed this is what we saw early in the Great Recession:  Where traditional UI benefits have averaged about $300 per week for no more than 26 weeks during the early years of the crisis, Congress both raised benefit levels, by $25 per week as part of the 2009 Recovery Act, and dramatically extended their duration, to as many as 99 weeks through much of 2010 and 2011.

Although this expansion was entirely consistent with the best understanding of optimal policy, it was quite controversial. Opponents argued that it would dissuade displaced workers from taking new jobs, and some have even attributed nearly the entire rise in unemployment during 2007-2009 to the disincentive effects created by extended Unemployment Insurance. [4] But these arguments are not well founded in the evidence. New data indicate that the recent extensions reduced job-finding rates [or job search efforts] only minimally.

Examining the most recent data

The roll-out of extended Unemployment Insurance benefits in 2008-2010 and the roll-back that began in late 2011—UI durations are now only about a quarter of their 2009-10 maximum—created a natural experiment allowing researchers to study the effects of extended UI benefits in weak labor markets. These studies indicate that old views of the design of Unemployment Insurance need some updating. Specifically, the downsides of UI extensions are smaller than in the past, and there are some previously unanticipated upsides.

The evidence indicates that extended Unemployment Insurance does reduce the likelihood that an unemployed worker will find a job in any given month, but by much less than we previously thought.  Moreover, extended UI benefits have an important countervailing effect:  Many unemployed workers who would have given up their job searches and exited the labor force are persuaded to remain in the job market because benefits are available only to those actively searching for work.  This effect is at least as large as the effect on job finding.[5]

The effect of Unemployment Insurance extensions on labor force participation may turn out to be very important in the long run.  An important concern as the weak labor market drags on is that workers who have been out of work for years or more may become detached from the labor market and unable to return to work. Any such effect would cast a long shadow over our future prosperity.[6] Although evidence is limited, the data appear to indicate that UI extensions help to reduce worker disconnection from the labor market, [7] and thus play an important role in returning our economy to eventual health.

Despite the accumulation of evidence that UI benefits are doing little to dissuade displaced workers from finding jobs, and may even be having a positive net effect on the labor market, the UI extensions put in place in 2008-2010 have been allowed to expire. Benefit durations have fallen to only 26 weeks in most states, just over a quarter of their peak level, and in some states they are much lower. North Carolina, for example, has cut durations to as short as 12 weeks, and has reduced benefit levels as well. As a consequence of these cuts, hundreds of thousands of workers have been thrown off Unemployment Insurance who might otherwise have received it.

Not surprisingly, this has done nothing to improve the labor market, which is limping along just as slowly now as it was in 2012 and 2013, before the UI extensions expired. There remains no sign that employers are having trouble filling most jobs, as would be expected if UI benefits were discouraging recipients from taking work. The evidence still points overwhelmingly to labor demand shortfalls as the primary problem.

The cutback in UI benefits has, however, imposed great hardships on families and their communities. In recent work with Rob Valletta of the Federal Reserve Bank of San Francisco, I examined the trajectory of family incomes from initial employment, through job losses to spells of UI receipt, and then through UI exhaustion at the end of the spell.[8]  We found what one would expect: Earnings fall dramatically when a worker loses his or her job, and UI benefits make up only about half of that loss on average.

052614-UI-webgraphic

When these benefits expire, family income takes another dramatic fall.  Some families turn to the Supplemental Nutrition Assistance Program (formerly called food stamps) or other government assistance programs, while others turn to early retirement and Social Security payments for support. But most families are able to do neither, and thus must live with sharply reduced incomes. The average recent UI exhaustee’s family has only 70 percent of its pre-displacement income. Many families, particularly those that previously had a single earner, have much less than this. These families are likely to have exhausted their savings long before, and thus face real hardship. Well over one-third of exhaustee families fall below the poverty line.

This is devastating to families. It also hurts their communities: Families without income to spend cannot support local merchants or service providers or make rent or mortgage payments, so the expiration of UI sends ripples throughout the local economy. Needless to say, few local economies can afford this right now, and the drag created by the expiration and exhaustion of Unemployment Insurance threatens to bring an already slow recovery to a dead stop.

Extended UI benefits cannot be the whole of our policy response to the ongoing weakness of the labor market. Many workers displaced in the downturn have outlasted even the maximum benefit extensions, and will need other forms of support to allow them to survive. And UI extensions alone will not provide enough of a fiscal boost to support a robust recovery. But the fact that this one tool will not finish the job cannot justify not starting. And the evidence that has accumulated during the Great Recession and the subsequent tepid recovery demonstrates that Unemployment Insurance is a useful and important tool, and that the recovery would have been even weaker and slower without it.

Jesse Rothstein is associate professor of public policy and economics at the University of California, Berkeley. He joined the Berkeley faculty in 2009. He spent the 2009-10 academic year in public service, first as Senior Economist at the U.S. Council of Economic Advisers and then as Chief Economist at the U.S. Department of Labor. Earlier, he was assistant professor of economics and public affairs at Princeton University. He received his Ph.D. in economics from UC Berkeley in 2003. 

Endnotes

[1] A person-year represents one person employed for one year. I calculate this as the increase in the number of person-years of unemployment from what would have obtained had the unemployment rate remained at its November 2007 level of 4.7%. This assumes that the weakness of the labor market was not responsible for the sharp decline in the labor force participation rate, so is a substantial underestimate.

[2] See Jacobson, Louis S., Robert J. LaLonde, and Daniel G. Sullivan. “Earnings losses of displaced workers.” The American Economic Review (1993): 685-709; von Wachter, Till M., Jae Song, and Joyce Manchester. “Long-Term Earnings Losses due to Job Separation During the 1982 Recession: An Analysis Using Longitudinal Administrative Data from 1974 to 2004.” Working paper (2009).

[3] See Oreopoulos, Philip, Till von Wachter, and Andrew Heisz. “The short-and long-term career effects of graduating in a recession.” American Economic Journal: Applied Economics 4.1 (2012): 1-29; Oyer, Paul. “The making of an investment banker: Stock market shocks, career choice, and lifetime income.” The Journal of Finance 63.6 (2008): 2601-2628; Kahn, Lisa B. “The long-term labor market consequences of graduating from college in a bad economy.” Labour Economics 17.2 (2010): 303-316.

[4] Barro, Robert.  “The Folly of Subsidizing Unemployment,” Wall Street Journal, August 30, 2010. http://online.wsj.com/news/articles/SB10001424052748703959704575454431457720188. See also, Hagedorn, Marcus, Fatih Karahan, Iourii Manovskii, and Kurt Mitman, “Unemployment Benefits and Unemployment in the Great Recession: The Role of Macro Effects.” National Bureau of Economic Research working paper 19499, 2013.

[5] Rothstein, Jesse. “Unemployment insurance and job search in the Great Recession.” Brookings Papers on Economic Activity Fall (2011): 143-213; and Farber, Henry S., and Robert G. Valletta. Do extended unemployment benefits lengthen unemployment spells? Evidence from recent cycles in the US labor market. Working paper no. W19048, National Bureau of Economic Research (2013).

[6] See DeLong, J. Bradford, and Lawrence H. Summers. “Fiscal Policy in a Depressed Economy.” Brookings Papers on Economic Activity (2012): 233-297.

[7] Rothstein (2011); Farber and Valletta (2013).

[8] Rothstein, Jesse, and Robert G. Valletta. Scraping by: Income and program participation after the loss of extended unemployment benefits. Federal Reserve Bank of San Francisco working paper no. 2014-6 (2014).