Must-Read: Matt Levine: Hedge Fund Results

Must-Read: Matt Levine: Hedge Fund Results:

Since the end of 2011, hedge funds as a whole have (1) produced negative alpha and (2) added almost $900 billion of assets…

Why? This seems to be the best explanation:

There are various reasons why investors are still by and large faithful to Hedge Funds, even if they are disappointed by their recent performance. One of the most important reasons is that it is difficult to find an alternative with similar risk / return characteristics. And when the risk-adjusted returns are combined with the low correlation they tend to have, the impact on investors’ portfolios tend to be positive. Indeed, according to our analysis in Figure 13, a majority (55%) of HFs, even in a year like 2015 where HFs did not perform particularly well, would have been additive and improved the efficient frontier of the 60 / 40 portfolio. Thus while performance may have seemed poor on a stand-alone basis, there appears to be a role for HFs in investors’ portfolios.

Improving the efficient frontier of the 60/40 portfolio is a rather lower bar than providing alpha, but there you go. A lot of sophisticated investors pay hedge funds’ fees because they think — often correctly! — that those hedge funds, as part of a balanced diet, improve the overall performance, and reduce the overall risk, of their investments. It is not a magic-masters-of-the-universe-doubling-your-money-every-year sort of explanation, but it seems to get the job done.

Must-Reads: August 27, 2016


Should Reads:

Must-Read: Pierre-Olivier Gourinchas et al.: The Greek Crisis: An Autopsy

Must-Read: Pierre-Olivier Gourinchas et al.: The Greek Crisis: An Autopsy:

The Greek crisis is one of the worst in history, even in the context of recorded ‘trifecta’ crises – the combination of a sudden stop with output collapse, a sovereign debt crisis, and a lending boom/bust…

This column quantifies the role of each of these factors…. While fiscal consolidation was important in driving the drop in output, it accounted for only for half of that drop. Much of the remainder can be explained by the higher funding costs of the government and private sectors due to the sudden stop. For its sheer intensity and duration, the Greek crisis has been quite unprecedented. One measure says it all – real income per capita declined every single year between 2007 and 2013, a cumulated drop of 26%. Since then, it has barely risen….

Incorporating debt, default, and price stickiness yields rich interactions between the creditworthiness of the government and that of banks, firms, and households…. We decompose the movements in output, investment, and other key macroeconomic variables into the contribution of each type of shock. This helps us determine which shocks were the most important in driving the crisis dynamics. Second, we perform a number of ‘counterfactual exercises’ to identify the role played by different aspects of the institutional environment…

Must-Read: Olivier Coibion et al.: Monetary Policy and Inequality in the United States

Must-Read: Olivier Coibion et al.: Monetary Policy and Inequality in the United States:

We study the effects of monetary policy shocks on—and their historical contribution to—consumption and income inequality in the United States since 1980…

Contractionary monetary policy systematically increases inequality in labor earnings, total income, consumption and total expenditures… account for a non-trivial component of the historical cyclical variation in income and consumption inequality…. a contractionary monetary policy shock is characterized by a widening of the earnings distribution above the median but a tightening of the earnings distribution below the median, leading to only small effects (if any) on inequality as measured by the difference between the 90th and the 10th percentile. In contrast, we find more heterogeneity in total income responses. Incomes of those at the 90th percentile rise persistently relative to the median household while those at the 10th percentile see their income decline relative to the median, especially at longer horizons…. In the 1990s, labor income accounted for nearly 80% of total income for the highest quintile, but less than 40% for the bottom quintile.

Must-Read: Marc Andreessen: Software Programs the World

Must-Read: Marc Andreessen: Software Programs the World:

We frequently have delegations from all over the US and the world who come in and ask: “What can we do to have our own Silicon Valley?”…

…So we go through it–you want rule of law, ease of migration, ease of trade, R&D investments, no non-competes, fluid labor laws, ability to start and fold companies quickly…and at some point, the visitors get this stricken look on their face..and at the end of it, they’re like “What if we want Silicon Valley, but can’t do any of those things?”

So I’d argue the formula is well known, it’s just that people don’t want to apply it, for all kinds of reasons…. The good news is that it can be done, and then the other good news is that it is happening everywhere: South America, India, China, Middle East, Africa, Korea etc….

Weekend reading: “Down the Jackson Hole” edition

This is a weekly post we publish on Fridays with links to articles that touch on economic inequality and growth. The first section is a round-up of what Equitable Growth published this week and the second is the work we’re highlighting from elsewhere. We won’t be the first to share these articles, but we hope by taking a look back at the whole week, we can put them in context.

Equitable Growth round-up

Over the past half-century, American women have joined the formal economy in massive numbers. This led to a lot of economic growth that we otherwise wouldn’t have experienced, but because of an outdated labor standards infrastructure it’s meant families are struggling to keep up with responsibilities outside of work.

The gender wage gap remains significant, especially among minority communities. On average, men make roughly 27 percent more than African American women. Minimum wage increases, unionization, child care, and workplace flexibility policies could go a long way in ameliorating this problem.

Low interest rate environments are causing problems for pension fund managers and retirees, as meeting retirement goals requires more savings up front. “Thankfully, there is one retirement program in the country that would actually be easier to finance during an era of low-interest rates: Social Security

We’ve known from recent economics literature that marginal propensities to consume, or how much of an additional dollar of income people are willing to spend, differs dramatically among classes of individuals. But how do MPCs change over time and throughout the business cycle?

Links from around the web

The Federal Reserve’s annual conference in Jackson Hole, Wyoming is underway and an unlikely participant is attending this year. Policymakers met with Fed Up, an activist group, to discuss lackluster wage growth and tight monetary policy’s disproportionate effect on marginalized segments of the labor force. [The New York Times]

Despite concerns such as these and despite the Fed undershooting its 2 percent inflation target 77 of 81 months since the recession ended, Chairwoman Janet Yellen “believe[s] the case for an increase in the federal funds rate has strengthened in recent months.” [Board of Governors of the Federal Reserve System]

Second quarter GDP growth was revised downward to an annualized 1.1 percent. [Bureau of Economic Analysis]

Income and wealth inequality are as bad now as they have been in nearly a hundred years, and gauging from the past there’s no indication that it couldn’t get worse. A new book by Kenneth Scheve of Stanford and David Stasavage of New York University examines the history of progressive taxation and how states have responded to rising inequality, and conclude that taxes on the rich generally do not increase as a response to inequality itself. [The Upshot]

Economics as a discipline rarely advances through periods of actual economic turmoil by locking itself away and dispassionately coming to agreement on the right set of equations and models, argues Ryan Avent. Invariably, politics matters and is just as important to the advancement of the discipline. [The Economist]

Friday figure

The gender wage gap is more severe among minority women.


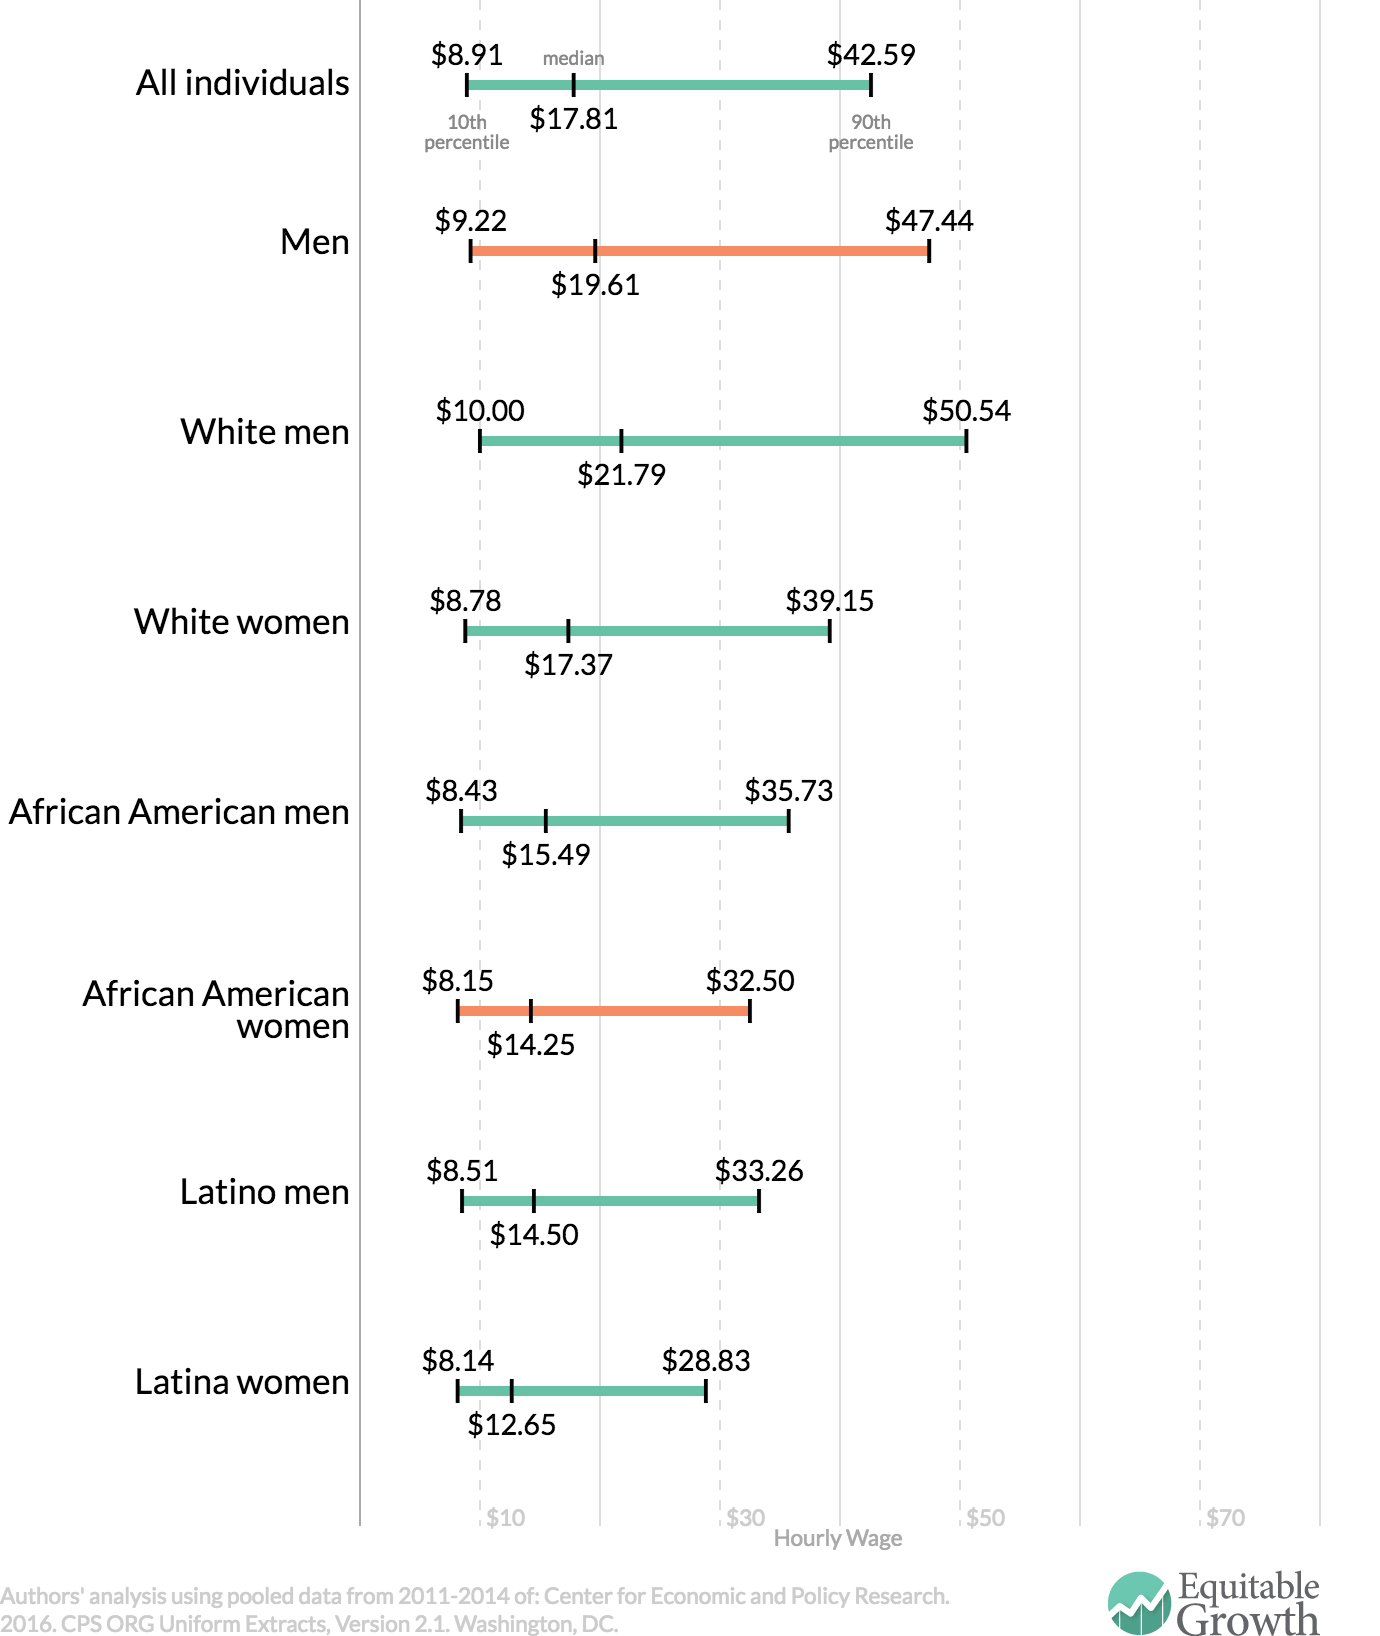
Figure from “A fresh look at the wage gap on African American Women’s Equal Pay Day

A Brief History of (In)equality: No Longer So Fresh at Project Syndicate

Elephant graph Google Search

No Longer Fresh at Project Syndicate: A Brief History of (In)equality: Here we have a very nice set of slides http://tinyurl.com/dl20160725a. It comes from a talk in Lisbon given by Barry Eichengreen, my sixth-floor office neighbor here at the Berkeley Economics Department. The slides have one of the great virtues of economic history: We, unlike other economists, are allowed to at least gesture at and even glory at the complexities of a situation. We are not forced, as other economists are, into ruthless oversimplification in pursuit of conceptual clarity—to be followed by the intellectually-faulty imperialism overloading more of an explanation of the world on a simple model then it can rightfully bear. Read MOAR at Project Syndicate

In Barry’s view, with respect to inequality there have been and are now ongoing six important first-order processes at work over the past two and a half centuries:

  1. The 1750-1850 pulling-apart of Britain’s income distribution, as the technologies and institutions of the British Industrial Revolution benefitted the urban bourgeoisie and the rural bourgeois gentry but neither the rural nor the urban proletariat http://amzn.to/2aFJAYz https://www.jstor.org/stable/2600061.

  2. The 1850-1914 great First Age of Globalization convergence of living standards and labor productivity levels in the Global North, as 50 million people left overcrowded agricultural Europe for resource-rich settler colonies and ex-colonies, and brought their institutions, their technologies, and their capital with them. Gaps of roughly 100% in wage levels between European sender and settler recipient economies shrank to 25% or so http://amzn.to/2a6aXz6.

  3. The 1750-1975 enormous pulling-apart of the global income distribution, as some parts of the world were able to take full or nearly full advantage of industrial and post industrial technologies, and others were not. Measured at purchasing power parity, America was twice as well off as China in 1800. By 1975 it was thirty times as well off http://tinyurl.com/dl20160725b.

  4. The 1870-1914 First Gilded Age rise of within-country inequality in the Global North, as entrepreneurship, industrialization, and rent seeking distributed the bulk of increases and productivity to the relatively well off and to the plutocracy http://tinyurl.com/dl20160725a.

  5. The 1930-1980 Social Democratic Age great compression of the earnings distribution in the Global North http://tinyurl.com/dl20160725c.

  6. The post 1980 divergence of outcomes within the Global North, as political economic choices lead to the coming of a Second Gilded Age to the Global North’s English-speaking portions.

I, however, think Barry’s talk is not economic-historiany enough. I would go further. I would start by adding five more first-order important factors and processes:

  1. The extraordinary post-1980 reduction in and yet stubborn persistence of remaining pools of absolute poverty. Inequality is a maldistribution of the opportunities for Isaiah Berlin’s positive liberty. But as my ex-colleague Ananya Roy points out, absolute poverty is a deprivation of Berlin’s negative liberty as well—it matters little when you are in a cage without any money whether you could theoretically buy a key http://amzn.to/2ac721f http://tinyurl.com/dl20160725d.

  2. The extraordinary nineteenth-century global shrinkage of slavery.

  3. The global reduction of other caste barriers—race, ethnicity, gender—which limit people’s opportunities to make use of whatever wealth they have.

  4. The post-1975 global-scale switch from increasing planet-wide divergence in wealth to convergence—although do note that, so far at least, all of the switch from the pre-1975 increasing divergence pattern is the result of two good growth generations in China, and one good growth generation in India.

  5. The dynamic of compound interest backed by political-economic rent-seeking identified by Thomas Piketty—with the caveat that Piketty’s logic applies not very much to our past, even our 1980-2015 past, but may well be an important part of our 2015-2100 future http://amzn.to/2ab4rSI.

Complicated, yes? A matter for careful adjustment of institutions by those with social science expertise directed by elected leaders who share the people’s value, yes?

And, most important, I would finish by adding, underlining, and emphasizing a twelfth process:

Populist mobilizations to try to deal with problems of inequality have had consequences we can call “checkered” only out of politeness. Populist mobilizations have been directed in France toward installing an Emperor, Napoleon III, and toward overthrowing democratic governments of the Third Republic. Populist mobilizations in America have been directed at excluding immigrants from China to California, at excluding immigrants from anywhere save northwest Europe, at enforcing Jim Crow. Populist mobilizations in central Europe were turned toward imperialism as the problem was redefined as that Germany and Italy were “proletarian nations” that needed bigger empires. And only Naziism could surpass in its consequences the populist mobilizations that were turned to entrenching in power Lenin’s “party of a new type” and all of its imitators. The constructive responses were fewer: Extending the franchise. Progressive income taxes. Social insurance. Building society’s physical and, more important, human capital. Opening economies. Prioritizing full employment. Encouraging migration to where ample resources and, more important, good institutions were already established. History teaches us that those have been the reactions to inequality that have made the world a better place.

Of course, history also tells us that we fail to learn what lessons history has to teach us.

Must-Read: Ruddier Bachmann and Eric Sims: Confidence and the Transmission of Government Spending Shocks

Must-Read: Ruddier Bachmann and Eric Sims: Confidence and the Transmission of Government Spending Shocks:

In a standard structural VAR, an empirical measure of confidence does not significantly react to spending shocks and output multipliers are around one…

In a non-linear VAR, confidence rises following an increase in spending during periods of economic slack and multipliers are much larger. The systematic response of confidence is irrelevant for the output multiplier during normal times, but is critical during recessions. Spending shocks during downturns predict productivity improvements through a persistent increase in government investment relative to consumption, which is reflected in higher confidence.

Why Do We Talk About “Helicopter Money”?

Why do we talk about “helicopter money”? We talk about helicopter money because we seek a tool for managing aggregate demand–for nudging the level of spending in an economy up to but not above the economy’s current sustainable productive potential–that is all of:

  1. Effective and successful–even in the very low interest rate world we appear to be in.
  2. Does not excite fears of an outsized central bank balance sheet–with its vague but truly-feared risks.
  3. Does not excite fears of an outsized government interest-bearing debt–with its very real and costly amortization burdens should interest rates rise.
  4. Keeps what ought to be a technocratic problem of public administration out of the mishegas that is modern partisan politics.

Right now the modal projection by participants in the Federal Reserve’s Open Market Committee meetings is that the U.S. Treasury Bill rate will top out at 3% this business cycle. It would be a brave meeting participant who would be confident that we would get there–if we would get there–with high probability before 2020. That does not provide enough room for the Federal Reserve to loosen policy by even the average amount of loosening seen in post-World War II recessions. Odds are standard open market operation-based interest rate tools will not be able to do the macroeconomic policy stabilization job when the next adverse shock hits the economy.

The last decade has taught us that quantitative easing on a scale large enough to rapidly return economies to full employment is one bridge if not more too far for central banks as they are currently constituted–if, that is, it is possible at all. The last decade has taught us that bond-funded expansionary fiscal policy on a scale large enough to rapidly return economies to full employment is at least several bridges too far for our political systems, at least as they are currently constituted.

If we do not now start planning for how to implement helicopter money when the next adverse shock comes, what will our plan be? As a candidate for a tool capable of doing all four of these things, helicopter money–giving the central bank the additional policy tool of printing up extra money and either mailing it out to households as checks or getting it into the hands of the public by buying extra useful stuff–is our last hope, and, if it is not our best hope, then I do not know what our best hope might be.


Must-Read: Gabriel Chodorow-Reich and Johannes Wieland: Secular Labor Reallocation and Business Cycles

Must-Read: Gabriel Chodorow-Reich and Johannes Wieland: Secular Labor Reallocation and Business Cycles:

We study how economies respond to idiosyncratic shocks which induce reallocation of labor across industries….

We find sharp evidence of reallocation contributing to worse employment outcomes if it occurs coincident with a national recession, but little difference in outcomes if it occurs during an expansion. We repeat our empirical exercise in a multi-area, multi-sector search and matching model of the labor market. The model reproduces the empirical asymmetry subject to inclusion of two key frictions: imperfect mobility across industries, and downward nominal wage rigidity. Combining the empirical and model results, we conclude that reallocation can generate substantial amplification and persistence of business cycles at both the local and the aggregate level.