Must-Read: Claudia Sahm: Telling Macro Stories with Micro

Must-Read: Claudia Sahm: Telling Macro Stories with Micro:

Economists are avid storytellers….

A good story paper in economics, according to David Romer, has three characteristics: a viewpoint, a lever, and a result…. Blog or media coverage… focuses on the result…. Economists… spend more time on the lever, the how-did-they-get-the-result part…. The viewpoint matters… but it usually holds across many papers.

Best to focus the new stuff. Except when the viewpoint comes under scrutiny, then the stories can really change…. One long-standing viewpoint in economics is that changes in the macro-economy can largely be understood by studying changes in macro aggregates. Ironically, this viewpoint even survived macro’s push to micro foundations with a “representative agent” stepping in as the missing link between aggregate data and micro theory…. An ever-growing body of research and commentary is helping to identify times when differences at the micro level are relevant for macro outcomes….

In the past nine years, have seen models that condition on aggregate measures of income, wealth, interest rates, sentiment, and credit conditions do a pretty good job explaining the changes in aggregate consumer spending…. Adding micro heterogeneity to macro models is one in a long list of possible improvements. Adding a more realistic financial sector, exploring non-linearities, relaxing rational expectations, and extracting a better signal from noisy aggregate data are all in the queue too…. I suspect the Representative Agent is not getting voted off macro island any time soon….

Economics is not supposed to be about economists, but sometimes our stories can feel that way, especially to non economists. And to be fair, the viewpoints that economists bring to their work do have an impact on the results, if nothing else by what we choose to study…

Taking a look at unpredictable schedules

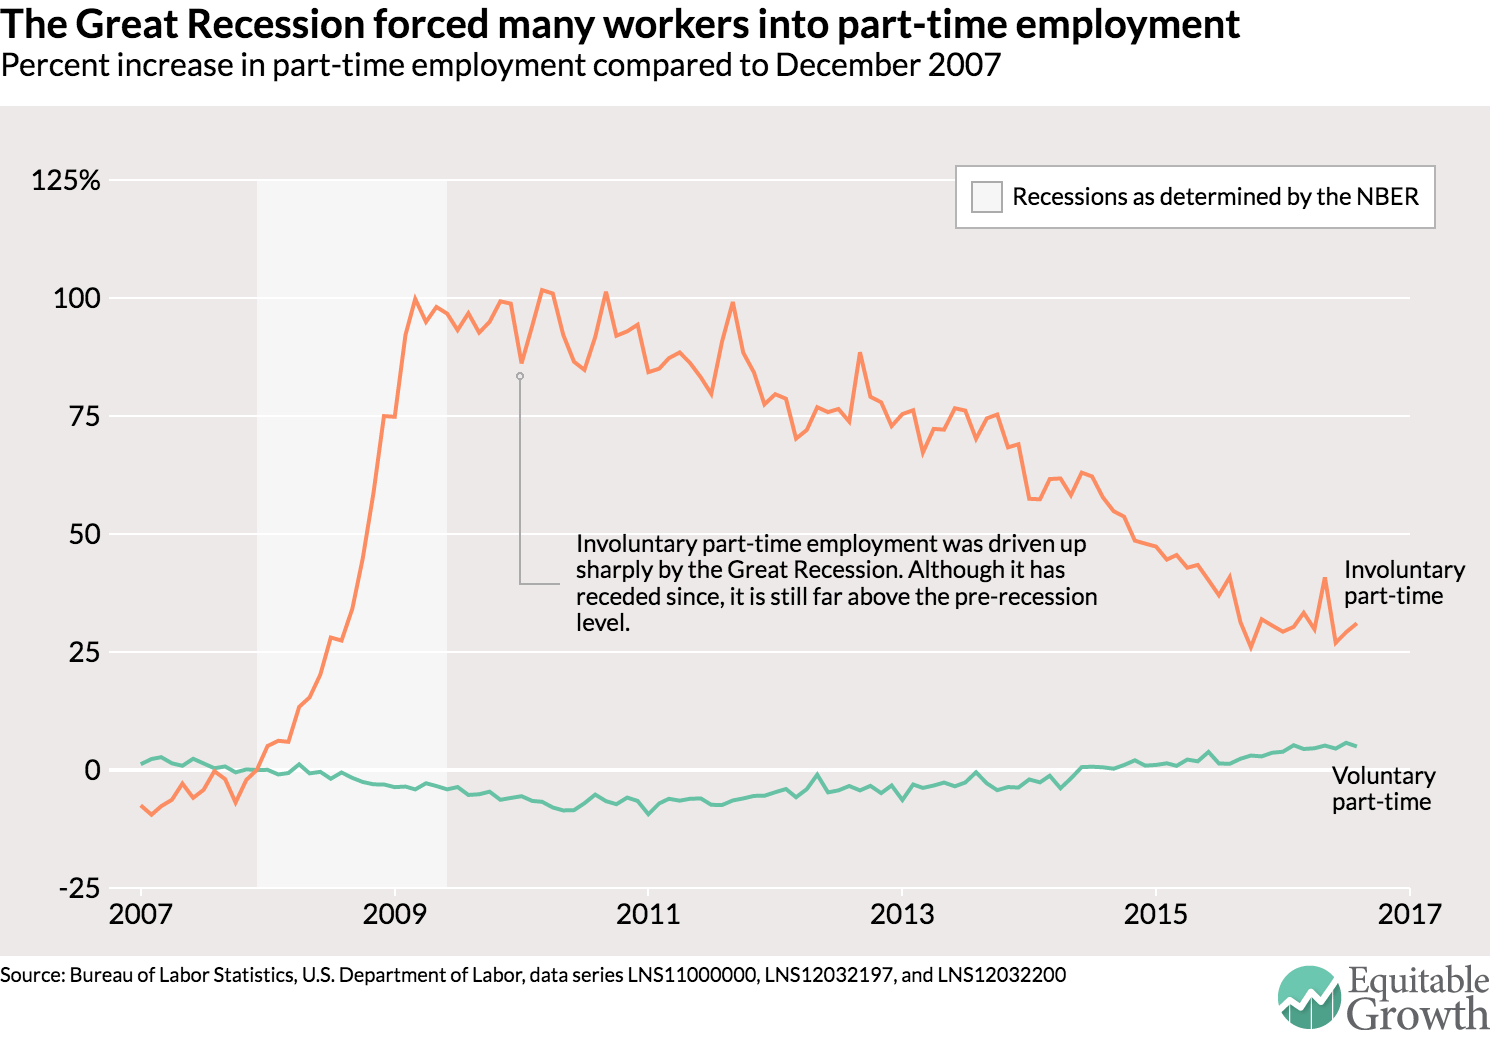
The first Labor Day celebration took place on September 5, 1882 in New York City, when thousands of workers marched and took an unauthorized “workingman’s holiday” to protest the unlimited hours many workers of the era were compelled to put in. While overwork is still a problem for many Americans, a growing number of Americans are grappling with unpredictable, constantly shifting schedules, as detailed in a new issue brief today from Equitable Growth.

Unpredictable scheduling is often aided by “just-in-time” scheduling software, which allows employers to generate schedules based on predicted consumer demand, accounting for factors such as time of day, weather, the season, or even a nearby sporting event. But they do so at the expense of the worker, many of whom see their schedules shift from day-to-day and are given little advanced notice of when they are supposed to show up to work

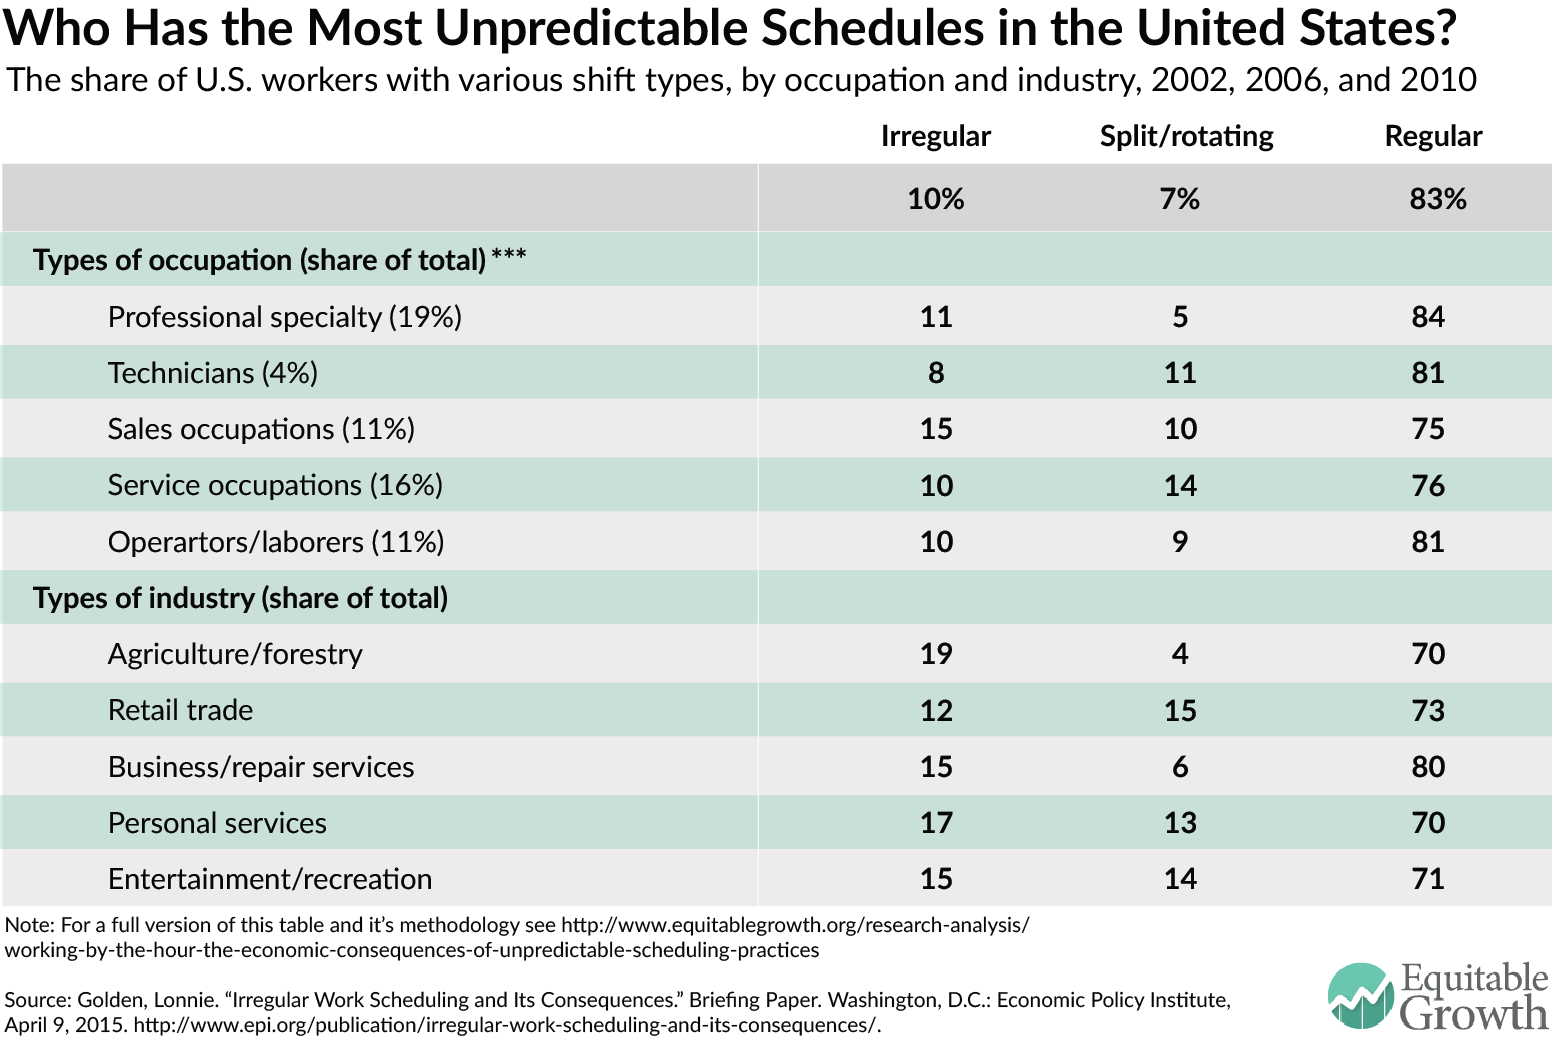
These kind of unstable schedules affect about 17 percent of the labor force, according to one study. They tend to be most common in retail and service sectors, which are some of the fastest-growing industries and also ones in which workers already face a lack of benefits, poor working conditions, and insufficient pay. (See Table 1.) What’s more, employers frequently require full-time availability to ensure there are always enough workers during busy periods but then fail to give stable or full-time hours.

Employees may spend time and money commuting to work for a scheduled shift only to be sent home without pay if business is slow. For those with children, that may mean they have to pay for childcare even if they themselves did not get paid. And within some industries, it is not uncommon for employers to require workers to remain on-call, keeping their schedules free on the chance that their employer may need them.

These practices perpetuate existing gender and racial inequalities, as workers of color—especially women of color—tend to be sorted into the low-paid positions most most affected by these unstable scheduling practices (despite sharing similar levels of education and age with their white counterparts). The volatility in hours can mean that workers may not earn enough to make ends meet, which affects family well-being as well as economic demand. Yet workers may be unable to take a second job or pursue the kind of education necessary for upward mobility because of the constantly fluctuating hours. In fact, many employees—especially those with care responsibilities—are fired or forced to quit in order to search for a new job.

As we lay out in our issue brief, this has costs for firms. While reducing labor costs may slash expenditures in the short-term, treating workers’ time as just another variable in the cost equation undermines productivity and creates high turnover rates, both of which are costly. Unpredictable schedules also affect who can take jobs and how productive workers may be on the jobs, which also has an impact on business profits.

Despite the problems, federal law does not address unpredictable schedules. But in the face of mounting pressure from employees and policymakers, many private companies have begun to overhaul their work policies. Six major retailers, for example, ended on-call scheduling after attorney general Eric Schneiderman launched an inquiry into their workforce. Wal-Mart Stores Inc., which was one of the first adopters of just-in-time scheduling practices, has announced that it is testing a new system that gives employees the choice to have fix schedules for up to six months at a time. Technology companies also are helping workers take matters into their own hands, and are creating a variety of new smartphone apps that can help employees and employers provide more schedule flexibility.

Local governments also are beginning to pay attention to this issue. After San Francisco enacted the Retail Workers Bill of Rights in 2014, which restricts employers’ ability to impose unpredictable and last-minute schedules on their employees, 18 different states and municipalities introduced similar work-hour legislation in 2015. A bill was introduced last year on the federal level as well.

Of course, legislation alone cannot completely eliminate scheduling abuses by employers, but a federal standard would provide an important marker that states and localities could improve upon and motivate the private sector to invent new ways to balance labor costs and profits.


Must-Read: Mariana Mazzucato: The Case for the Entrepreneurial State

Must-Read: Mariana Mazzucato: The Case for the Entrepreneurial State:

Mariana Mazzucato… contends that, contrary to the claims of GOP presidential hopefuls, the American economy has benefited immensely from government intervention…

The United States, the preacher of the small-state, free-market doctrine, has for decades been directing large public investment programs in technology and innovation that underlie its past and current economic success….

For evidence of the state’s role in driving long-run innovation-led economic growth, look no further than Silicon Valley….

It would all be fine if they admitted getting this support—instead, they prefer the ‘we made that alone’ narrative.This is bad for future innovation since the future ‘surfers’ may have a very small wave….

‘If you want to think differently about economics, The New School is the place to be,’ says Mazzucato, who holds the RM Phillips Chair in the Economics of Innovation in the Science Policy Research Unit at the University of Sussex. ‘You learn a rich, diverse set of theories. It’s a rare haven, not only for heterodox thinking but for rigorous thinking’…

Weekend reading: “Climbing out the Jackson Hole” edition

This is a weekly post we publish on Fridays with links to articles that touch on economic inequality and growth. The first section is a round-up of what Equitable Growth published this week and the second is the work we’re highlighting from elsewhere. We won’t be the first to share these articles, but we hope by taking a look back at the whole week, we can put them in context.

Equitable Growth round-up

Tax Increment Financing is a popular local economic development tool, but it may have an important unintended consequence. By reducing property taxes, it may affect educational spending. Kavya Vaghul digs into this issue.

The annual Jackson Hole conference is a time for central bankers and researchers to get together to discuss important macroeconomic trends. And sometimes it leads to signs that monetary policy may be changing. But, unfortunately, that didn’t happen this time.

You may have heard of the “47 percent,” the share of Americans who don’t pay federal income tax. But that nomenclature is based off a snapshot statistic from 2009. How do these trends look over time? A new study takes a look.

Gross domestic product was not intended to be a measure of economic welfare. But it gets used that way. A new study moves beyond GDP to create a new measure of welfare that has some interesting results.

Earlier today, the U.S. Bureau of Labor Statistics released new employment data for August 2016. Check out Equitable Growth’s key graphs from this new report.

Links from around the web

In studies of economic downturns, economists have often used models that assume all households are the same. But that’s starting to change. Kurt Mitman, Dirk Krueger, and Fabrizio Perri write up their study showing the impact of inequality on the severity of the Great Recession. [voxeu]

What’s holding back productivity growth? Looking at a new report on the trend, Martin Sandbu looks at the roles of a lack of investment and a slowdown in total factor productivity and the potential policies to help boost growth. [free lunch]

Residential housing investment has been very weak in the wake of the Great Recession. What’s holding back more housing construction? Adam Ozimek argues that it’s not supply-side constraints. [moody’s]

Conversations about housing and rental prices almost always center on the median or mean price. But a new study, highlighted by Emily Badger, looks at the distribution of rental offers showing that U.S. locations with lower rents also have a narrower distribution. [wonkblog]

A recent trend in economics research is to use the variation in trends or policies across the United States in order to try to answer questions often posed about the country as a whole. Many economists have done work in this area, but the Chicago Booth School of Business highlights some research by Chicago economists. [chicago booth review]

Friday figure

Figure from “Equitable Growth’s Jobs Day Graphs: August 2016 Report Edition” by Equitable Growth staff

Equitable Growth’s Jobs Day Graphs: August 2016 Report Edition

Earlier this morning, The U.S. Bureau of Labor Statistics released new data on the U.S. labor market during the month of June. Below are five graphs compiled by Equitable Growth staff highlighting important trends in the data.

The share of prime-age workers is on the rise, but still significantly below its pre-recession level.

The pace of recovery in the prime-age employment rate is weak when compared to previous recoveries.

Wage growth is higher than it was earlier in the recovery, but it remains relatively weak and is mostly driven by low inflation.

Part-time employment for economic reasons has yet to return to its pre-recession level.

The sub-5 percent unemployment rate hides a significant amount of variation in unemployment by race and ethnicity.  

Must-Reads: September 2, 2016


Should Reads:

Must-Read: Willem Buiter: EU and China Ought to Use Helicopter Money

Must-Read: Willem Buiter: EU and China Ought to Use Helicopter Money:

Helicopter money is a coordinated monetary and fiscal stimulus…

It is a fiscal stimulus funded permanently by the Central Bank. There are obvious win-win situations that we could have. Restructuring of debt if possible, haircuts if necessary, and then a well-targeted fiscal stimulus funded ultimately through the European Central Bank (ECB), people’s helicopter money….

The Central Bank itself provides a fiscal stimulus by sending checks to every man, woman, and child of the country…. In a country like Germany where infrastructure investment is needed, the government announces and implements a large-scale investment program and indirectly sells the debt to fund this program to the central bank, which monetizes it…. [China needs] fiscal stimulus targeted mainly at consumption, not at investment. Some capital expenditure like social housing, affordable housing, even some infrastructure. But organization supporting infrastructure, not high-speed trains in Tibet. It has to be funded by the central government, the only entity with deep pockets, and it has to be monetized by the People’s Bank of China…

Looking beyond GDP when measuring welfare

A new paper by Charles Jones and Peter Klenow puts forth a new model of a person’s welfare based on how much they consume and how much time they are able to take off.

Gross domestic product often gets confused for a measure of economic well-being. That’s understandable given how often GDP or GDP growth rates gets held up as the key measure of economic health. But should policymakers really care about how much an economy produces every year in and of itself? Economists (and many other people) would agree that increasing economic output is good in so much that it allows people to consume things, live longer, and have some leisure time. GDP, which is simply the value of all final goods and services produced in a country in one year, doesn’t fully capture those conditions. A new paper takes a stab at creating a measure of economic welfare.

The paper, by economists Charles Jones and Peter Klenow of Stanford University, was published in the latest issue of American Economic Review. The two economists try to move beyond GDP and build a measure of economic welfare that uses data on consumption, leisure, any inequality evident in those two variables, and life expectancy in a country. Why those data? In Jones and Klenow’s model, a person’s welfare is based on how much they can actually consume and how much time they can actually take off. If overall consumption is a small percent of income or worker hours are long, then economic welfare will be lower for a given level of economic output. The same goes for consumption or leisure inequality—if they are high (consumption and leisure are concentrated among a few people) or if life expectancy is low (a person might not be around long enough to enjoy consumption or leisure) then the average economic welfare will be lower than income alone would suggest.

Before digging into the specific results from the paper, let’s be clear that the measure of well-being developed by Jones and Klenow is dependent upon the assumptions of their model. The economists run the model with a number of other assumptions as a check on their results and they hold up. But the model-based nature of the results should be noted.

The results end up being quite interesting. While there is a very strong correlation between the two authors’ measure of welfare and GDP per person, comparisons between countries are different than if we used GDP per person. If policymakers were to compare the United States to France by average consumption, for instance, then France’s living standard is only 60 percent of the U.S. level. But using a measure that includes France’s lower inequality, lower mortality rate, and more leisure, France’s welfare-based living standard is about 92 percent of the U.S. level, with inequality, mortality, and leisure all boosting the relative standard equally.

All Western European countries in the data set developed by Jones and Klenow end up looking closer to the United States based on this measures. Lower-income countries, however, appear further away from the high-income countries due to much lower life expectancy and high rates of inequality.

Jones and Klenow’s measure also can be used to make comparisons over time. Their results show that standards of living measured by welfare have grown much quicker than standards based on income growth. The difference—3 percent per year versus 2 percent per year from the 1980s to the mid-2000s—might not seem large, but it’s the difference between standards of living doubling every 24 years instead of in 36 years.

The new paper by Jones and Klenow makes for very interesting reading, but it’s only the beginning of a new effort. The two economists point out that with more and better data they could loosen some of their assumptions in the model and that there are other applications of their model for building measure of welfare. Hopefully, they and others looking at how to better capture trends in living standards will continue to work hard on these questions. But maybe, for their welfare’s sake, not too hard.

Has Macro Policy Been Different since 2008?

3 Month Treasury Bill Secondary Market Rate FRED St Louis Fed

Was macro policy different after 2008? I interpret that to be the question: “Did macro policy follow the same rule after 2008 that people had presumed before 2008 it would follow in a true tail event?” To answer that question requires determining just what policy rule people back before 2008 thought that the U.S. government was following. Let me propose four candidates for our (implicit) pre-2008 macroeconomic policy rule:

  1. Limit fiscal policy to automatic stabilizers, and follow a Taylor rule with John Taylor’s coefficients (Taylor).
  2. Follow Milton Friedman’s advice and target velocity-adjusted money: if nominal GDP is below trend, print more money and buy bonds; if that does not restore nominal GDP to either the trend level or the trend growth rate (depending on whether your favorite flavor has or does not have base-drift sprinkles), repeat (Friedman).
  3. Use open market operations to manipulate the short-term safe nominal interest rate to stabilize inflation and unemployment as long as you are not at the zero lower bound. At the zero lower bound credibly promise to be irresponsible in the future in order to raise inflation expectations by enough to push the real interest rate down to its negative Wicksellian neutral rate value, and so restore real macroeconomic balance (Krugman).
  4. Use open market operations to manipulate the short-term safe nominal interest rate to stabilize inflation and unemployment as long as you are not at the zero lower bound. At the zero lower bound resort to expansionary fiscal policy and do as much of it as needed, at least as long as interest rates on long-term government debt remain low (Blinder).

Were there any other live candidates for “the policy rule” back before 2008?

Must-Read:Takashi Negishi (1960): Welfare Economics and Existence of an Equilibrium for a Competitive Economy

Must-Read: The market’s social welfare function: weight each individual’s utility by the inverse of their marginal utility of income, and weight by that. The desires of those who have the least need for goods and services therefore get the greatest weight:

Takashi Negishi (1960): Welfare Economics and Existence of an Equilibrium for a Competitive Economy:

A competitive equilibrium is a maximum point of a social welfare function…

…which is a linear combination of the utility functions of consumers, with the weights in the combination in inverse proportion to the marginal utilities of income. Then the existence of an equilibrium is equivalent to the existence of a maximum point of this special social welfare function. Therefore, we can prove the former by showing the latter…