Mariana Mazzucato: The Case for the Entrepreneurial State: Mariana Mazzucato… contends that, contrary to the claims of GOP presidential hopefuls, the American economy has benefited immensely from government intervention…
Must-Read: Larry Summers is right: forward guidance and large-scale QE are unlikely to be powerful enough tools for the Fed to deal with the next recession. This is especially true given the Fed’s current policy posture. Large-scale QE is, I believe, primarily useful as a signal of forward guidance. And the Federal Reserve’s current eagerness to tighten monetary policy without any visible signals of an overheating high pressure economy is greatly undermining its ability to credibly engage in forward guidance in the future:
I was disappointed in what came out of Jackson Hole for three reasons…
The Fed should have signaled a desire to exceed its two percent inflation target during periods of protracted recovery and low unemployment…. Even apart from the desirability of allowing inflation to rise above two percent in a happy economic scenario GDP, labor market and inflation expectations data all make a compelling case against a rate increase….
My second reason for disappointment… was that Chair Yellen… was too complacent to conclude that:
even if average interest rates remain lower than in the past, I believe that monetary policy will, under most conditions, be able to respond effectively.
This statement may rank with Ben Bernanke’s unfortunate observation that subprime problems would be easily contained. Rather I believe that countering the next recession is the major monetary policy challenge before the Fed…. It is more than 50 percent likely that we will have a recession in the next 3 years. Countering recessions requires 400 or 500 basis points of monetary easing. We are very unlikely to have anything like that much room for easing when the next recession comes.
Chair Yellen, relying… on… David Reifschneider using the FRBUS model, comes to the relatively serene conclusion that by using forward guidance and QE… the Fed will likely able to respond adequately to the next recession with its existing tool kit. I think this conclusion is unlikely to be right…. There is an important methodological point here: distrust conclusions reached primarily on the basis of model results. Models are estimated or parameterized on the basis of historical data. They can be expected to go wrong whenever the world changes in important ways. Alan Greenspan was importantly right when he ignored models and maintained easy policy in the mid 1990s because of other more anecdotal evidence that convinced him that productivity growth had accelerated. I believe a similar skeptical attitude towards model results is appropriate today….
I wonder what credibility Fed forward guidance is likely to have given the utter disconnect over many years between Fed and market views regarding future rate and the track record so far of the Fed being wrong and the market being right…. Even if unconventional policy could be highly efficacious in moving long term rates and even if QE induced moves in long rates were potent, there is the question of how much room there is to bring down long rates. Reifschneider… shows that with a big recession rates would likely approach -6 percent, or even -9 percent, but for the zero lower bound. I find the idea that forward guidance and QE could do the anything like the work of 600, let alone 900, basis points of rate cutting close to absurd…
The current discussion of “slow growth in measured productivity” here in the U.S. seems to suffer from a great deal of confusion. From my perspective, there are six things going on:
Since the 1920s, the rise of non-Smithian information goods…
Since 1973, the productivity slowdown…
Since 1995, the semiconductor-driven infotech speedup…
Since 2004, Moore’s Law hitting the wall…
Since 2008, what we will soon be calling “The Longer Depression”…
And, remember, policy changes to speed productivity growth may well be nearly orthogonal to all of the above save (5)…
To talk about the cause of “slow growth in measured productivity” as if it is just one, not five, things causes confusion. To identify one or a small number of causes of a single thing that is “slow growth in measured productivity” causes great confusion. And then to insist that the best policy move is to undo that one or small number of thing causes even greater confusion…
The productivity puzzle: How can we speed up the growth of the economy? Friday, September 9, 2016, 9:30 – 11:00 am, Falk Auditorium: The Brookings Institution:
After nearly a decade of strong productivity growth starting in the mid-1990s, productivity growth has slowed down over the most recent decade. Output per hour worked in the U.S. business sector has grown at only 1.3 percent per year from 2004 to 2015, and growth was even slower from 2010 to 2015 at just 0.5 percent a year. These rates are only half or less of the pace of growth achieved in the past.
The United States is not alone in facing this problem, as all of the major advanced economies have also seen slow productivity growth. This slow growth has been a major cause of weak overall GDP growth, stagnation in real wages and household incomes, and it strongly impacts government revenues and the deficit.
On September 9, 2016 the Initiative on Business and Public Policy and the Hutchins Center on Fiscal and Monetary Policy at Brookings will host a forum on the policy implications of the growth slowdown. Senior Fellow Martin Baily will present an overview paper on the causes of the slowdown, followed by a panel discussion on the most effective policies to enhance productivity performance. After the panel discussion, panelists will take questions from the audience. The event will be webcast live.
When social scientists, policymakers, and pundits talk about inequality, it’s important to specify what kind inequality they are actually talking about. Most of them will be talking about income inequality, though others might be talking about wealth and occasionally an economist might interject to mention inequality of consumption. All of these inequality measures are important, but economic analyses tend to focus on one measure at a time due to data constraints. Yet data on income, wealth, and consumption can be compared and combined to give policymakers a better picture of economic inequality writ large. Twopapers, funded in part by Equitable Growth and released today as working papers, provide just that kind of multidimensional view of inequality.
The two papers are part of an effort to see how the distributions of income, wealth, and consumption have shifted over the years. The first one is by Jonathan Fisher of Stanford University, David Johnson of the University of Michigan, Jonathan Latner of the University of Bremen, Timothy Smeeding of the University of Wisconsin, and Jeffrey Thompson of the Federal Reserve Board of Governors. The second one is by Fisher, Johnson, Smeeding and Thompson.
The first paper uses data from the Panel Study of Income Dynamics, a longitudinal study that allows researchers to track changes in the income, wealth, and consumption of households over time. It looks not only at inequality, but mobility as well. When it comes to inequality, the researchers find that inequality of all three variables has increased since 1999. The correlation between income, consumption, and wealth is high, but the correlation is not perfect. People with high income are very likely to have high levels of consumption and wealth, but that’s not necessarily always true. There is also movement within a lifetime along these measures, but as the graph below shows there is less relative movement for those at the top and the bottom of the distributions of these measures of inequality.
Smeeding income/wealth mobility
Whether it's wealth or income, those at the top and the bottom are very likely to stay there
Chance an individual starting in a quintile ends up in each quintile later in life.
The second paper also uses Panel Study of Income Dynamics data but supplements it with data from the Federal Reserve’s Survey of Consumer Finances. Like the first paper, this effort also finds that inequality in income, wealth, and consumption has increased. But in this paper, the economists also look at inequality in what they call “two and three dimensions,” which analyzes the ways in which these different kinds of inequality interact with each other.
Think of their analysis this way: Inequality often gets measured by the share of income or consumption or wealth held by a fraction of the population such as the top 1 percent, the top 5 percent, the bottom 20 percent, and so on. The authors do that analysis and refer to it as inequality in one dimension. They then look at the “cross-shares” of inequality. For instance, they look at the share of consumption by households in the top 5 percent of the income distribution and compare that to the increase in the share of consumption by those in the top 5 percent of consumption. If the increase in the share of consumption by top earners is higher than the increase in the share for top consumers, then having a high income is now more correlated with having high consumption levels.
After conducting an analysis like this for all three measures and in three dimensions as well, the economists find that multi-dimensional inequality has increased faster than inequality in just one dimension. Those with high incomes are now more likely to have high levels of consumption and wealth and those with low income are more likely to have low consumption and wealth.
The authors note the important role of wealth in helping to ride out income shocks and smooth consumption. This might lead policymakers and social scientists alike to think a bit more about the role of wealth inequality in the economy over inequality of income or consumption. But of course, researchers should resist the urge to make one inequality rule them all, as the rest of the paper shows. A more detailed picture of multidimensional inequality would be quite useful.
Must-Read: Let me, for one, say that I am surprised that it now appears likely that there will be no Brexit recession in Britain: I would not have thought that a 15% decline in the value of the pound would have been enough to offset the negative shock to domestic investment delivered by the Brexit vote:
I thought that it would have required emergency expansionary monetary policy measures the Bank of England was not willing to undertake…
Once again: the rules: (1) Paul Krugman is right. (2) If you think Paul is wrong, see (1)…
“The City’s smartest people are being forced to admit they were wrong about a ‘Brecession’”…
So says Business Insider, now that good UK PMI surveys have caused Credit Suisse and Morgan Stanley to back off their forecasts of a Brexit-induced recession.
But I wasn’t wrong. Yay me!
OK, seriously, at least for the moment it seems as if my skepticism about dire short-run forecasts, despite my agreement about the long run costs has been vindicated:
Economists have very good reasons to believe that Brexit will do bad things in the long run, but are strongly tempted to sex up their arguments by making very dubious claims about the short run. And the fact that so many respectable people are making these dubious claims makes them seem well-reasoned when they aren’t.
I could, of course, still turn out to be wrong. But let me say that what I’m really enjoying here — aside from the chance to claim that I was right — is, for once, having an argument with smart people who are trying to get it right. So much of my time these days is spent combatting sheer derp, that it’s almost like a vacation to debate propositions that aren’t self-evidently stupid.
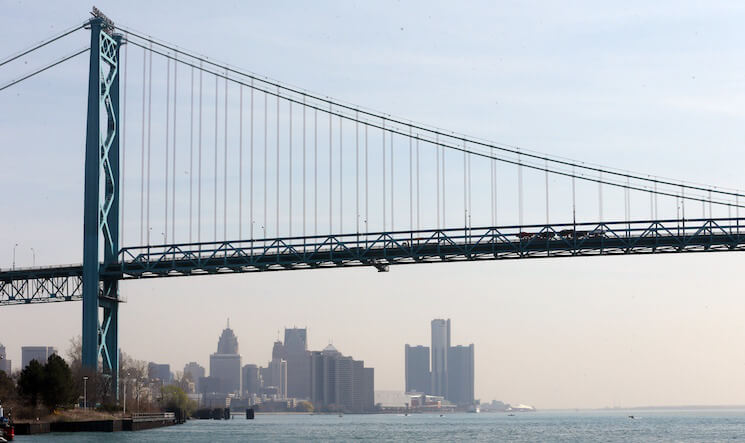
From skyrocketing unemployment rates to shrinking household expenditures, the fallout of the Great Recession of 2007-2009 rattled the U.S. economy. A new working paper released today by the Washington Center for Equitable Growth quantifies just how the Great Recession affected a group of already vulnerable people—low- and moderate-income households in the Detroit metropolitan area.
This new research by Equitable Growth grantee and University of Michigan professor of law Michael Barr and University of Michigan graduate student of economics Daniel Schaffa uses two different local surveys to measure the effects of the recession. For pre-recession data, they turn to the Detroit Area Household Financial Services Study, which exclusively focused on low- and moderate-income families between 2005 and 2006. For post-recession outcomes, the authors cite the 2009-2010 Michigan Recession and Recovery Study, a survey designed to to assess comprehensively the financial situations of Detroit-area households, using some of the same questions asked in the earlier Detroit Area Household Financial Services Study.
When matched, these targeted surveys provide a more nuanced characterization of pre- and post-recession employment, household income, housing, and financial health than other frequently-used datasets such as the Survey of Consumer Finance, Panel Study of Income Dynamics, or the RAND American Life Panel. Ultimately, the two local surveys helped Barr and Schaffa calculate the differences in pre- and post-recession levels on a number of outcomes for households in Census block groups with less than 80 percent of the Detroit metro area median income.
Barr and Schaffa find, for example, that after the Great Recession the median duration of unemployment for low- and moderate-income households increased from 5.2 months to 9.5 months. Meanwhile, the employment rate—the share of the working-age population with a job—dropped by 9.0 percentage points. Median household income deteriorated, falling from $24,000 pre-recession to $19,000 post-recession. Income for African American households declined even more dramatically, with average household income declining by more than $7,000 over the period.
Housing statistics were equally dismal. Both homeownership rates and home values fell. The median home value saw a $50,000 reduction.
The paper provides data on a range of other household outcomes, including the change in rates of home foreclosures, mortgages payments, health care access, payday lending, overdraft usage, and even marriage—all broken down by gender, race, and educational attainment. These measures all tell the same story: For low- to moderate-income families in Detroit–those who arguably started the worst off–the Great Recession had pernicious effects. Though these findings are consistent with what we might expect, Barr and Schaffa show the magnitude of just how devastating the Great Recession was for already disadvantaged households.
So what do these results mean for policy? Barr and Schaffa propose designing policies to help shield these vulnerable families against the effects of future recession. Strengthening safety net programs and improving access to financial services can help ensure those who are already struggling to make ends meet don’t lose even more.
Jonathan Fisher, Research Scholar, Stanford Center on Poverty and Inequality David Johnson, Research Professor, Survey Research Center, Institute
for Social Research, University of Michigan, Law School Timothy Smeeding, Lee Rainwater Distinguished Professor of Public Affairs
and Economics, University of Wisconsin-Madison Jeffrey Thompson, Principal Economist, Board of Governor of the Federal Reserve System
Updated December 2017
Abstract:
We do not need to and should not have to choose amongst income, consumption, or wealth as the superior measure of well-being. All three individually and jointly determine well-being. We are the first to study inequality in three conjoint dimensions for the same households, using income, consumption, and wealth from the 1989-2016 Surveys of Consumer Finances (SCF). The paper focuses on two questions. What does inequality in two and three dimensions look like? Has inequality in multiple dimensions increased by less, by more, or by about the same as inequality in any one dimension? We find an increase in inequality in two dimensions and in three dimensions, with a faster increase in multi-dimensional inequality than in one-dimensional inequality. Viewing inequality through one dimension greatly understates the level and the growth in inequality in two and three dimensions. The U.S. is becoming more economically unequal than is generally understood. JEL Codes: D31, E21, I31.
Kavya Vaghul, Research Analyst, Washington Center for Equitable Growth Ben Zipperer, Research Economist, Washington Center for Equitable Growth
Abstract:
We introduce datasets of historical state and sub-state minimum wage levels for the United States. From these daily minimum wage increases, we create state and sub-state panels at daily, monthly, quarterly, and annual frequencies. The state datasets span May 1974 to July 2016 and the sub-state datasets include city and county changes from January 2004 to July 2016. Estimating teen wage and employment elasticities using the state data generate very similar estimates to those estimated using minimum wage data from other recent papers. For the most recent version of these data and the code that produces them, see our Github page.
Or for a direct download of the state and sub-state data releases, see the links in the right-hand column.
Jonathan Fisher, Research Scholar, Stanford Center on Poverty and Inequality David Johnson, Research Professor, Survey Research Center, Institute for Social Research, University of Michigan, Law School Jonathan Latner, PhD, Bremen International Graduate School of Social Sciences Timothy Smeeding, Lee Rainwater Distinguished Professor of Public Affairs and Economics, University of Wisconsin-Madison Jeffrey Thompson, Principal Economist, Board of Governor of the Federal Reserve System
Abstract:
Recent studies of economic inequality almost always separately examine income inequality, consumption inequality, and wealth inequality, and hence, these studies miss the important synergy between the three measures explicit in the lifecycle budget constraint. Using the Panel Study of Income Dynamics (PSID), we study inequality in three dimensions, focusing on the conjoint distributions of income, consumption, and wealth for the same individuals. We find that the trends in inequality in income, consumption, and wealth similarly increase between 1999 and 2013. We examine the pairwise distributions of our measures using the average propensity to consume and the wealthincome ratios. Using the longitudinal nature of the PSID, we follow people over this period and find mobility is similar using income, consumption and wealth. We conclude that while all three types of inequality are rising, wealth increasingly acts as a buffer to cushion income changes, which could reduce mobility – both intra- and inter generational mobility.
Michael Barr, Professor of Law, University of Michigan, Law School Daniel Schaffa, PhD Candidate in Economics, University of Michigan, Law School
Abstract:
The Financial Crisis and ensuing Great Recession caused enormous hardship for households. Using original datasets, we examine the effects of the recession on a population many might think had nothing left to lose: low- and moderate-income households in the Detroit metropolitan area. We find that the Great Recession in fact imposed significant costs on these households, reducing employment and assets and increasing hardships in a wide variety of ways. Our findings suggest the need for more robust safety net policies and financial services that can help cushion the blows from sharp reductions in incomes and assets.