A non-exclusive list of interesting graphs from 2015
With 2015 about to end, it’s worth taking a look back at some of the year’s most interesting graphs. Check them out below.
1. Strong wage growth has yet to show up
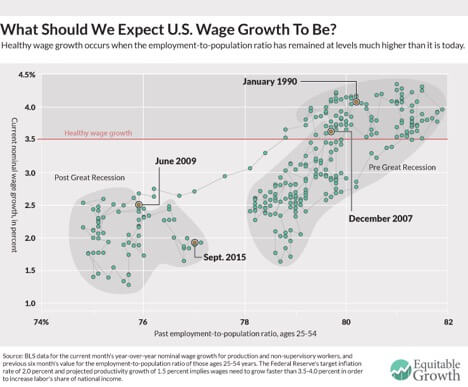
While the U.S. unemployment rate has reached 5 percent, wage growth hasn’t accelerated. Previous experience shows more workers need to be employed before we get healthy wage growth.
2. The collapse of the U.S. job ladder
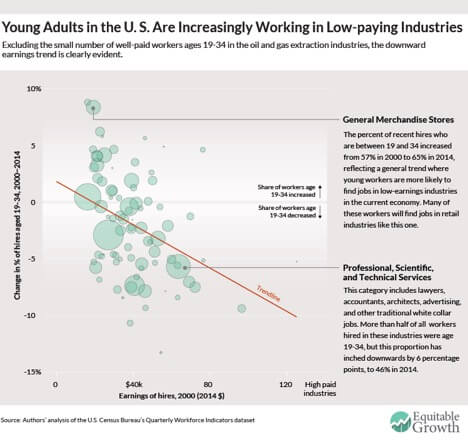
The job ladder has been a key way that workers get raises, as they move up to higher-paying jobs. But the job ladder in the United States seems to have collapsed in the 21st century.
3. The decline in U.S. business investment
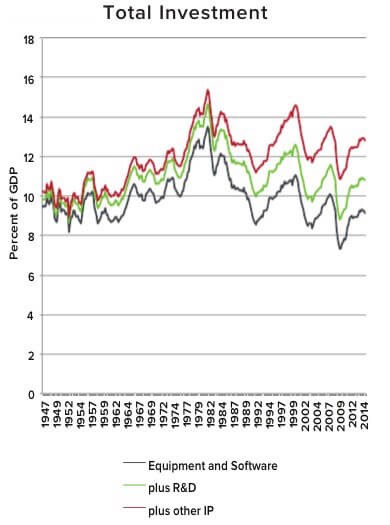
(original graph from the Roosevelt Institute)
While U.S. investment growth has been weak during the current economic recovery, the weakness is actually a longer-term phenomenon.
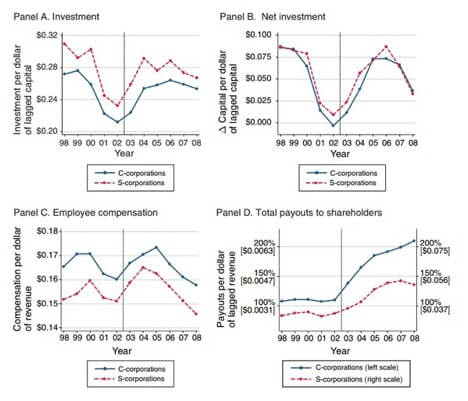
(original graphs from the American Economic Review)
Furthermore, the 2003 dividend tax cut was sold as a way to boost U.S. investment. But we should be skeptical that it did anything of the sort.
4. The relationship between “rents” and inequality
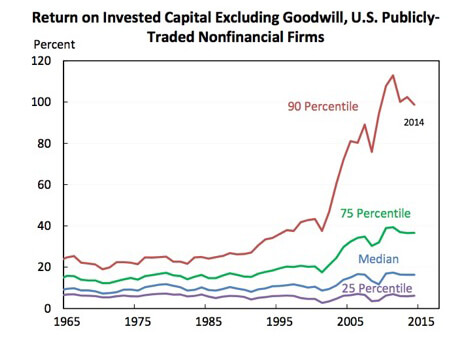
(original graph from the Council of Economic Advisers)
The role of economic rents—excess returns to an economic actor—is an increasingly popular topic of conversation when it comes to economic inequality. The extraordinary returns some firms have seen is a sign of the importance of rents.
5. The Fed’s 2 percent inflation “target”
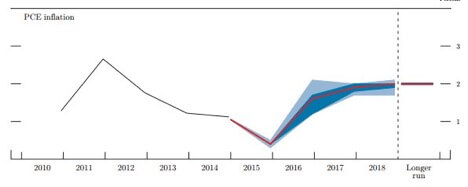
(original graph from the Federal Reserve)
As the Federal Reserve recently raised interest rates for the first time in almost a decade, it sees inflation running below its target for the next three years.
6. The decrease in long-term interest rates
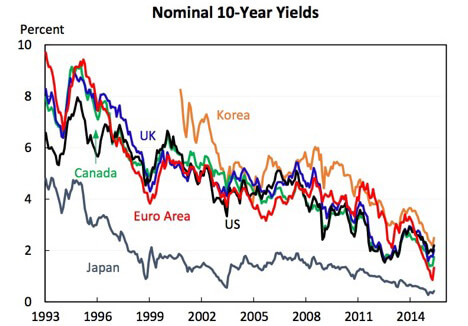
(original graph from the Council of Economic Advisers)
While short-term interest rates may be on the upswing, long-term interest rates have been falling for a while. And they seem set to be that way for a while.
7. The relationship between income and student loan delinquency
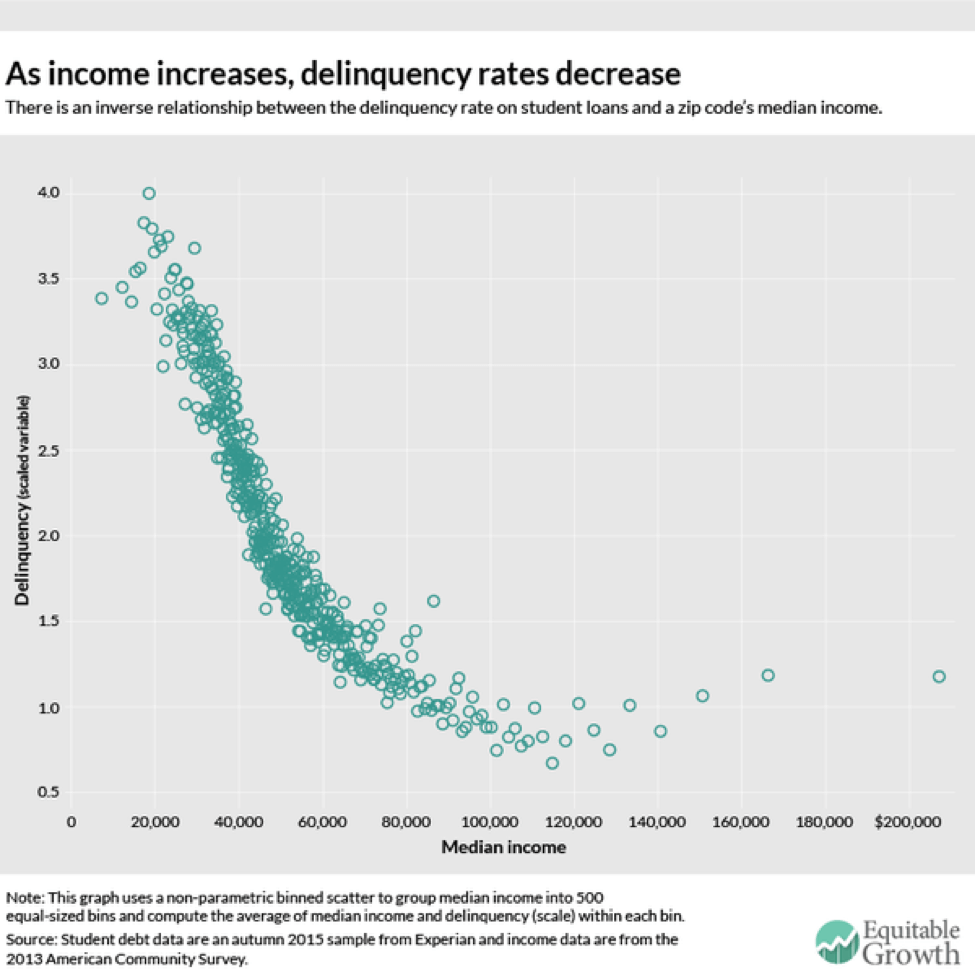
The massive increase in student loan debt across the United States has triggered concerns that borrowers with huge debt burdens will default. But borrowers with small balances are actually the most likely to default.