A kink in the Phillips curve
Janet Yellen by Jessica Hill, apimages.com
At the beginning of your first course on economics, the entire field can seem like an exercise in drawing curves on a board and explaining why they slope up or down. Economics is far more complex than that, of course, but the many important curves in the literature give that initial impression some glint of truth. Consider the fact that policymakers at the Federal Reserve are currently having a debate about the future of monetary policy that hinges on the interpretation of one of these lines: the Phillips curve. The debate, insomuch that it’ll affect policy, could determine when the central bank raises interest rates, and signals what the Fed thinks about the future of the labor market.
At The New York Times’s The Upshot, Neil Irwin clearly lays out the context for the current debate about the Phillips curve. First noted in British data by economist William Phillips of New Zealand, the curve depicts the relationship between the unemployment rate and the rate of inflation. It’s been replicated using different data sets over the years, but the number of variations has been astounding.
The issue, however, seems to be that the curve has broken in recent years—there’s not a strong relationship between inflation and the unemployment rate. While the unemployment rate is hitting levels close to the Federal Reserve’s estimate of its long-run level, inflation isn’t close to the Federal Reserve’s target of 2 percent over time. In fact, inflation almost looks like it’s trending down.
Yet this isn’t the first time we’ve had reason to question the curve. Members of the Federal Reserve strongly relied on the Phillips curve back in the 1970s—in fact, they may have been too reliant upon it. The seemingly static relationship between inflation and the unemployment rate led policymakers to think that they could push down unemployment without concerns about inflation jumping up. But inflation did jump up. What the Fed didn’t account for was the possibility that people in the economy would come to change their expectations about inflation. As policymakers did more to reduce unemployment, people kept shifting up their expectations of what would happen to inflation. The result was accelerating inflation, and an understanding within economics that policymakers need to account for inflation expectations.
That’s why Fed Chair Janet Yellen cited the expectations-augmented Phillips curve in her speech about inflation last month. Looking at the curve, Yellen expects inflation to soon hit the Federal Reserve’s 2 percent target. But that’s the debate at the Fed right now: whether the Phillips curve currently makes sense for policymaking. Lael Brainard and Daniel Tarullo, both members of the Board of Governors of the Federal Reserve, disagree with Yellen on the usefulness of the curve. In their view, inflation has far from tracked the fall in the unemployment rate.
To understand the changes in the overall inflation Phillips curve, it might be useful to look at another version of the curve: the relationship between unemployment and “wage inflation,” better known as wage growth. Now, that curve doesn’t look that great either, but that might be because the unemployment rate is currently overstating the health of the labor market. If we take a look at the relationship between wage growth and another measure of labor market slack, however, the relationship might hold up. Take a look at Figure 1:
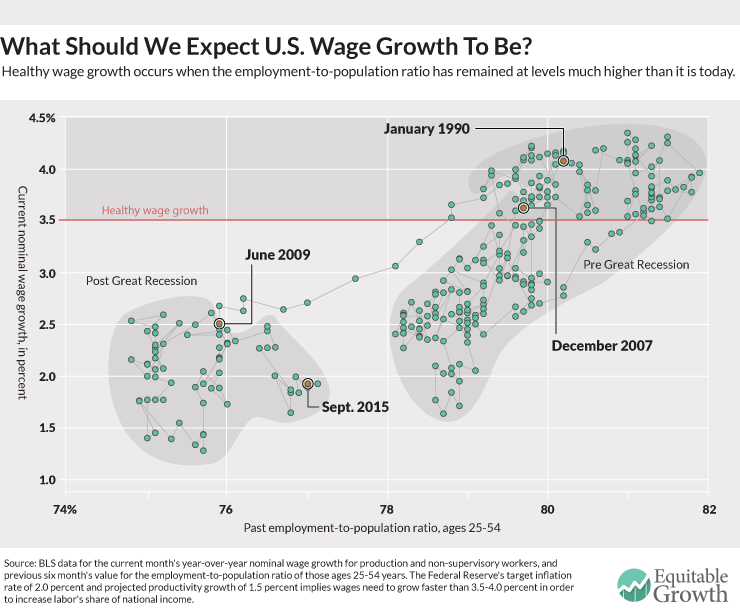 The graph shows the relationship between wage growth for production and non-supervisory workers, and the employment rate for prime-age workers six months prior. It clearly shows that when the labor market is tighter (when the employment rate is higher), wage growth is stronger.
In other words, the underlying idea of the wage Phillips curve still stands. It’s just a matter of using measures that fit the time.
As Matt Phillips (no relation to William presumably) points out in his Quartz piece on the curve, the labor market has changed quite a bit since the mid-1970s. He points specifically to the decline in the unionization rate, which is a sign of the decreasing bargaining power of labor in the economy. A 5 percent unemployment rate when labor is relatively much stronger, for example, is very different from a 5 percent unemployment rate when labor is on the back of its heels. Changes in the labor market might be a reason why increases in wages and salaries don’t pass through to overall inflation as much as we might have thought. Back when labor had more bargaining power, wage hikes would bite more into profits and therefore spur companies to raise prices. Now companies have more of a cushion, so a similar wage increase won’t necessarily lead to as strong of a price increase.
Context appears to very much matter. Policymakers will always need to create rules of thumb to help them make sense of an incredibly complex economy. But those rules need to be updated as the world changes.