Fall 2015 Brookings Panel on Economic Activity Weblogging: House and Tesar on Greece

Fall 2015 BPEA 1:00 PM Th: I read House and Tesar. They say that attempting a 4%-point increase in government revenue as a share of GDP in Greece may well push you over the top of the Laffer curve:

We consider spending reductions or tax increases sufficient to generate an average flow increase in the primary balance of one percent of 2014 GDP… a quarter of the repayment required to fully meet the stream of debt payments…. We do not push the model to generate the full 4 percent increase in the primary balance as a share of 2014 GDP…. Policy shifts that satisfy (or attempt to satisfy) the full 4 percent increase could push capital and labor taxes into the downward sloping portions of the Laffer curve…

Does it not follow immediately that the excess burdens of a 1%-point increase are overwhelmingly large? It then follows that any tax increases at all are inadvisable. Thus the only policies that might possibly be advisable are those that cut spending.

Thus, if I were to set out to write House and Tesar’s paper, it would consist of that one paragraph–that Greece is near the top of the Laffer Curve, hence what it urgently does not need is any tax increases.

Then would come fifteen pages documenting this claim on which all else depends: that Greece is near the top of the Laffer Curve. Yet those fifteen pages are missing. Instead, we have fifteen pages confirming that when you are near the top of the Laffer Curve raising taxes for any purpose is a really bad idea.

Do we think Greece is near the top of the Laffer Curve? Why do we think that Greece is near the top of the Laffer Curve?

The intellectual history of the minimum wage and overtime

The rapid growth of the “Fight for $15” minimum wage movement and President Barack Obama’s changes to overtime regulations have sparked new rounds of debate over the economic consequences of an increased overtime pay threshold and a higher minimum wage. Advocates of overtime and wage hikes argue these policies protect workers from exploitation and improve job quality. Opponents insist these regulations will hurt workers in the long run, as they will inflict a burden on companies that will be forced to cut jobs. These concerns are nothing new—this debate dates back to the early 20th century, before the minimum wage even existed in the United States and when overtime pay was unheard of.

At the end of the 19th century, economists such as John Bates Clark preached that markets, if left to their own devices, would function at equilibrium levels with the best possible distribution of resources. Rapid industrialization created the Gilded Age of American wealth, and people credited the free market with their increased prosperity. But along with increasing growth, industrialization also sharpened economic inequalities and made certain groups particularly vulnerable to exploitation. Debates over hour and wage limits focused on which groups required labor protections and the best mechanisms for protecting these groups.

Download File
History of the Minimum Wage

Read the full PDF in your browser

Labor regulations began in the 1890s as state-level maximum hour and minimum wage protections, which the U.S. Supreme Court repeatedly struck down. Federal standards were not created until four decades later, when president Franklin Delano Roosevelt and his Secretary of Labor, Frances Perkins, guided the Federal Labor Standards Act into law. (See Figure 1). This issue brief details the arguments that shaped hour and wage limits in the early 20th century.

Figure 1

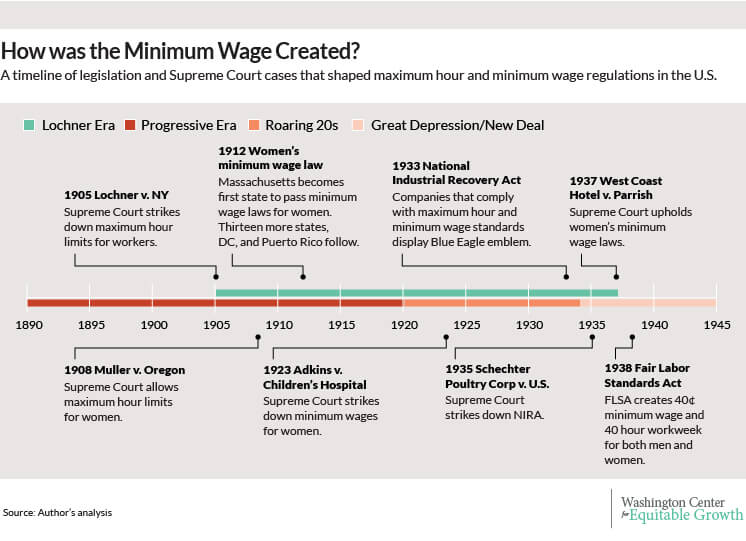
Women’s maximum hours

U.S. legal historians usually describe the beginning of the 20th century as the “Lochner Era,” a 32-year period characterized by the Supreme Court’s attempt to protect the free market through its constant repeal of labor laws. The Supreme Court actually was discriminatory in its protection of the free market—although it consistently blocked labor laws that applied to men, the high court allowed restrictions on women’s employment. The Supreme Court passed distinct rulings for men and women by emphasizing different doctrines for the two sexes. For men, the court consistently upheld freedom of contract; for women, the court privileged police powers.

The Supreme Court’s gender discrimination began with cases concerning maximum hour limits. In Lochner v New York (1905), the namesake of the Lochner Era, the court justified its decision to strike down the 1895 Bakeshop Act—which placed hour limits on New York bakers—with the freedom of contract doctrine. Freedom of contract comes from the due process clause of the Constitution, which says that no person shall be “deprived of life, liberty, or property without due process of law.” At the time, justices interpreted due process to mean that individuals should be free from restraint except to guarantee the same freedoms to others, and that government could not restrict people’s ability to acquire future property. Limiting the hours that New York bakers worked, proponents argued, took away their liberty to choose the terms of their employment and limited the money they could earn, so maximum hour laws violated freedom of contract.

Just three years later, the Supreme Court set a different standard for women. In Muller v Oregon (1908), it upheld a 1903 Oregon law that prohibited women from working more than 10 hours a day. The court argued that women’s freedom to contract was superseded by the police powers doctrine, which allows government regulation for the purpose of promoting health, safety, morality, and the general welfare of the public. The court found that “as healthy mothers are essential to vigorous offspring, the physical wellbeing of woman is an object of public interest.” In other words, protecting women’s reproductive health was more important than respecting their freedom to contract. Women were also seen as fragile, vulnerable, and lacking the skills necessary to effectively bargain for wages and working conditions, and therefore unable to exercise their freedom of contract. These sex-specific discussions about government-imposed hour limits set the stage for a new conversation: the passage of state minimum wages.

Women’s minimum wages

In 1912, Massachusetts became the first state to pass a minimum wage law that applied only to women and children. Thirteen more states (along with DC and Puerto Rico) followed in the next 11 years. These legislatures passed a patchwork of legislation with a range of wage limits and enforcement mechanisms. States such as Massachusetts created wage commissions to determine industry-specific minimum wages and enforced standards through public shaming, publishing the names of companies that did not comply with the regulations. In contrast, states such as Arkansas set two cross-industry minimum wages for women: experienced women were paid $1.25 a day while inexperienced women only got $1.

The police powers doctrine justified minimum wages for women, but said nothing about how they affected industries. To justify minimum wages on the industry side, academics used the parasitic industries argument. Originally developed by the British economists Beatrice and Sidney Webbs in the late 19th and early 20th centuries, the parasitic industries argument says that businesses who focused on short-term profit maximization instead of long-term efficiency tend to pay workers unlivable wages. Workers receiving these sweatshop wages become a burden to society, since they have to rely on charity or other family members for subsistence. To fix the problem, companies have to either amend their practices to consider the long-term welfare of the company and the workers, or exit the market.

Women’s minimum wage laws grew out of gender norms supporting women’s protection, but at the same time, racial biases led to laws that neglected women of color. Because minimum wage legislation was usually industry-specific, industries such as domestic work, agriculture, retail, and laundry—all dominated by African American workers—were often excluded from regulation. One case in point: The Wage Board in the District of Columbia set a weekly rate for laundry workers that was $1 lower than the across-the-board minimum adequate weekly wage of $16 it has previously chosen. The board explained that since 90 percent of laundry workers were African American, “the lower rate was due to a crystallization by the conference of the popular belief that it cost colored people less to live than white.” By not extending equal minimum wage protections to African American women, minimum wage laws reinforced their lower economic status.

In the next decade, legal changes in women’s status, paired with the economic optimism of the Roaring Twenties, brought a big shift in minimum wage legislation. Ratified in 1920, the 19th Amendment granted Women’s Suffrage. Shortly after, in a victory for more equal gender standards but a loss for labor protections, the Supreme Court issued a ruling that struck down women’s minimum wage laws across the country. In Adkins v Children’s Hospital (1923), the court overturned the 1918 law that created D.C.’s Wage Board, which had set minimum wages for women employed in laundries and food-serving establishments. Reasoning that women were now politically empowered to advocate for themselves in the free market, the Court privileged freedom of contract over police powers and nullified minimum wage laws in the United States.

This optimism about the competitiveness of the free market did not last long. Once the Great Depression hit, people lost faith in the fairness of the U.S. economy. The failure of the banks cultivated distrust of large corporations. People were afraid that business concentration hurt competition and created unfair trusts. The new popular economic narrative of economists such as Joan Robinson and Edward Chamberlain said that imperfect and monopolistic competition dominated the market. This unfair competition gave businesses a huge advantage, which they used to exploit labor. Public opinion shifted toward seeing government intervention not as redistribution but rather as reestablishing a competitive market.

The Fair Labor Standards Act

In this rapidly shifting political and economic climate Franklin D. Roosevelt won the 1932 elections and appointed Frances Perkins as his Secretary of Labor. With decades of experience advocating for labor rights as a social worker and later as Roosevelt’s Secretary of Labor when the future president was governor of New York, Perkins accepted the federal cabinet office on the condition that Roosevelt would commit to supporting her reform platform, which included hour limits and minimum wages for both women and men. Perkins’ platform originally appeared in the National Industrial Recovery Act, which tried to improve working conditions through voluntary industrial participation. Under the proposed law, industries would be able to form alliances, which previously violated anti-trust laws, if they complied with maximum hour and minimum wage standards. In return, participating companies could display a Blue Eagle emblem in their stores, brandishing their patriotism and commitment to post-Great Depression recovery. In Schechter Poultry Corp. v United States (1935), however, the Supreme Court struck down the law, drawing the ire of Roosevelt and forcing Perkins to find a new way to pass labor reform.

Out of growing frustration with the Supreme Court’s challenges to his policies, Roosevelt came up with a plan to pack the court. He set off a campaign to reform the Supreme Court so he could appoint additional members to the court who would vote in line with his New Deal reforms. Faced with this existential threat and greater public support for labor laws, in 1937 the Supreme Court ruled in favor of Washington state’s minimum wage law for women in West Coast Hotel Co. v Parrish. The court’s ruling de-emphasized the freedom of contract, reversing its 1923 decision and opening the door for future minimum wage legislation.

Following the Supreme Court decision, Perkins and Roosevelt sent a maximum hour and minimum wage bill to Congress. The original draft of the bill had called for industry-specific, regionally variant minimum wages to account for regional differences in prices and cost of living. As the bill made its way through Congress, two more opposition groups emerged: unions and northern industries. Unions feared that government-imposed wage and hour restrictions would undermine their influence in collective bargaining. Northern industries opposed regionally specific wages for fear that industries would follow the cheap labor south. To appease these two groups, Roosevelt and his Democratic allies in Congress tweaked the bill to make it more popular. Roosevelt appeased the unionists’ fears in his State of the Union address by emphasizing that more desirable wages should continue to be the responsibility of collective bargaining. Lawmakers suggested a national minimum wage to satisfy northerners, but set the wage low enough to appease southerners.

In its final form, the Fair Labor Standards Act of 1938 mandated a 44-hour workweek, scheduled to decrease to 40 hours in three years, with time-and-a-half overtime wages. The new law also created a minimum wage of 25 cents an hour, set to increase by 5 cents a year to reach 40 cents an hour by 1945. The original law was not universal. It included exemptions for agricultural, domestic, and some union-covered industries—once again, mostly industries dominated by African Americans. Since the law lacked a mechanism for automatically increasing wages beyond 1945, it has been updated over the decades to increase wages and broaden industry (and racial) coverage. In the most recent revision to the Fair Labor Standards Act in 2009, the federal minimum wage was increased to $7.25 an hour.

Conclusion

The intellectual history of maximum hours and minimum wages is a story of debates over which groups should be protected from exploitation and what form this protection should take. Concerns over women’s health, ambivalence toward African American rights, and advocating for unorganized workers dominated the debate at different points. As social views changed, so did economic policies. Today, women account for two-thirds of minimum wage earners and people of color account for two-fifths. Studying the history of the minimum wage should compel policymakers to question how social priorities influence different groups, who is considered worthy of protection, and to what extent their welfare is considered. By implementing effective maximum hour and minimum wage regulations, policymakers can protect vulnerable workers’ standard of living to encourage productivity, push companies to increase their efficiency, and consequently cultivate long-term equitable growth.

-Oya Aktas is a Summer 2015 intern for the Washington Center for Equitable Growth 


Pre-k national demo

A snapshot of the long-term impacts of universal prekindergarten

If the United States were to invest in a public, voluntary, high-quality universal prekindergarten program starting in 2016, what would its impacts be over time? Toggle between the buttons to visualize the different impacts of universal prekindergarten programs across the U.S. or click on a state to learn more about the program in that state.


image/svg+xml

This study looks to quantify the long-term benefits and costs of investing in a high-quality universal prekindergarten available to all three- and four-year olds across the United States. But before delving into the report, use the interactives below to explore how a universal prekindergarten would affect the nation or even your state.

Who would participate?

Currently, across the United States, only 17 percent of three- and four-year-olds (1,336,695 children) participate in state-sponsored prekindergarten, and another 38 percent attend Head Start or private preschool. Unfortunately, the quality of these programs varies significantly across and even within states, which means that preschoolers do not always experience the same benefits or long-term effects. If a universal program were enacted and fully phased in by 2017, 86 percent of three- and four-year-olds (6,960,916 children) would be enrolled in prekindergarten, benefiting from a high-quality early childhood education.

What are the benefits?

Research has established that high-quality prekindergarten education can generate significant long-run benefits for program participants, their families, and even other non-participants. For example, longitudinal studies have shown that, aside from improved educational achievement, children who have attended a prekindergarten program have spent less time in special education and had lower grade retention rates. Program participants also experience less child maltreatment and reduced crime, smoking, and depression rates. In addition, both participants and their parents have higher projected earnings, which subsequently increases government tax revenue.

If a universal prekindergarten program were to start in 2016, by 2050, there would be over $304 billion in total benefits for the U.S. In 2050, that amounts to savings of $748.51 per capita. How do these total benefits break down? $200.41 per person is attributed to savings to government, $281.81 per person comes from increased compensation, and $266.27 is accounted for by savings to each individual from better health and less crime.

What are the costs?

Currently, the U.S. spends an average of $45 per capita per year on preschool programs, special education services, and Head Start. In 2017, when a universal prekindergarten program is fully phased in, it would take an investment of $79 more per capita per year to maintain a high-quality prekindergarten program.

There are three main costs associated with a high-quality universal prekindergarten program: the cost of the program, increased high school attendance, and increased college attendance. The program itself is based on Chicago’s comprehensive high-quality Child Parent Center half day program, and thus, the costs take into account the multitude of services that are provided at the Child Parent Center offset by the current spending on similar early childhood education programs as to not double count expenditures. Because studies have shown that students who attend prekindergarten have higher high school completion rates and are more likely to attend college, these usage costs are also factored into the total cost of a universal prekindergarten program.

In 2050, these costs add up to $35 billion, or $84.54 per capita. $74.27 per capita is attributed to program costs, $2.35 comes from increased high school usage per person, and the remaining $7.92 per person is accounted for by increased college attendance.

How do the benefits compare to the costs?

If a high-quality universal prekindergarten program were to start in 2016 and be fully phased in by the end of 2017, the program would require $26 billion in additional taxpayer dollars. Over time, the cost would eventually grow to include the cost of additional high school and college usage. But in just 8 years, by 2024, the benefits of the program would outstrip the costs. By 2050, there would be more than $304 billion in total benefits compared to merely $35 billion in total costs, yielding net benefits of $270 billion. By 2050, for every dollar invested in a universal program, there would be $8.9 in returns.

How do the impacts compare across states?

Must-Read: Josh Bivens and Lawrence Mishel: The Divergence Between Productivity and a Typical Worker’s Pay: Why It Matters and Why It’s Real

Must-Read: Josh Bivens and Lawrence Mishel: The Divergence Between Productivity and a Typical Worker’s Pay: Why It Matters and Why It’s Real: ”Our work has been widely cited…

…It has also attracted criticisms from those looking to deny the facts of inequality…. The data series and methods we use to construct our graph of the growing gap between productivity and typical worker pay best capture how income generated in an average hour of work in the U.S. economy has not trickled down to raise hourly pay for typical workers…. There are three important “wedges”… an overall shift in how much of the income in the economy is received by workers… the growing inequality [within] compensation… faster price growth of things workers buy relative to the price of what they produce….

Over the entire 1973 to 2014 period, over half (58.9 percent) of the growth of the productivity–median compensation gap was due to increased compensation inequality and about a tenth (11.5 percent) was due to a loss in labor’s income share. Less than a third (29.6 percent) of the gap was driven by price differences…. Gains to owners of capital and the improved bargaining position of capital owners are not adequately captured by this analysis of the wedges between productivity and median compensation… a wedge between pay and productivity caused by the improved bargaining position of capital owners… would likely be larger than the wedge made up of the loss of labor’s share of income in net domestic product…

S1 epi org files 2015 understanding productivity pay divergence final pdf S1 epi org files 2015 understanding productivity pay divergence final pdf S1 epi org files 2015 understanding productivity pay divergence final pdf

Must-Read: Dani Rodrik: Economists vs. Economics

Must-Read: As I see it, John Maynard Keynes was right when he wrote that “good, or even competent, economists are the rarest of birds. An easy subject, at which very few excel!” The problem is that a good economist needs to be able to:

  1. Be willing to do their homework in learning about both the economic literature and the world.
  2. Assess and understand the classes of models that are good candidates to use in understanding a particular situation.
  3. Reach a judgment on which of those models is the one that best applies.
  4. Understand how the model works.
  5. Communicate (1), (2), and (3) to the world.

Dani Rodrik: Economists vs. Economics: “Navigating among economic models–choosing which one will work better…

…is considerably more difficult than choosing the right map. Practitioners use a variety of formal and informal empirical methods with varying skill. And, in my forthcoming book Economics Rules, I criticize economics training for not properly equipping students for the empirical diagnostics that the discipline requires. But the profession’s internal critics are wrong to claim that the discipline has gone wrong because economists have yet to reach consensus on the ‘correct’ models (their preferred ones of course). Let us cherish economics in all its diversity–rational and behavioral, Keynesian and Classical, first-best and second-best, orthodox and heterodox–and devote our energy to becoming wiser at picking which framework to apply when.

The pace of productivity growth and misallocation in the United States

Productivity is a term bandied about by academics, policymakers, and pundits alike, yet most of us aren’t sure what it means—even though we know it when we see it. In common day usage, the term evokes images of workers diligently typing away at desks or laboring hard on the factory floor, as well as annual performance evaluations by the boss. These everyday views of productivity are accurate yet at best ephemeral and at worse confusing—especially when trying to sort out how productivity relates to overall economic growth in the United States.

But for economists focused on economic growth, productivity is the Holy Grail. It’s the source of long-run economic growth and steady wage gains for workers. And that’s why, in the wake of the Great Recession, there are fears that productivity’s best days are behind us. Has productivity growth declined? And if so, what’s the reason? Answering these questions requires a clear understanding of what we mean when we talk about productivity.

First, there is what economists call total factor productivity. This measurement of productivity originated in spirit, if not name, from the research of Nobel Laureate Robert Solow on long-run economic growth. Solow, now Professor Emeritus at the Massachusetts Institute of Technology (and a member of our steering committee), was trying to figure out how much increased savings in an economy could increase the pace of long-run economic growth. He found that savings don’t do much at all.

Solow parceled out the sources of growth to increases in the labor force (population growth), increases in capital (savings), and a residual term that captured all the unexplained part of growth. His calculations showed that this residual was the main driver of long-run economic growth. Faster population growth or higher savings might boost growth in the short term, but then per-capita growth would return its old rate. Only increases in Solow’s residual seem to increase the pace of long-run economic growth.

This residual is often called “technology,” but it’s also known as total factor productivity. The concept started out explaining output growth for countries, but it can be used to describe the performance of smaller economies such as cities or even individual firms. Total factor productivity tries to figure out how well a country, city, or firm combines capital and labor to create output. Whether changes in this efficiency of output come from technology, management practices, culture, or some other factor is a matter that economists fiercely debate. To put this back in the context of the Solow model, understanding what increases TFP growth is the same as understanding what’ll boost output per capita growth.

But, if you try to look up U.S. government statistics on productivity, you’ll likely find data on labor productivity. Labor productivity is what it sounds like—a measure of how productive labor is. More specifically, it shows how much output is created for every hour of work done by a laborer. Take the amount of output produced, divide it by the number of worker hours it took to create the output, and the resulting number is your labor productivity. Importantly, though, labor productivity also is derived from total factor productivity. Take the growth in total factor productivity, add the increase in the capital workers can use from investments and account for changes in the kinds of workers in the labor force (including increases in educational levels and demographic changes), and you have the increase in labor productivity.

A debate about the source of long-run economic growth and wage growth would be important in any context. But it is especially relevant today given the slowdown in productivity growth over the past decade compared to growth levels seen before a burst in productivity growth in the late 1990s and early 2000s. Since 2003, labor productivity has slowed considerably from its pace during that period and compared to earlier periods in the postwar era. According to data compiled by John Fernald, an economist at the Federal Reserve Bank of San Francisco, trends in labor productivity look something like this:

  • 1948 to 1973—grew at an annual average of 3.3 percent
  • 1973 to 1995—growth declined to an annual average of 1.48 percent
  • 1995 to 2003—growth bounced back to an annual average of 3.38 percent
  • 2003 to 2007—growth slowed again to an annual average of 1.57 percent
  • 2007 to 2013—growth increased only slightly to an annual average of 1.83 percent


Why these wide swings in labor productivity? A look at total factor productivity growth provides some clues. Here are the trends in total factor productivity over the same periods:

  • 1948 to 1973—grew at an annual average of 2.15 percent
  • 1973 to 1995—growth declined to annual average rate of 0.47 percent
  • 1995 to 2003—growth improved to an annual average of 1.81 percent
  • 2003 to 2007—growth declined to an annual average of 0.71 percent
  • 2007 to 2013—growth improved marginally to an annual average 0.75 percent


Other contributors to labor productivity mostly increased over these periods. Due in part to rising education levels, growth in what Fernald calls “labor quality”  went from 0.27 percent in 1948-1973 to 0.43 percent in 1973-1995.  Labor quality growth ticked down just a bit during the 1995 to 2003 period to 0.40 percent and fell quite a bit more, to 0.24 percent, during the 2003 to 2007 period. It has since jumped up to 0.59 percent in the 2007 to 2013 period.

Similarly, more capital was a contributor to the increase in labor productivity growth, with the growth rate of capital deepening rising from 0.57 percent in the 1973 to 1995 period to 1.17 percent annually from 1995 to 2003. It’s fallen since then, averaging 0.61 percent during the 2003 to 2007 period and falling again to 0.49 percent during 2007 to 2013.  (See Figure 1.)

Figure 1

091015-productivity-01

As these data show, we really can’t blame the slowdown in labor productivity specifically on declines in capital accumulation, investment rates, or a deterioration in labor quality. According to Fernald’s decomposition, something else happened that caused a decline in the underlying pace of total factor productivity. What exactly could be the cause of this decline?

A recent working paper by Stanford University economist Charles Jones is helpful for thinking about this conundrum. Jones splits up total factor productivity into two factors. The first is the contribution of technology or knowledge to the pace of economic growth. Call it the stock of human knowledge. The second factor is far more nebulous. Jones calls it “M.” He’s very upfront about the fact that “M” could very well could stand for “measure of our ignorance” about the sources of growth. Jones does venture that given new research on productivity, that “M” might also be called “misallocation.”

Misallocation stories about productivity are less about the need to spur new innovations and more about understanding that many firms and individuals are already quite productive or have the ability to be more productivity if put in the right situation Jones highlights one paper that shows how women and people of color’s entrance into higher-skill occupations provided a significant boost to economic growth. That’s a matter of the misallocation of society’s workforce. The same phenomenon is evident in another study that shows the potential gains from allowing more workers to live in high-productivity cities.

There’s a similar story when it comes to firms. Research from the Organisation for Economic Co-operation and Development shows that there are firms operating among its 34 developed and rapidly development member nations that have quite high total factor productivity growth. The problem is that the insights and innovations from those firms haven’t spread to the rest of the firms.

What’s broken that transmission mechanism from these vanguard firms to the rest of the population? The decline in the rate of new business formation could be a likely candidate. If fewer innovative start-up firms are being created, then it makes sense that it would take longer for new ideas about how to run companies to diffuse throughout these economies. In the United States, the rate at which new firms enter the economy has been on the decline since the late 1970s.

But what explains the slowdown in the start-up rate? That isn’t clear, but some research by economists Ian Hathaway of Ennsyte Economics and Robert E. Litan at The Brookings Institution indicates that the slowdown in population growth and an increase in business consolidation could be the culprits. One of the reasons the number of public companies is on the decline in the United States is because of increasing mergers and acquisitions activity.

Since the late 1970s, overall productivity gains haven’t translated into broadly shared gains for the entire workforce as compensation inequality has increased. And since 2000, the gains from productivity across the U.S. economy are accumulating more and more toward the owners of capital instead of compensation for workers, as the labor share of income has been on the decline. Possible links between less equitable economic growth and declining productivity growth need to be explored because the pace of productivity growth sets the bound for how much standards of living can rise.

Must-Read: Lawrence Summers: Why the Fed Must Stand Still on Rates

Must-Read: What is the technocratic economic–not the “the unemployment rate is normalizing so the interest rate should be normalized too” argument? For a person to be lying in a bed 24/7 is not normal. But if they have a broken leg you don’t make them normal by making them get up and walk around.

Lawrence Summers: Why the Fed Must Stand Still on Rates: “The case against a rate increase has become somewhat more compelling even…

…than it looked two weeks ago…. First, markets have already done the work of tightening…. Second, the data flow suggests a slowing in the U.S. and global economies and reduced inflationary pressures…. Third, the case for concern about inflation breaking out is very weak. Market based expectations suggest that inflation over the next decade on the Fed’s preferred core pce basis is near record lows and well below 2 percent. The observation that 5 year inflation, 5 years from now is expected to be below target calls into question arguments that current low inflation is somehow transitory….

Fourth, arguments of the “one and done” variety or arguments that the Fed can safely raise rates by 25 BP as long as it’s clear that there is no commitment to a series of hikes are specious. If as some suggest a 25 BP increase won’t affect the economy much at all, what is the case for an increase? And when the same people argue that 25 BP will have little impact and that it is vital to get off the zero rate floor, my head spins a bit. In a highly uncertain world, the Fed cannot be both data dependent and predictable…. I understand the argument that zero rates are a sign of pathology…. The problem is that the case for hitting the brakes in an economy with sub-target inflation, employment and output is not there; regardless of whether the brakes are to going to be pressed hard or softly, singly or multiple times…. Policymakers who elevate credibility over responding to clear realities make grave errors….

Fifth, I believe that conventional wisdom substantially underestimates the risks…. Not a single post war recession was a predicted a year in advance…. If history teaches anything it is that financial interconnections are pervasive and not apparent till it’s too late…. Now is the time for the Fed to do what is often hardest for policymakers. Stand still.

Must-Read: Nate Silver: Stop Comparing Donald Trump And Bernie Sanders

Must-Read: Nate Silver calls out David Brooks and George Packer and Jonah Goldberg. May I say that the New York Times made a major mistake when it decided to let Nate Silver but not David Brooks go? And that the New Yorker would be well-advised to give Nate Silver George Packer’s inches?

Nate Silver: Stop Comparing Donald Trump And Bernie Sanders: “A lot [David Brooks] of people [Jonah Goldberg] are linking [George Packer] the candidacies of Bernie Sanders and Donald Trump…

…under headings like “populist” and “anti-establishment.” Most of these comparisons are too cute for their own good…. You can call both “outsiders.” But if you’re a Democrat, Sanders is your eccentric uncle…. Trump is as familial as the vacuum salesman knocking on your door…. Sanders is campaigning on substantive policy positions, and Trump is largely campaigning on the force of his personality…. Sanders is a career politician; Trump isn’t. Let’s not neglect this obvious one. Bernie Sanders has been in Congress since 1991, making him one of the most senior members of Congress; Trump has never officially run a political campaign before…. Sanders holds policy positions of a typical liberal Democrat; Trump’s are all over the place…. Sanders’s support divides fairly clearly along ideological and demographic lines; Trump’s doesn’t…. fight. Clinton’s position relative to Sanders is analogous to the one Al Gore held against Bill Bradley in the 2000 Democratic primary. Sanders’s campaign also has parallels to liberal stalwarts from Howard Dean to Eugene McCarthy; these candidates can have an impact on the race, but they usually don’t win the nomination…. Trump is engaged in an attempted “hostile takeover” of the Republican Party…

Noted for the Afternoon of September 9, 2015

Must- and Should-Reads:

Must-Read: Jason Furman: It Could Have Happened Here: The Policy Response That Helped Prevent a Second Great Depression

Must-Read: I used to think that Jason had this right. I am now worried he doesn’t. Barry Eichengreen keeps arguing that the memory of the lessons of the Great Depression was strong enough to halt the crash, but not strong enough to get policies adopted to spur the recovery. Thus, Barry argues, it may well be that–somewhat paradoxically–the fact that a second Great Depression was avoided in the short run may well mean that the longer-run consequence will be that 2007-9 will cast a larger and darker economic shadow on the future of the global economy than was the economic shadow cast by 1929-33.

Jason Furman: It Could Have Happened Here: The Policy Response That Helped Prevent a Second Great Depression: “The achievement of avoiding a second depression is not one to be minimized…

…The similarities between macroeconomic variables during the onset was in many respects worse than in 1929 and 1930, but the policy response and the resulting outcomes could not have been more different. As difficult as it was losing hundreds of thousands of jobs per month, the 20 percent-plus unemployment rates of the 1930s should not be forgotten. As United States–and global–economic policy shifts its focus from crisis response to continued structural reform, it will be important to learn from what has worked and what has not as we continue to encourage more, shared growth in the twenty-first century.