The U.S. labor market keeps beating projections

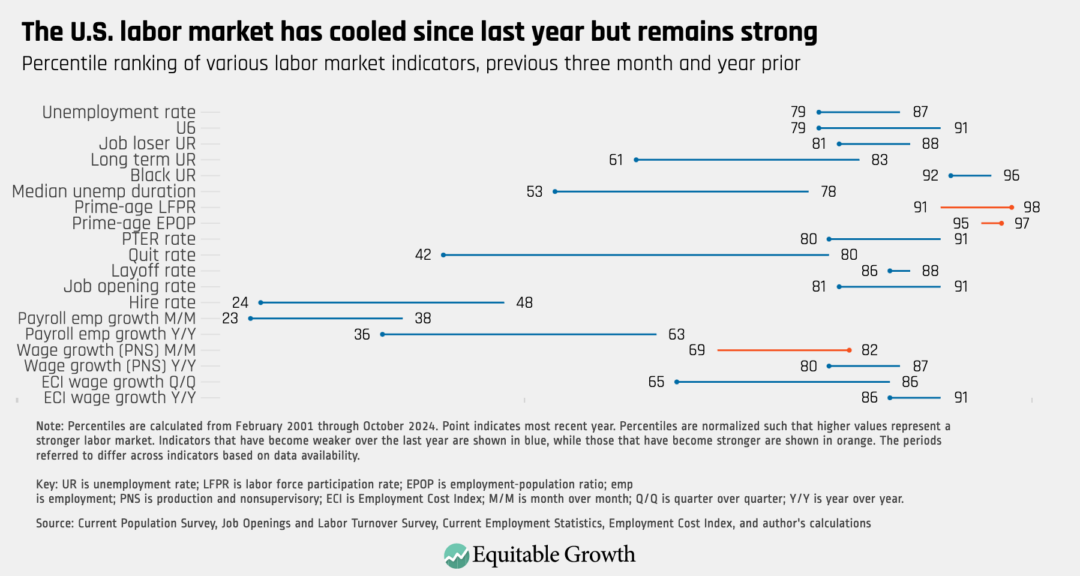
No single economic indicator fully describes the state of the U.S. labor market. Yet a range of commonly used measures, from the unemployment rate and the prime-age employment-population ratio to wage growth and the layoff rate, tells a consistent story of ongoing strength despite some cooling that has continued over the past year.
Data released last week show that many indicators remain stronger than the median levels observed since 2001, and some remain in the top 25 percent of values observed over that period or even higher. (See Figure 1.)
Figure 1

While some of the October indicators, including employment growth and labor force participation, may at least partially reflect temporary downward effects of recent hurricanes, these effects are likely to fade as we move past the immediate impact of those storms. A very similar picture emerges when using data that end in September.
These data are helpful for understanding where the U.S. labor market currently stands in historical context. Yet it is also useful to compare where the labor market is to where economic fundamentals and projections stand, especially considering the many significant and discrete policy changes and economic shocks in recent years.
Moreover, policymakers who want to make reasoned decisions face a difficult problem: They only get to see what follows from the choices they actually make in the circumstances they actually face. Incorporating what they see into future decision-making requires some understanding of what else could have happened, as does evaluating the performance of policymakers.
Looking at economic projections made by institutions such as the Congressional Budget Office at various points in time can help explore these economic roads not taken. Consider, for example, payroll employment. After a recession, it is common for commentators to note the point at which employment returns to its pre-recession level. Yet this overlooks the fact that employment likely would have been growing from that pre-recession level in the absence of the recession.
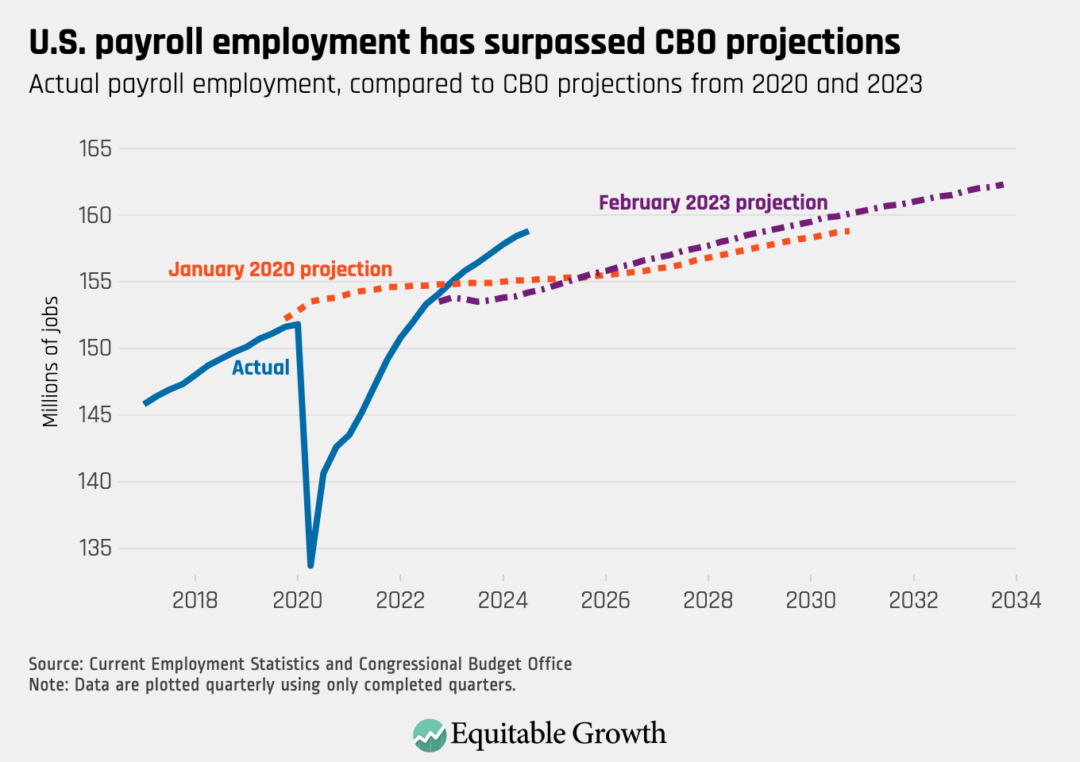
Following the COVID-19 recession, for example, we can see that U.S. employment returned to its pre-pandemic level of about 152 million in June 2022—faster than any recession since 1981. The Congressional Budget Office’s final pre-pandemic projection in January 2020 suggested employment would likely have grown to 155 million by that point. That projection also showed employment of about 155 million in the third quarter of 2024, when, in reality, employment reached nearly 159 million in that month. (See Figure 2.)
Figure 2

Interestingly, much of the gap between the current level of U.S. employment and the level that the Congressional Budget Office projected before the pandemic has emerged since the beginning of 2023. As seen in Figure 2, when CBO updated its projections in February 2023, actual U.S. employment was between the pre-pandemic level and the pre-pandemic projected value for the beginning of 2023. The updated CBO projection, which incorporated the full fiscal and monetary policy response to the COVID-19 pandemic and recession, showed employment growth slowing sharply (likely due to substantial monetary tightening over the preceding year), leading the level of projected employment to remain roughly flat for about a year or so before resuming modest growth. Instead, employment growth slowed only slightly, and employment was nearly 4.7 million jobs above the level projected for the third quarter of 2024.
One reason employment growth has been more robust than expected is that the labor force has grown more quickly than expected, especially since early 2023. The U.S. labor force participation rate has defied consistent projections that it would decline significantly.
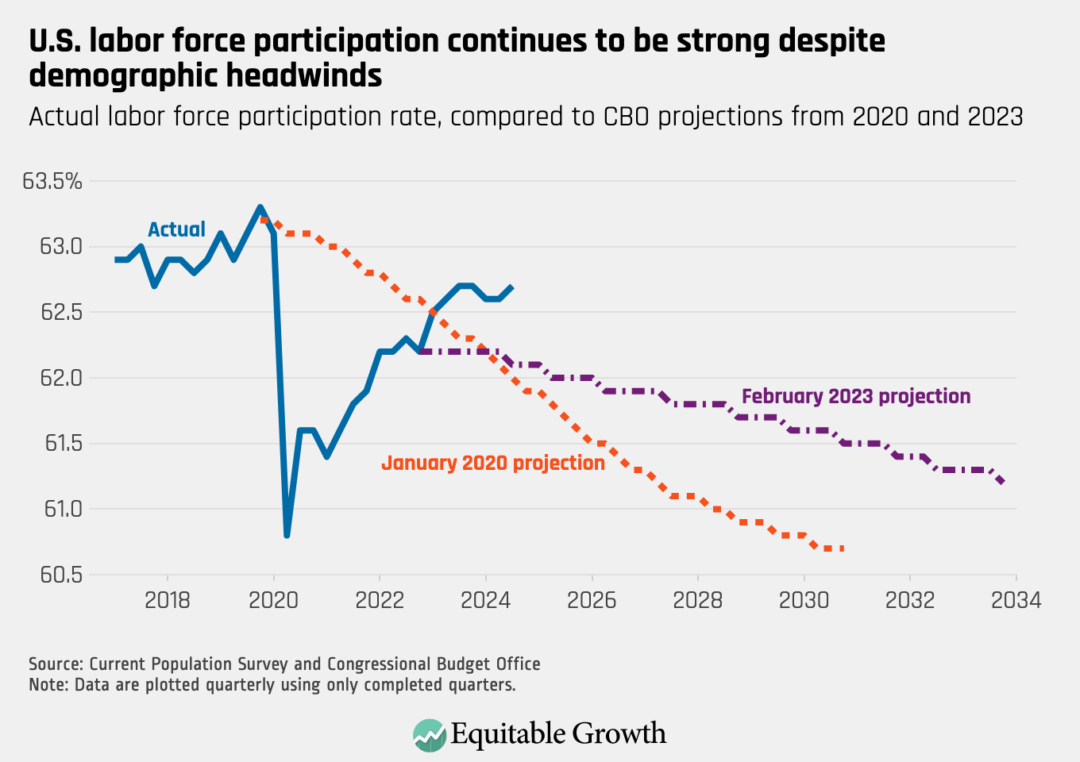
Those projections are not without foundation. Increasingly large numbers of baby boomers are reaching retirement age each year, putting significant downward pressure on labor force participation and leading pre-pandemic projections to expect that participation would have fallen by more than a full percentage point from its pre-pandemic level by now. (See Figure 3.)
Figure 3

Following the sharp decline at the onset of the pandemic, the large, complicated model that the Congressional Budget Office uses to produce its economic projections did expect labor force participation to rebound meaningfully but only partially, and the model has consistently predicted steady declines that have not been seen. Instead, the recovery in labor force participation post-pandemic has continued, and, at 62.7 percent in the third quarter of 2024, it was only 0.6 percentage points below its pre-pandemic level, despite significant demographic headwinds.
Increased labor force participation in the United States has largely been driven by so-called prime-age workers, or those between the ages of 25 and 54 who have stronger attachments to the labor force. Analysts also find that faster population growth due to increased immigration has contributed to growth in the U.S. labor force.
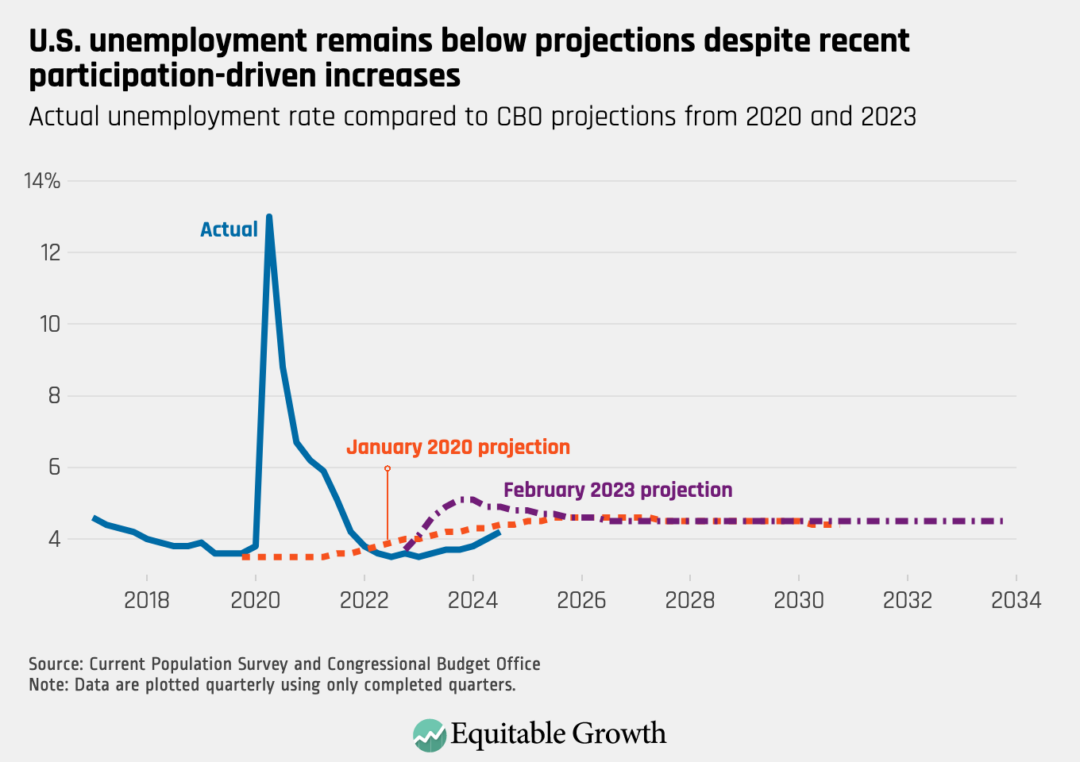
The labor force has, in fact, grown faster than employment, leading the unemployment rate to drift up beginning in early 2023. Despite that increase, however, it remained below the levels the Congressional Budget Office projected in both January 2020 and February 2023 for the third quarter of 2024, at 4.2 percent. (See Figure 4.)
Figure 4

At its current level, the unemployment rate is further from the 2023 projection than it is from the 2020 projection. In 2020, the Congressional Budget Office’s projections, which do not attempt to predict recessions or incorporate policy changes not already in effect, showed the unemployment rate vacillating around levels consistent with full employment for the next decade. In early 2023, however, CBO expected the unemployment rate to rise sharply, likely due to tight monetary policy, before declining gradually starting in early 2024.
While current labor market performance is strong in the context of recent history, it is remarkable in the context of what could have been. Surpassing repeated projections for worse labor market performance has concrete benefits for millions of people that mirror the costs inflicted on workers by the slow recovery from the Great Recession of 2007–2009.
While this column focuses on only a few labor market indicators, the fuller context is, if anything, more impressive. Faster employment growth was not supported by slow nominal wage growth or necessitated by slow productivity growth; those measures have also met or exceeded their projections, and signs point to another strong productivity estimate for the third quarter of 2024 and positive revisions in March 2025. While prices have also risen by more than the CBO projected at various stages, inflation-adjusted output and consumption measures have still beaten their projections as well.
Employment hysteresis from the great recession
September 26, 2017
The Congressional Budget Office issued its most recent economic projections in June 2024. While it is generally too early to assess the accuracy of those projections, we can compare them to previous vintages. To the extent that the June 2024 projections for measures discussed here differ from the February 2023 projections, it is generally in levels rather than trajectories. In other words, the most recent CBO projections essentially bank gains made relative to past projections on things such as employment, wages, and Gross Domestic Product, and predict that growth will proceed at similar rates from these higher levels.
While unexpected changes in economic policies or economic conditions—such as those that contributed to deviations from past projections—could certainly happen again, this pattern does not point to obvious obstacles to progressing toward the full employment labor market depicted in the out years of these projections: a soft landing, if we can keep it.
Did you find this content informative and engaging?
Get updates and stay in tune with U.S. economic inequality and growth!


