The ‘funny math’ of top U.S. tax rates

The current reconciliation bill now before Congress won’t correct for the low tax rates paid by the richest Americans
Overview
Calculating the effective tax rate of the richest Americans can be complicated, but it is critical for ensuring tax policy debates—such as the one currently raging in the U.S. Congress about massive new tax cuts that likely will favor the well-off—are well-informed. This complexity was exemplified during a 2024 Senate Finance Committee hearing on income taxation of high-income and high-wealth taxpayers. Then-committee chairman Sen. Ron Wyden (D-OR) called the Joint Committee on Taxation’s computation of a 34 percent overall federal tax rate for those in the top 0.01 percent income group “funny math” (and “junk math,” too, at one point).1
Sen. Wyden’s remarks were more than just a passing comment or political barb. One of the most knowledgeable U.S. senators on tax issues was referring to a fundamental calculation made by the stewards of federal tax legislation. We view the remarks as generally applying to two types of tax rates—the “special” JCT method that produced the 34 percent tax rate for the top 0.01 percent by using a comprehensive income denominator that was presented in the pamphlet for that hearing, and the standard JCT rate that uses cash-like income as the denominator, resulting in a federal tax rate of 28.7 percent for the top 0.1 percent income group in the pamphlet’s appendix (the numerators were the same, except the latter excluded the relatively small estate and gift tax).
This column is not about one funny tax rate as much as two applications that imply implausibly high tax rates for the very well-off:
- Funny math #1: The standard JCT distributional approach that relies on capital income voluntarily recognized on tax returns misses too much high-end income.
- Funny math #2: Neither the standard JCT approach nor its special method were extended to very top incomes, creating a tax rate void that can be misread.
We now break down these two approaches and compare them to other approaches taken by leading academics to demonstrate that Sen. Wyden’s “funny math” quip highlights the seriously inequitable tax rates paid by the wealthiest Americans.
Funny math #1: Defining income
Interpretation of U.S. tax rates is affected by two popular (and generally correct) intuitions. First, people—not corporations or other entities—pay the corporate income tax. Second, cash in hand generally is of more use than unrealized capital gains or undistributed corporate earnings, but noncash income (such as when a 401(k) or savings account grows) also is of value.
The standard income approach is used by the JCT staff to evaluate proposed policy changes, such as the tax bill now being considered. The committee’s standard method calculates tax rates with a denominator that is composed primarily of information from tax returns, including wages, pass-through business income, corporate dividends, and realized capital gains. This method—also used in some form by the Congressional Budget Office, the joint Brookings Institution-Urban Institute Tax Policy Center, and the U.S. Treasury Department—often is referred to as cash-based because of a focus on resources in hand, including capital gains realized by individuals, as well as dividends received from corporations.
In contrast, notional income, such as appreciation of stock in a 401(k) or owner-occupied housing, is not included in the denominator of the JCT standard tax rate.2
Because, in effect, people pay the corporate income tax, the Joint Committee’s cash-based approach makes an exception by allocating to shareholders a corporation’s tax payment (though not actually paid in cash by people) to the numerator of that individual’s tax rate, as well as an amount of pre-tax corporate earnings (though not actually received in cash by people) equal to the corporate tax payment to the denominator. So, if it is determined that a corporation pays $10 of corporate tax on your behalf, you are deemed also to have earned $10 of pre-tax income. (This tax “gross-up” is also used for employer payroll taxes, which are attributed to workers as both income earned and taxes paid.)
Why include this one kind of notional capital income but not others, such as post-tax corporate earnings that are not distributed (more than $1 trillion annually in the official aggregate economic statistics) or unrealized capital gains (the accumulation of which by high-wealth persons is estimated to exceed $13 trillion)?3 This inconsistency is especially problematic when calculating the tax rates of the wealthy, to whom a disproportionate amount of this other notional income accrues, rendering the JCT standard approach (as well as the cash-based methods used by other groups) ineffective in describing the tax rates of those at the very top of the income distribution.
Getting beyond cash
A more comprehensive income concept that includes a broader swath of notional income is needed to describe very well-off Americans. In this regard, a common approach includes all corporate earnings, whether retained, used to pay corporate tax, or paid out to individual shareholders by corporations as dividends, but omits realized capital gains to prevent double counting. The method also includes imputed rent from homeownership and takes account of economic depreciation4 of capital assets.
In the pamphlet prepared for the 2024 Senate hearing described above, the staff of the Joint Committee on Taxation offered a non-cash-based capital income method (referred to here as the “special” method), which includes notional income and is the source of the 34 percent tax rate that Sen. Wyden called funny math. The special method resembles the widely cited income and tax distributional analyses of economists Thomas Piketty at the Paris School of Economics and Emmanuel Saez and Gabriel Zucman at the University of California, Berkeley.5 Both of these methods rely on the National Accounts’ concept of national income, which offers comparability across time and geography but still requires imputations of things, such as tax evasion, that don’t always show up in administrative data.6
There are differences in which types of taxes the various researchers include in tax rate numerators. Piketty, Saez, and Zucman portray the total tax burden on these high-income Americans, including all federal, state, local, and even foreign taxes paid. Neither the JCT special nor standard method includes state and local taxes, and other researchers often exclude certain taxes that are thought to not make much difference for very high-income people, such as payroll taxes. This narrowness in the Joint Committee on Taxation’s approach makes it especially surprising that its tax rates are higher than most other estimates.
Funny math #2: Granularity at the very top
Figure 1 shows overall tax rates for the top 1 percent group, as well as even higher-income groups when the data are available, for the JCT standard method (the blue columns), the JCT special method (orange columns), and the approach by Piketty, Saez, and Zucman (purple columns).7 For context on the income levels, in the JCT special method, the top 1 percent has average per-capita income of $788,000, the top 0.1 percent about $3 million, and the top 0.01 percent about $13 million (all in 2019 levels). The top 400 families refers to a very select group at the top of income spectrum, though not as selective as two of the richest U.S. billionaires, Jeff Bezos and Warren Buffett, shown all the way on the right in Figure 1. (See Figure 1.)
Figure 1
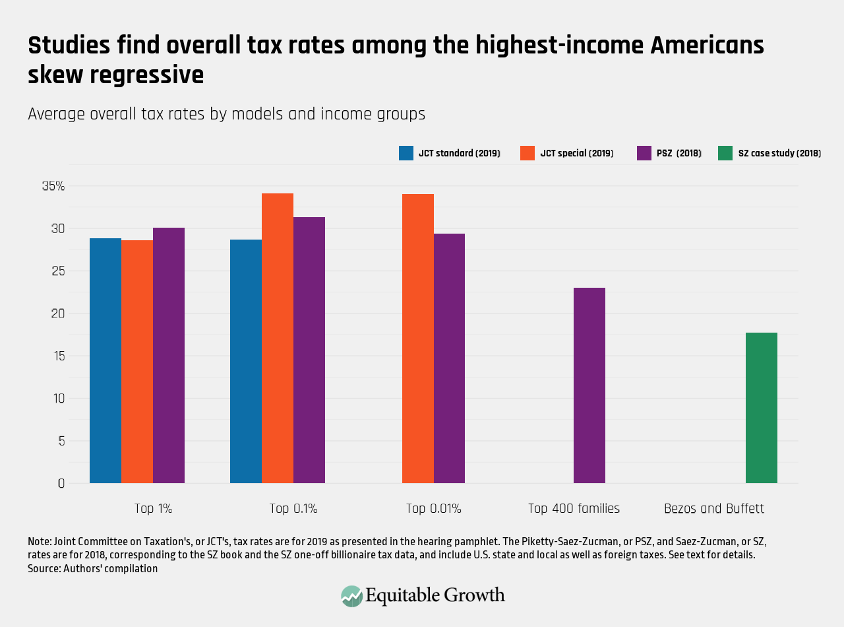
The results from Piketty, Saez, and Zucman are regressive at the very top beyond the truncation points at which the two JCT methods do not offer results, indicating wide variation even among the roughly 16,000 tax units in the top 0.01 percent. The Joint Committee’s top income tax rate is 34 percent for the special method that focuses on the top 0.01 percent of U.S. households and 28.7 percent for its standard percentile-based method focused on the top 0.1 percent, while Piketty, Saez, and Zucman’s top rate for the richest 400 families group is 23 percent. The latter rate aligns with a 2018 case study by Saez and Zucman of tax rates for Bezos and Buffett, seen in the green column of Figure 1, which relied heavily on tax and other administrative data in finding an overall 18 percent tax rate for the two billionaires.8
Digging deeper, much of the debate about overall tax rates at the very top of the U.S. income ladder is about individual income tax rates (as opposed to corporate, property, or sales tax rates), especially because the 0.01-percent-and-above groups receive so much income from pass-through business entities and own so many assets that appreciate so much.9 For the top 0.01 percent, Figure 2 shows that the JCT special model finds a 30.6 percent federal individual income tax rate, compared to the 17.2 percent rate calculated by Piketty, Saez, and Zucman, the latter being inclusive of state and local individual income taxes. (See Figure 2.)
Figure 2
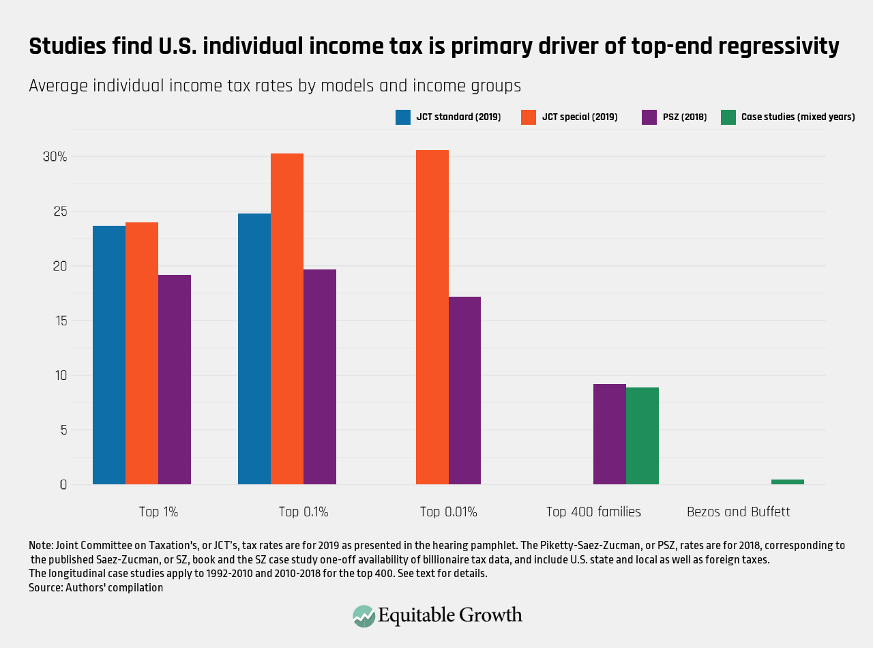
What’s more, Piketty, Saez, and Zucman find the top 400 families income group faces a 9.2 percent individual income tax rate. This finding punctuates the unraveling of top-end tax progressivity, consistent with case studies undertaken by economists Greg Leiserson (then at the White House Council of Economic Advisers) and Danny Yagan at UC Berkeley, which used a combination of administrative and survey data to find individual income tax rates of less than 10 percent for the top 400 families income group.10 And, even more stunning, Saez and Zucman calculate a 0.5 percent individual income tax rate for the two billionaires, Bezos and Buffett.
Administrative data as a tiebreaker
The case studies finding low tax rates for the top 400 families and for billionaires (even if just for two of them) are highly instructive. Why? Because when two or more competing tax rate calculations rely on different imputations, in addition to learning more about the competing imputations,11 those interested in tax policy ought to consider any available individualized administrative data.
An example of a helpful test using administrative data as a tiebreaker is a consistency check conditioned on the relation between the individual income tax rates of the top 400 families and the top 0.01 percent income groups. If we accept the case study findings that the individual income tax rate for the top 400 families is 10 percent or lower (as shown in Figure 2), then, because the top 400 families are by definition part of the 16,000 households that comprise the top 0.01 percent group, that implies that the other households in the top 0.01 percent group would face a federal individual income tax rate of 35 percent or higher in the JCT staff’s special approach.
Yet such a high federal individual income tax rate for the top 0.01 percent less the top 400 families seems implausible, given all the tax benefits available to the well-off, including the elective inclusion of capital gains at a lower tax rate, the deduction for charitable contributions,12 the 20 percent deduction for pass-through income, and corporations that don’t pay dividends. Unlike how both the JCT regular and special methods display uniform progressivity through the upper-income groups, other studies have shown that moving from cash-based to more comprehensive capital income methods reduces progressivity at the top.13
And, for an example of a new test using administrative data, there is a recent paper by economists Cole Campbell at the Federal Communications Commission and Jacob Robbins and Sam Wylde at the University of Illinois Chicago, on the distribution of realized and unrealized capital gains.14 They find an all-in tax rate of 25.5 percent for the top 0.01 percent income group.15
A ProPublica investigation using actual U.S. tax records also corroborated that the richest Americans pay a relatively small amount of individual income tax, with the top 15 families (by income), top 25 families (by wealth), and top 400 families (by income) paying an average individual income tax rate of 20 percent, 16 percent, and 22 percent, respectively, over 5 to 6 years in the mid-2010s. It is important to note that these relatively low rates are calculated with the very narrow denominator of reported Adjusted Gross Income, which does not include unrealized gains or proceeds from loans and is reduced by charitable donations, among other credits and deductions.16
Conclusion
Decades of U.S. tax policy has been influenced by the notion that federal tax rates are uniformly progressive, so whether there is a regressive tax rate notch for the very well-off is more than a nit. That regressivity is a gateway for confronting and fixing a U.S. fiscal system skewed to benefit the very wealthy—particularly today, given the tax and spending regressivity17 evident in the reconciliation bill passed by the House of Representatives on May 22, 2025, that is now before the U.S. Senate for consideration.
Perhaps at some point, that regressivity will spark the enactment of a billionaire’s tax18 in light of the evidence that the top 400 families income group pays a federal individual income tax rate of about 10 percent. Even if that tax rate were as high as, say, 20 percent, it still would mean, assuming other things remain unchanged, that there is a regressive notch within the top 0.01 percent income group. In the vernacular of Sen. Wyden’s comments, the math describing such top-end tax regressivity seems less funny than the math of the Joint Committee on Taxation’s 34 percent rate.
Did you find this content informative and engaging?
Get updates and stay in tune with U.S. economic inequality and growth!
End Notes
1. Doug Sword and Cady Stanton, “’Funny Math?’ Senators Can’t Agree on Official Tax Rate Statistics,” Tax Notes Federal, September 16, 2024; Steven M. Rosenthal, “The Rich are Different From You and Me, with Trillions of Dollars Escaping Taxation,” Tax Vox blog, September 19, 2024, available at https://taxpolicycenter.org/taxvox/rich-are-different-you-and-me-trillions-dollars-escaping-taxation; Joint Committee on Taxation, “Present Law And Background On The Income Taxation Of High Income And High Wealth Taxpayers,” JCX-47-24 (2024), available at https://www.jct.gov/getattachment/790991f7-b399-4d6f-be72-cdbe2d1345c4/x-47-24.pdf. The JCT offered similar pamphlets in 2021 (JCX-24-21, available at https://www.jct.gov/getattachment/c0469ad1-c75b-4a0e-b56e-07b35cb264f3/x-24-21.pdf) and 2023 (JCX-51-23, available at https://www.jct.gov/getattachment/b2168cb1-1026-4e58-9f62-65802dddfa79/x-51-23.pdf). The U.S. Senate Finance Committee hearing can been watched at https://www.finance.senate.gov/hearings/the-2025-tax-policy-debate-and-tax-avoidance-strategies (last accessed June 2025).
2. Jenny Bourne and others, “More Than They Realize: The Income of the Wealthy,” National Tax Journal 71 (2) (2018): 335–356.
3. Steven M. Rosenthal and Robert McClelland, “Taxing Capital Gains at Death At a Rate Higher Than During Life,” Tax Notes Federal, March 31, 2025.
4. Consistent application of economic depreciation in the National Accounts actually increases comprehensive capital income. See Patrick Driessen, “A Missing Link in Comprehensive Capital Income,” Tax Notes Federal, April 7, 2025.
5. Thomas Piketty, Emmanuel Saez, and Gabriel Zucman, “Distributional National Accounts: Methods and Estimates for the United States,” Quarterly Journal of Economics 133 (2) (2018); Emmanuel Saez and Gabriel Zucman, The Triumph of Injustice: How the Rich Dodge Taxes and How to Make Them Pay (New York: W. W. Norton & Company, 2019). The JCT approach mirrors that found in Gerald Auten and David Splinter, “Income Inequality in the United States: Using Tax Data to Measure Long-Term Trends,” Journal of Political Economy 132 (7) (2024). The denominators for the JCT special method and the Piketty-Saez-Zucman tax rates build on the National Accounts’-based concept of national income, which was about $18 trillion in 2018 and 2019. The JCT special tax rate denominator adds about $3 trillion for government transfers, while the Piketty-Saez-Zucman method adds about $500 billion of “pure” capital gains for their tax rate calculations.
6. U.S. Census Bureau, “Administrative Data” (2024), available at https://www.census.gov/topics/research/guidance/restricted-use-microdata/administrative-data.html.
7. For logistical reasons, the JCT results are for 2019 while the other results—which, unlike the Committee’s, also include U.S. state and local, as well as foreign, taxes—are for 2018. The JCT standard method also excludes the federal estate tax and gift tax. These data differences do not appear to affect trends or the model distinctions made in this column.
8. Emmanuel Saez and Gabriel Zucman, “Distributional Tax Analysis in Theory and Practice: Harberger Meets Diamond-Mirrlees.” Working Paper 31912 (National Bureau of Economic Research, 2023), available at http://www.nber.org/papers/w31912. The case study is presented at pp. 19–22 and in Table 1.
9. David S. Mitchell, “Factsheet: What the research says about taxing pass-through businesses” (Washington: Washington Center for Equitable Growth, 2024), available at https://equitablegrowth.org/factsheet-what-the-research-says-about-taxing-pass-through-businesses/.
10. Greg Leiserson and Danny Yagan, “What Is the Average Federal Individual Income Tax Rate on the Wealthiest Americans?,” White House blog, September 23, 2021, available at https://bidenwhitehouse.archives.gov/cea/written-materials/2021/09/23/what-is-the-average-federal-individual-income-tax-rate-on-the-wealthiest-americans/; Danny Yagan, “What Is the Average Federal Individual Income Tax Rate on the Wealthiest Americans?,” Oxford Review of Economic Policy 39 (2023), available at https://eml.berkeley.edu/~yagan/Top400FedIndRate.pdf. The 9.2 percent tax rate average of these two studies is used in Figure 2 for the top 400 families group. The two-billionaire result in Figure 2 is from Saez and Zucman, “Distributional Tax Analysis in Theory and Practice: Harberger Meets Diamond-Mirrlees.”
11. The latest exchanges about imputations can be found at https://gabriel-zucman.eu/ (last accessed June 2025) and https://davidsplinter.com/ (last accessed June 2025). For an even-handed discussion of the general results and some of the contested imputations, seeWilliam G. Gale, John Sabelhaus, and Samuel I. Thorpe, “Measuring Income Inequality: A Primer on the Debate,” Tax Vox blog, December 23, 2023, available at https://taxpolicycenter.org/taxvox/measuring-income-inequality-primer-debate.
12. Another paper based on administrative data shows the use of charitable contributions by the well-off. See Akcan Balkir and others, “Estimating Tax Burdens by Wealth Groups” (2024), available at https://www.irs.gov/pub/irs-soi/24rpestimatingtaxburdens.pdf.
13. See, for example, Edward Fox and Zachary Liscow, “The Role of Unrealized Gains and Borrowing in the Taxation of the Rich” Research Paper 24-041 (University of Michigan, 2025), available at https://ssrn.com/abstract=5104644, finding that between 2004 and 2022, the top 0.1 percent, excluding the Forbes 400, paid an average tax rate of 24 percent using Adjusted Gross Income as the denominator, but just 12 percent using economic income as the denominator, while the Forbes 400 paid 9.6 percent. See also Jesse Bricker and others, “Effective Tax Rates by Income and Wealth Class,” National Tax Journal 73 (4) (2020), available at https://www.journals.uchicago.edu/doi/10.17310/ntj.2020.4.03.
14. Cole Campbell, Jacob Robbins, and Sam Wylde, “The distribution of capital gains in the United States.” Working Paper (Washington Center for Equitable Growth, 2025), available at https://equitablegrowth.org/working-papers/the-distribution-of-capital-gains-in-the-united-states/.
15. Cole Campbell, Jacob Robbins, and Sam Wylde, “New research finds capital gains are highly concentrated and hardly taxed, underscoring widespread U.S. inequality” (Washington: Washington Center for Equitable Growth, 2025), available at https://equitablegrowth.org/new-research-finds-capital-gains-are-highly-concentrated-and-hardly-taxed-underscoring-widespread-u-s-inequality/.
16.
Paul Kiel and others, “America’s Highest Earners and their Tax Rates Revealed,” ProPublica, April 13, 2022, available at
https://projects.propublica.org/americas-highest-incomes-and-taxes-revealed/; Paul Kiel, Jeff Ernsthausen, and Jesse Eisinger, “You May Be Paying a Higher Tax Rate Than a Billionaire,” ProPublica, June 8, 2021, available at https://www.propublica.org/article/you-may-be-paying-a-higher-tax-rate-than-a-billionaire. Using wealth records from Forbes to calculate a denominator that includes unrealized gains, ProPublica also found that the 25 richest Americans paid an average of 3.4 percent in federal individual income tax from 2014 to 2018. See Jesse Eisinger, Jeff Ernsthausen, and Paul Kiel, “The Secret IRS Files: Trove of Never-Before-Seen Records Reveal How the Wealthiest Avoid
Income Tax,” ProPublica, June 8, 2021, available at
https://www.propublica.org/article/the-secret-irs-files-trove-of-never-before-seen-records-reveal-how-the-wealthiest-avoid-income-tax.
17. Congressional Budget Office, “Preliminary Analysis of the Distributional Effects of the One Big Beautiful Bill Act” (2025), available at https://www.cbo.gov/publication/61422.
18. David S. Mitchell, “Billionaires Income Tax proposal seeks to ensure that U.S. ultra-wealthy pay their fair share in taxes” (Washington: Washington Center for Equitable Growth, 2021), available at https://equitablegrowth.org/billionaires-income-tax-proposal-seeks-to-ensure-that-u-s-ultra-wealthy-pay-their-fair-share-in-taxes/.


Stay updated on our latest research