Should-Attend: Mohamed Saleh and Jean Tirole: Taxing Unwanted Populations: Fiscal Policy and Conversions in Early Islam

Should-Attend: Mohamed Saleh and Jean Tirole: Taxing Unwanted Populations: Fiscal Policy and Conversions in Early Islam: “Hostility towards a population, whether on religious, ethnic, cultural or socioeconomic grounds…

…confronts rulers with a trade-off between taking advantage of population members’ eagerness to keep their status and inducing them to “comply” (conversion, quit, exodus or any other way of pleasing the hostile rulers). This paper first analyzes the rulers’ optimal mix of discriminatory and non-discriminatory taxation, both in a static and an evolving environment. It thereby derives a set of unconventional predictions. The paper then tests the theory in the context of Egypt’s conversion to Islam after 641 using novel data sources. The evidence is broadly consistent with the theoretical predictions…

What if we took equity into account when measuring economic growth?


Featured image from Flickr user Charles & Hudson. Image has been cropped.

Jason Furman’s provocatively titled new paper, “Should Policymakers Care Whether Inequality is Helpful or Harmful for Growth,” poses important questions about how we should think about the relationship between economic inequality and growth. Furman, the former chairman of the White House Council of Economic Advisers in the Obama administration (and new member of Equitable Growth’s steering committee), examines a key concept in economics dating back to the 1975 publication of Arthur Okun’s book Equality and Efficiency: that there is a tradeoff between an efficient, growing economy and an equitable economy. Furman questions several aspects of this basic premise.

Most subversively, Furman asks if economists are even measuring growth correctly. Forget the whole idea of “growth” for a moment and imagine instead that the question is simply “is inequality good or bad for society?” How can economists evaluate the good or bad part of this statement? Should they be interested in total economic output or something more granular such as wage growth for the middle class? Should they include noneconomic phenomena such as the health of citizens? Furman believes that insufficient thought has been given to this question as it relates to the study of inequality.

Traditionally, economists and policymakers measure the success of the economy using growth in Gross Domestic Product, which is a measure of all the goods and services produced within the United States. Growth in GDP means that there is a rise in the total economic output of the nation. But while journalists and policymakers alike often treat GDP growth as a sacred, inviolate marker of the health of our economy, economists know that GDP is just one measure among many that can be used to measure success. There is a vast universe of such possible measures, ranging from those that merely tweak the idea of GDP growth to those that upend it entirely. Those measures give us a very different picture of the economic progress of the nation. Importantly, the more these measures account for what economic growth looks like up and down the income spectrum, the less rosy the economic picture is in recent years.

How else can we measure success?

The question of how to measure success has been the subject of many book-length treatments and landmark reports. Some sociologists and economists have long taken the view that GDP isn’t measuring much of use.1 GDP does not measure the work of homeworkers, for example, or care about environmental quality or health outcomes. A country with high and increasing GDP could nevertheless be quite an unpleasant one to live in.

Furman focuses on one particular facet of this debate by noting that GDP growth places the same value on $1 of new income earned by the richest member of society as it does on $1 earned by the poorest member of society. But surely society would prefer to value more highly the $1 for the poor person because society values equity to some degree and because the rich person presumably values an additional dollar much less than the poor person does. And it might be better for growth too: The poor person is more likely to spend that $1, contributing to overall demand in the economy, while the rich person is likely to save it in ways that protect wealth but may not necessarily improve growth down the line. We can capture this moral and economic preference for equity by adjusting our measures of success. Furman gives three suggestions.

Median income

GDP growth is based on mean income—a simple average calculated by dividing total income (measured by GDP) by the number of people in the economy. When an economy includes many very rich people, this will pull up average income. Median income, which would be the income of the person in the exact middle if you lined up all the people in the United States from poorest to richest, doesn’t change if an already rich person gets significantly richer. It’s just the person in the middle. Thus, it’s an accurate indicator of success for someone in the middle of the income distribution. (See Figure 1.)

Figure 1

Growth for some particular slice of the income distribution

Furman suggests that economists and policymakers might simply look at only the slice of the income distribution they care about most. He suggests the bottom fifth of income earners, meaning the poorest 20 percent of society. While this is important, we focus in this analysis on what we call the upper 40 percent—that is, adults with incomes between the 50th and 90th percentile. This group represents the middle class and upper-middle class. Research shows that this group, though affluent, is losing ground relative to society’s truly rich in the top 1 percent of the income distribution. If overall growth outpaces growth in this group, then it suggests that growth is high for either the poorest earners or the very richest. This measure ignores other parts of the income distribution and cares only about growth in this slice. Income gained by someone in the top 10 percent—or the bottom 10 percent—will not impact this measure at all.

Mean log of income

This is an economic concept that requires a little explanation. Economists use this measure because it stretches out the bottom of the income distribution. For this measure, we transform the income of each person in the economy by taking the natural log of their income—we’re not going to explain here what a log is, but the figures below show how logging income affects its distribution. This will inflate small numbers and shrink large numbers relative to the rest of the numbers in the series because the log curve stretches the bottom of the chart out, increasing the importance of the gap between the poor and the middle class, and compresses the top of the curve, decreasing the importance of the gap between the middle class and the very rich. (See Figure 2.)

Figure 2

The graph on the left side of Figure 2 shows the 2014 U.S. income distribution logged. Notice how the incomes of the top 10 percent, which dominated the scale of Figure 1, are compressed. To show how mean log of income works, we massively inflated incomes of the top 10 percent in the second panel of Figure 2. Our manipulation represents a massive increase in total economic output: By traditional measures, we have increased economic output by 56 percent. But notice how little the mean moves in the second panel. The log of mean income increases just 7 percent in this scenario. Because this change in income was so inequitable, it had very little impact on the mean log of income.

Using mean log of income means that income changes for the poor will have a large impact on growth, whereas income changes for the rich will matter very little for growth. An additional $1 in the hands of a rich person matters less for overall growth than $1 in the hands a poor person, reflecting the intuition Furman advances about equal amounts of growth having different values to different people and to the economy as a whole.

Examining different measures of growth

How would economists and policymakers’ view of growth in the United States change if they looked at some of these alternate measures? We used the Distributional National Accounts dataset created by economists Thomas Piketty at the Paris School of Economics and Emmanuel Saez and Gabriel Zucman at the University of California, Berkeley to evaluate each of the alternative growth measures mentioned above. The Distributional National Accounts dataset takes aggregate GDP—about $19 trillion in the United States right now—and estimates how it is distributed between all adults in the economy.2 By disaggregating economic growth in this way, economists can use it to construct various national income measures from the dataset that might otherwise be difficult to observe and that are directly comparable to total output growth.

Distributional National Accounts is based on Net National Income, which is a bit different from GDP but exhibits similar patterns of growth.3 All the measures we have calculated here are for income after all government taxes and transfers are accounted for—think government programs such as Supplemental Nutrition Assistance or the Earned Income Tax Credit—which tend to reduce inequality in the United States.

1963–1980

Figure 3 shows the trend in overall Net National Income growth and our three alternative measures of NNI growth from 1963 to 1980. The thick green line shows overall NNI growth. For most of this period, all four lines are very close to one another. This suggests that growth was relatively even across all income groups. (See Figure 3.)

Figure 3

The one exception is in the mid-1960s, when growth in the mean log of income is much higher than growth in the other three measures. Remember that mean log of income will tend to highlight gains at the bottom much more than gains at the top. This discrepancy between 1965 and 1967 indicates that growth in those years was very strong for those below the median income.

1980–1990

In the 1980s, we start to see some real divergence in our measures of growth. Most notably, Figure 4 shows that at three growth peaks in 1981, 1984, and 1988, overall growth is higher than any other measure of growth. Those in the upper 40 percent of the income distribution registered growth running a little behind headline growth, with both running several percentage points ahead of the mean log of income. Income inequality started to take off in the 1980s. In 1984, for example, growth for the top 1 percent was a stunning 19 percent, while growth for the bottom 90 percent was just 4.2 percent. (See Figure 4.)

Figure 4

Our alternate measures of growth also solve the mystery of the “double dip” recession of the early 1980s highlighted in Figure 4. The recovery in 1981 was really only a recovery for those with high incomes. Any other measure of growth would have shown that the economy was still in recession during this period.

Compare Figure 4 to Figure 3. Notice that the booms of the 1980s that appear to surpass or equal those of the 1960s and 1970s would be much less impressive if economic growth were measured using the mean log of income or median income. The 1984 peak would be comparable to the 1973 and 1976 peaks, while the peak of 1987 and 1988 would be seen as quite weak in this historical context.

1990–2014

In the 1990s, the various measures once again move into relative alignment. As Figure 5 shows, however, overall growth continues to be about half a percentage point larger than growth by our alternative measures in most years. (See Figure 5.)

Figure 5

Of particular note in this time period is the Great Recession, spanning from the end of 2007 to mid-2009, when overall growth was significantly less negative than mean log of income growth. Although the Great Recession hit all income brackets hard, it was particularly damaging for those at the bottom of the income ladder. Earners in the bottom 50 percent of the income distribution saw income growth almost 3 percentage points lower than those in the top 1 percent.

What is the right measure of growth?

The four measures shown in the graphs above could all be reasonable ways of thinking about measuring progress in the U.S. economy. Each requires making a value judgement about what kind of growth we value. This is no less true of GDP growth. As Figure 4 demonstrates, GDP growth can paint a very misleading picture of the health of the economy, suggesting that we are in a robust recovery when, in fact, only a small number of households are benefitting.

Furman is right to suggest that this is a debate economists and policymakers should have. Unfortunately, the economic indicators reported by the U.S. Bureau of Economic Analysis do not provide sufficient detail to calculate, for example, the mean log of income. In fact, the quarterly GDP indicators, called the National Income and Product Accounts, provide no distributional information at all. The task of decomposing growth by income quantile has fallen to academic economists. Until the BEA takes up the task of reporting distributional income totals, decisionmakers will continue to lean on GDP growth, and they will continue to be misled by it.

Should-Read: Mark Koyama: The End of the Past

Should-Read: Mark Koyama: The End of the Past: “Temin’s GDP estimates suggest that Roman Italy had comparable per capita income to the Dutch Republic in 1600…

…Schiavone… raises important points that I had fully not considered previously…. Aelius Aristides celebrating the wealth of the Roman empire in the mid-2nd century AD… a panegyric addressed to flatter the emperor but its emphasis on long-distance trade, commerce, manufacturing is highly suggestive. Such a speech is all but impossible to imagine in an predominantly rural and autarkic society. Aristides is painting a picture of a highly developed commercialized economy that linked together the entire Mediterranean and beyond. Even if he is grossly exaggerates, the imagine he depicts must have been plausible to his audience.

In evaluating the Roman economy in the age of Aristides, Schaivone notes that:

Until at least mid-seventeenth century Amsterdam, so expertly described by Simon Schama—the city of Rembrandt, Spinoza, and the great sea-trade companies, the product of the Dutch miracle and the first real globalization of the economy—or at least, until the Spanish empire of Philip II, the total wealth accumulated and produced in the various regions of Europe reached levels that were not too far from those of the ancient world…

This is the point Temin makes. Whether measured in terms of the size of its largest cities—Rome in 100 AD was larger than any European city in 1700—or in the volume of grain, wine, and olive oil imported into Italy, the scale of the Roman economy was vast by any premodern standard. Quantitively, then, the Roman economy looks as large and prosperous as that the early modern European economy. Qualitatively, however, there are important differences….

Roman history leaves no traces of great mercantile companies like the Bardi, the Peruzzi or the Medici. There are no records of commercial manuals of the sort that are abundant from Renaissance Italy… no political economy or “economics”…. The most obvious institutional difference between the ancient world and the modern was slavery. Recently historians have tried to elevate slavery and labor coercion as crucial causal mechanism in explaining the industrial revolution. These attempts are unconvincing (see this post) but slavery certainly did dominate the ancient economy….

Schiavone’s chapter “Slaves, Nature, Machines” is a tour de force. At once he captures the ubiquity of slavery in the ancient economy, its unremitting brutality—for instance, private firms that specialized in branding, retrieving, and punishing runaway slaves—and, at the same time, touches the central economic questions raised by ancient slavery: to what extent was slavery crucial to the economic expansion of period between 200 BCE and 150 AD? And did the prevalence of slavery impede innovation?…

Schiavone suggests that ultimately the economic stagnation of the ancient world was due to a peculiar equilibrium that centered around slavery…. The apparent modernity of the ancient economy—its manufacturing, trade, and commerce rested largely on slave labor…. The ancient reliance on slaves as human automatons—machines with souls—removed or at least weakened, the incentive to develop machines for productive purposes…. There was also a specific cultural attitude….

None of the great engineers and architects, none of the incomparable builders of bridges, roads, and aqueducts, none of the experts in the employment of the apparatus of war, and none of their customers, either in the public administration or in the large landowning families, understood that the most advantageous arena for the use and improvement of machines—devices that were either already in use or easily created by association, or that could be designed to meet existing needs—would have been farms and workshops…

The relevance of slavery colored ancient attitudes towards almost all forms of manual work or craftsmanship. The dominant cultural meme was as follows: since such work was usually done by the unfree, it must be lowly, dirty and demeaning:

technology, cooperative production, the various kinds of manual labor that were different from the solitary exertion of the peasants on his land—could not but end up socially and intellectually abandoned to the lowliest members of the community, in direct contact with the exploitation of the slaves, for whom the necessity and demand increased out of all proportion… the labor of slaves was in symmetry with and concealed behind (so to speak) the freedom of the aristocratic thought, while this in turn was in symmetry with the flight from a mechanical and quantitative vision of nature…

Thus this attitude also manifest itself in the distain the ancients had for practical mechanics:

Similar condescension was shown to small businessmen and to most trade (only truly large-scale trade was free from this taint). The ancient world does not seem to have produced self-reproducing mercantile elites…. The phenomenon coined by Fernand Braudel, the “Betrayal of the Bourgeois,” was particularly powerful in ancient Rome. Great merchants flourished, but “in order to be truly valued, they eventually had to become rentiers, as Cicero affirmed without hesitation: ‘Nay, it even seems to deserve the highest respect, if those who are engaged in it [trade], satiated, or rather , I should say, satisfied with the fortunes they have made, make their way from port to a country estate, as they have often made it from the sea into port. But of all the occupations by which gain is secured, none is better than agriculture, none more delightful, none more becoming to a freeman’” (Schiavone, 2000, 103)…

Such a cultural argument fits perfectly with Deirdre McCloskey’s claim in her recent trilogy that it was the adoption of bourgeois cultural norms and specifically bourgeois rhetoric that distinguished and caused the rise of north-western Europe after 1650….

The most advanced economies of early modern Europe, say England in 1700, were on the surface not too dissimilar to that of ancient Rome. But beneath the surface they contained the “coiled spring”, or at least the possibility, of sustained economic growth—growth driven by the emergence of innovation (a culture of improvement) and a commercial or even capitalist culture. According to Schiavone’s assessment, the Roman economy at least by 100 CE contained no such coiled spring.

We are not yet at the point when we can decisively assess this argument. But the importance of culture and the manner in which cultural and material factors interacted is clearly crucial. The argument that the slave economy and the easy assumptions of aristocratic superiority reinforced one another is a powerful one. For whatever historical reasons these cultural elements in the Roman economy were relatively undisturbed by the rise of merchants, traders and money grubbing equites. Likewise slavery did not undermine itself and give rise to wage labor.

Why this was the case can be left to future analysis. The full answer to the question why this was the case and a more careful consideration of the counterfactual “could it have been otherwise” are topics deserving their own blog post.

Monday DeLong Smackdown: Trying and Failing to Get in Touch with My Inner Austrian Back in 2004…

That I never figured out how to write this paper is deserving of a smackdown. Why did I never figure out how to write it? Because I never figured out what to say, or what the answer was:

Hoisted from 2004: Getting in Touch with My Inner Austrian: A Still-Unwritten Paper: Fragment of an Unfinished Ms.: Part II of an unfinished paper, “After the Bubble.” The paper currently lacks Parts I, III, IV, V, and VI:

II. Aggressively Expansionary Monetary Policy and Macroeconomic Vulnerabilities:

Let us begin with a passage from Mussa (2004), “Global Economic Prospects: Bright for 2004 but with Questions Thereafter” (Washington: Institute for International Economics: April 1), in which Michael Mussa writes about global financial imbalances:

Michael Mussa: Policy interest rates are exceptionally low in most industrial countries: zero in Japan and Switzerland, 1 percent in the United States, 2 percent in the euro area, and at or near historic lows in the United Kingdom and Canada…. The very low level of policy interest rates is an imbalance (relative to normal conditions) that reflects exceptionally easy monetary policies to combat economic weakness.

This policy imbalance poses an important challenge for the future conduct of monetary policy. Situations of low policy interest rates and low inflation tend to be associated with unusual inertia in the processes of general price inflation, which makes traditional indicators of rising inflationary pressures less reliable as measures of the need to begin to tighten monetary conditions. Also, these situations tend to be associated with high valuations of equities, real estate, and long-term bonds, which can become fertile ground for large, unsustainable increases in asset prices. In this situation, if monetary policy is tightened too much too soon (perhaps because of worries about unsustainable increases in asset prices), the result can be an unnecessary asset market crunch and economic slowdown, and monetary policy may have relatively little room to ease in order to counteract this outcome.

On the other hand, if monetary policy remains too easy for too long (perhaps because subdued general price inflation gives no clear signal of the need for monetary tightening), then large asset price anomalies may develop before corrective action is taken. The monetary authority would then confront the grim choice of trying to keep an unsustainable asset price bubble alive or trying to combat the collapse of such a bubble without a great deal of room for monetary easing.

A further concern related to the general monetary policy imbalance in the industrial countries is its effect on emerging market economies. Interest rate spreads for emerging market borrowers have contracted substantially and flows of new credit have increased. The boom in emerging market credit has not yet reached the frenzy of the first half of 1997, but it is headed in that direction. Another major series of emerging market financial crises (such as 1997-99) does not seem likely in the near term in view of the very low level of industrial country interest rates and the favorable global economic environment for emerging market countries. By 2005 or 2006, however, either upward movements in industrial country interest rates or deterioration of market perceptions of the economic and financial stability of some emerging market countries could trigger another round of crises.

Mussa is warning that the high asset prices produced by very low interest rates pose dangers that may turn out to be substantial. One way to read Mussa’s warning is as a polite–a very polite–criticism of Alan Greenspan’s self-praise of his own low interest-rate policy contained in Greenspan (2004), “Risk and Uncertainty in Monetary Policy” (Washington: Federal Reserve Board: January 3):

Alan Greenspan: Perhaps the greatest irony of the past decade is that… success against inflation… contributed to the stock price bubble …. Fed policymakers were confronted with forces that none of us had previously encountered. Aside from the then-recent experience of Japan, only remote historical episodes gave us clues to the appropriate stance for policy under such conditions. The sharp rise in stock prices and their subsequent fall were, thus, an especial challenge to the Federal Reserve. It is far from obvious that bubbles, even if identified early, can be preempted at lower cost than a substantial economic contraction and possible financial destabilization–the very outcomes we would be seeking to avoid…. The notion that a well-timed incremental tightening could have been calibrated to prevent the late 1990s bubble while preserving economic stability is almost surely an illusion.

Instead of trying to contain a putative bubble by drastic actions with largely unpredictable consequences, we chose, as we noted in our mid-1999 congressional testimony, to focus on policies “to mitigate the fallout when it occurs and, hopefully, ease the transition to the next expansion.”

During 2001, in the aftermath of the bursting of the bubble and the acts of terrorism in September 2001, the federal funds rate was lowered 4-3/4 percentage points. Subsequently, another 75 basis points were pared, bringing the rate by June 2003 to its current 1 percent, the lowest level in 45 years. We were able to be unusually aggressive in the initial stages of the recession of 2001 because both inflation and inflation expectations were low and stable. We thought we needed to be, and could be, forceful in 2002 and 2003 as well because, with demand weak, inflation risks had become two-sided for the first time in forty years.

There appears to be enough evidence, at least tentatively, to conclude that our strategy of addressing the bubble’s consequences rather than the bubble itself has been successful. Despite the stock market plunge, terrorist attacks, corporate scandals, and wars in Afghanistan and Iraq, we experienced an exceptionally mild recession–even milder than that of a decade earlier. As I discuss later, much of the ability of the U.S. economy to absorb these sequences of shocks resulted from notably improved structural flexibility. But highly aggressive monetary ease was doubtless also a significant contributor to stability…

Greenspan is confident that raising interest rates and thus raising the unemployment rate during the bubble of the late 1990s would have been the wrong policy, and that aggressively lowering interest rates after the bubble was the right policy. Lowering interest rates cushioned falls in bond prices. Lowering interest rates made use of bond financing for investment more attractive. Lowering interest rates boosted bond and real estate prices, induced households to refinance, and so provided a powerful spur to consumption spending that largely offset the post-bubble fall in investment spending. In Greenspan’s view, the aggressive lowering ofinterest rates was exactly the right thing to do in the aftermath of the bubble to shift spending from investment to consumption and so to keep the economy not far from full employment.

Mussa says: not so fast. Very low interest rates, coupled with assurances from high Federal Reserve officials that interest rates will stay very low for substantial periods of time, produce a situation in which the prices of long-duration assets—long-term bonds, growth stocks, and real estate—climb very high. What goes up may come down, and may come down rapidly. And should some class of asset prices come down rapidly and should it turn out that many debtors in the economy go bankrupt because their assets have lost value, serious financial crisis will result. The price of using exceptionally easy money to keep the collapse of the dot-com bubble from turning into a depression has been the creation of a three-fold vulnerability:

  1. If the assets the prices of which collapse when interest rates start to rise are emerging-market debt, then the memories of the 1990s and increasing risk will induce large-scale capital flight from the periphery to the core—an echo of the East Asian financial crises of 1997-1998.

  2. If the assets the prices of which threaten collapse when interest rates start to rise are domestic bond and real estate holdings that have been pushed to unsustainable levels by positive-feedback “bubble” buying, then the “monetary authority would… confront the grim choice of trying to keep an unsustainable asset price bubble alive or trying to combat the collapse of such a bubble without a great deal of room for monetary easing” to keep real estate and bond prices from falling far and fast.

  3. “If monetary policy is tightened too much too soon” (presumably because of fears of positive-feedback “bubble” buying), the result may be a credit crunch and a recession—with no guarantee that a reversal of the monetary policy tightening will undue the effects of the credit crunch. I do not believe that many economists would say that Mussa’s fears about the potential macroeconomic vulnerabilities created by the low interest-rate policy the Federal Reserve has pursued since the end of the dot-com bubble are unreasonable. (Few, however, carry their alarm to the degree that Stephen Roach of Morgan Stanley does.)

And Mussa expresses them in a coherent language—one in which sustained rises in asset prices induce positive-feedback trading that “bubbles” prices above fundamentals, one in which what goes up comes down rapidly, one in which large sudden falls in asset prices produce chains of bankruptcy and raise risk and default premia enough to threaten to cause deep recessions. The language has echoes of the great Charles P. Kindleberger’s (1978) Manias, Panics, and Crashes (New York: Basic Books), and of earlier writings about the consequences of excessive money-printing: “inflation, revulsion, and discredit.”

But what Mussa’s assessment of risks lacks is a model. And without a model, we have a hard time assessing his argument. Alan Greenspan frightened away the Evil Depression Fairy in 2000-2002 by promising not that he would let the Evil Fairy marry his daughter but by promising high asset prices—unsustainably high asset prices—for a while. Whether this was a good trade or not depends on the relative values of the risks avoided and the risks accepted. And to evaluate this requires a model of some sort…


References:

Alan Greenspan (2004), “Risk and Uncertainty in Monetary Policy” (Washington: Federal Reserve Board: January 3).

Michael Mussa (2004), “Global Economic Prospects: Bright for 2004 but with Questions Thereafter” (Washington: Institute for International Economics: April 1)…”

Must-Read: Dylan Matthews: You’re not imagining it: the rich really are hoarding economic growth

Must-Read: As I repeatedly say, people are spending a lot of time on their cellphones and such doing things that would have been very expensive or impossible back in 1980. That doesn’t speak to the distributional point at all—the rich (at least the young rich) benefit more from cheap electronic devices not just by being able to afford more of them but because they are information-age force multipliers for how to better spend your money. But it does speak to the average growth point:

Dylan Matthews: You’re not imagining it: the rich really are hoarding economic growth: “With… ‘distributional national accounts’… exactly where economic growth is going…

…and how much each group is seeing its income rise relative to the overall economy…. Saez, Piketty, and Zucman… answers basically all of the conservative critiques…. Incomes… employer-provided health care, pensions, and other benefits… taxes and government transfer programs… changes in income among adults, rather than households or tax units… the slower-growing inflation metric, rather than CPI. And what do they find? This:

The rich really are hoarding economic growth

Should-Read: Brink Lindsey and Steven Teles: The Captured Economy: How the Powerful Enrich Themselves, Slow Down Growth, and Increase Inequality

Should-Read: I would conceptualize this differently. It is not a “breakdown” of democratic governance that has allowed “wealthy special interests to capture the policymaking process”. Interests have always captured the policymaking process. (i) Sometimes these interests are broad coalitions interested in (progressive) redistribution. (ii) Sometimes these interests are (narrower) interests interested in promoting entrepreneurship, enterprise, and wealth. And (iii) sometimes these interests are (narrow) interests interested in negative sum policies that drive their own enrichment. Interests of type (i) promote the general welfare according to standard utilitarian theory. Interest of type (ii) promote the general welfare by enriching the economy. It is interests of type (iii) that are the problem. And the question is: why does it appear that interests of type (iii) are more powerful now than they used to be?

Brink Lindsey and Steven Teles: The Captured Economy: How the Powerful Enrich Themselves, Slow Down Growth, and Increase Inequality: “For years, America has been plagued by slow economic growth and increasing inequality…

…Yet economists have long taught that there is a tradeoff between equity and efficiency-that is, between making a bigger pie and dividing it more fairly. That is why our current predicament is so puzzling: today, we are faced with both a stagnating economy and sky-high inequality. In The Captured Economy, Brink Lindsey and Steven M. Teles identify a common factor behind these twin ills: breakdowns in democratic governance that allow wealthy special interests to capture the policymaking process for their own benefit. They document the proliferation of regressive regulations that redistribute wealth and income up the economic scale while stifling entrepreneurship and innovation. When the state entrenches privilege by subverting market competition, the tradeoff between equity and efficiency no longer holds.

Over the past four decades, new regulatory barriers have worked to shield the powerful from the rigors of competition, thereby inflating their incomes-sometimes to an extravagant degree. Lindsey and Teles detail four of the most important cases: subsidies for the financial sector’s excessive risk taking, overprotection of copyrights and patents, favoritism toward incumbent businesses through occupational licensing schemes, and the NIMBY-led escalation of land use controls that drive up rents for everyone else.

Freeing the economy from regressive regulatory capture will be difficult. Lindsey and Teles are realistic about the chances for reform, but they offer a set of promising strategies to improve democratic deliberation and open pathways for meaningful policy change. An original and counterintuitive interpretation of the forces driving inequality and stagnation, The Captured Economy will be necessary reading for anyone concerned about America’s mounting economic problems and the social tensions they are sparking.

Must- and Should-Reads: November 25, 2017

Must-Reads:


Should-Reads:


Must-Read: Paul Krugman (2009): The Obama Gaps

Must-Read:

  1. Paul Krugman is right…
  2. If you think Paul Krugman is wrong, see #1…

Paul Krugman (2009): The Obama Gaps: “The bottom line is that the Obama plan is unlikely to close more than half of the looming output gap, and could easily end up doing less than a third of the job…

…Why isn’t Mr. Obama trying to do more? Is the plan being limited by fear of debt? There are dangers associated with large-scale government borrowing…. But it would be even more dangerous to fall short in rescuing the economy. The president-elect spoke eloquently and accurately on Thursday about the consequences of failing to act—there’s a real risk that we’ll slide into a prolonged, Japanese-style deflationary trap—but the consequences of failing to act adequately aren’t much better.

Is the plan being limited by a lack of spending opportunities? There are only a limited number of “shovel-ready” public investment projects…. But there are other forms of public spending, especially on health care, that could do good while aiding the economy in its hour of need. Or is the plan being limited by political caution?… Keep the… price… below the politically sensitive trillion-dollar mark… inclusion of large business tax cuts, which add to its cost but will do little for the economy… [as] an attempt to win Republican votes in Congress.

Whatever the explanation, the Obama plan just doesn’t look adequate to the economy’s need. To be sure, a third of a loaf is better than none. But right now we seem to be facing two major economic gaps: the gap between the economy’s potential and its likely performance, and the gap between Mr. Obama’s stern economic rhetoric and his somewhat disappointing economic plan.

Should-Read: Paul Krugman: Schroedinger’s Tax Hike

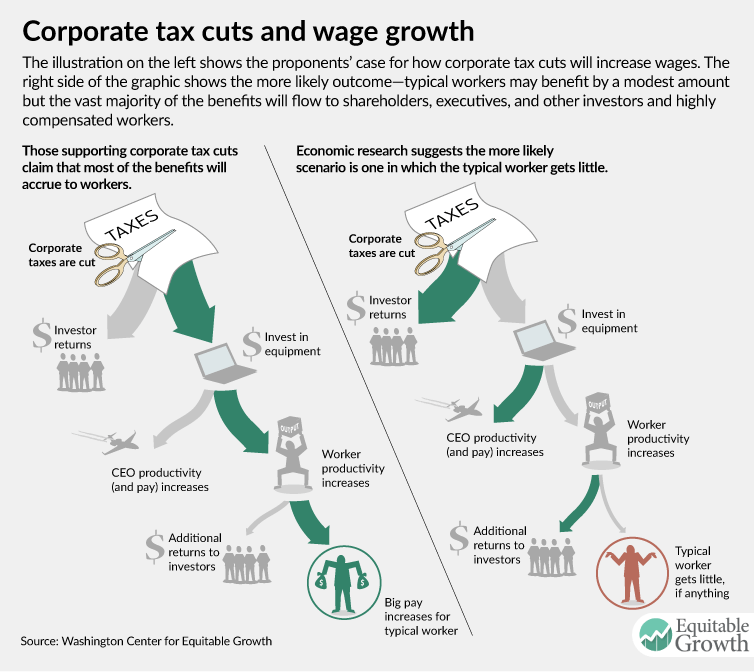
Should-Read: Yes, it’s a grift. The only question is: who inside the Republican coalition is being grifted here?

Paul Krugman: Schroedinger’s Tax Hike: “The Senate bill… tries to be long-run deficit-neutral… by offsetting huge corporate tax cuts with higher taxes on individuals…

By 2027 half the population, and most of the middle-class, would see taxes go up. But those tax hikes are initially offset by a variety of temporary tax breaks…. Republicans are arguing that those tax breaks won’t actually be temporary…. But they also need to assume that those tax breaks really will expire in order to meet their budget numbers.

So the temporary tax breaks need, for political purposes, to be both alive and dead…. For now, they want to hold it all in suspension. Once upon a time you wouldn’t have imagined they could get away with it. Now…

Should-Read: Alexander William Salter and Daniel J. Smith: The Role of Political Environments in the Formation of Fed Policy Under Burns, Greenspan, and Bernanke

Should-Read: Alexander William Salter and Daniel J. Smith: Political Economists or Political Economists? The Role of Political Environments in the Formation of Fed Policy Under Burns, Greenspan, and Bernanke: “We analyze the writings and speeches of… Arthur Burns, Alan Greenspan, and Benjamin Bernanke…

…as they transitioned to becoming chairman of the Fed. The tension between their previously stated views and their subsequent policy stances as chairman of the Fed, suggest that operation within political institutions impelled them to alter their views. Our findings offer additional support for incorporating the concerns of political economy into monetary models and structures…