JOLTS Day Graphs: October 2017 Report Edition
Every month the U.S. Bureau of Labor Statistics releases data on hiring, firing, and other labor market flows from the Job Openings and Labor Turnover Survey, better known as JOLTS. Today, the BLS released the latest data for October 2017. This report doesn’t get as much attention as the monthly Employment Situation Report, but it contains useful information about the state of the U.S. labor market. Below are a few key graphs using data from the report.
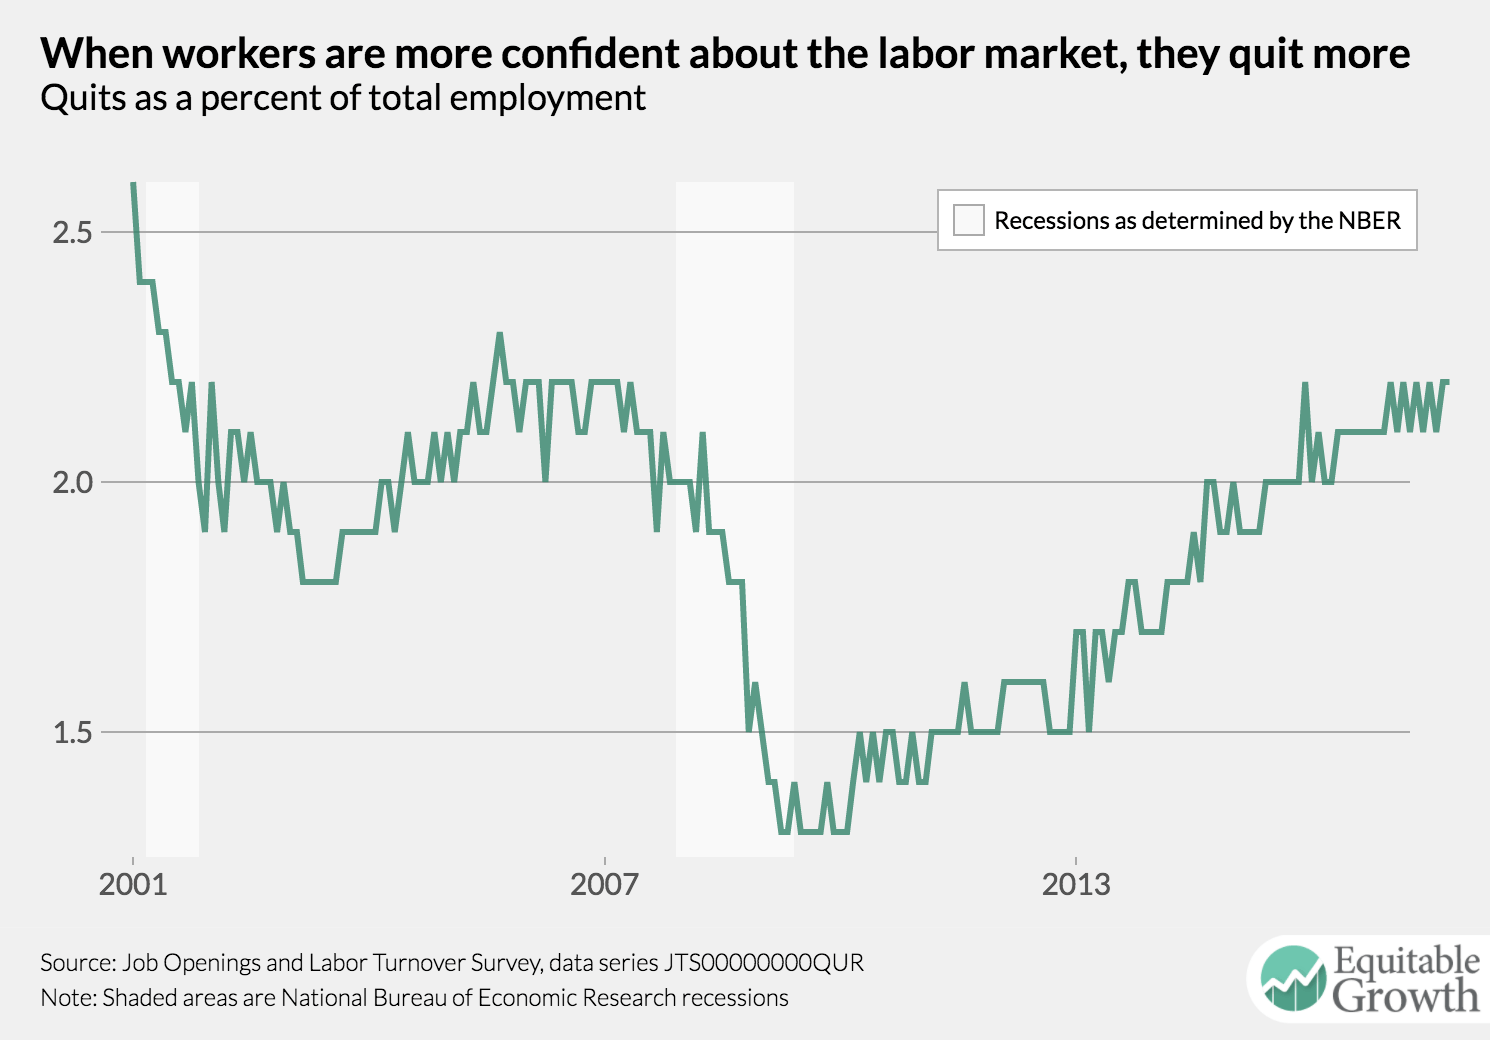
The quits rate continues to do nothing, staying at 2.2 percent in October. Job-hopping is a key way workers get raises, so wage growth may remain tepid if quitting remains muted.
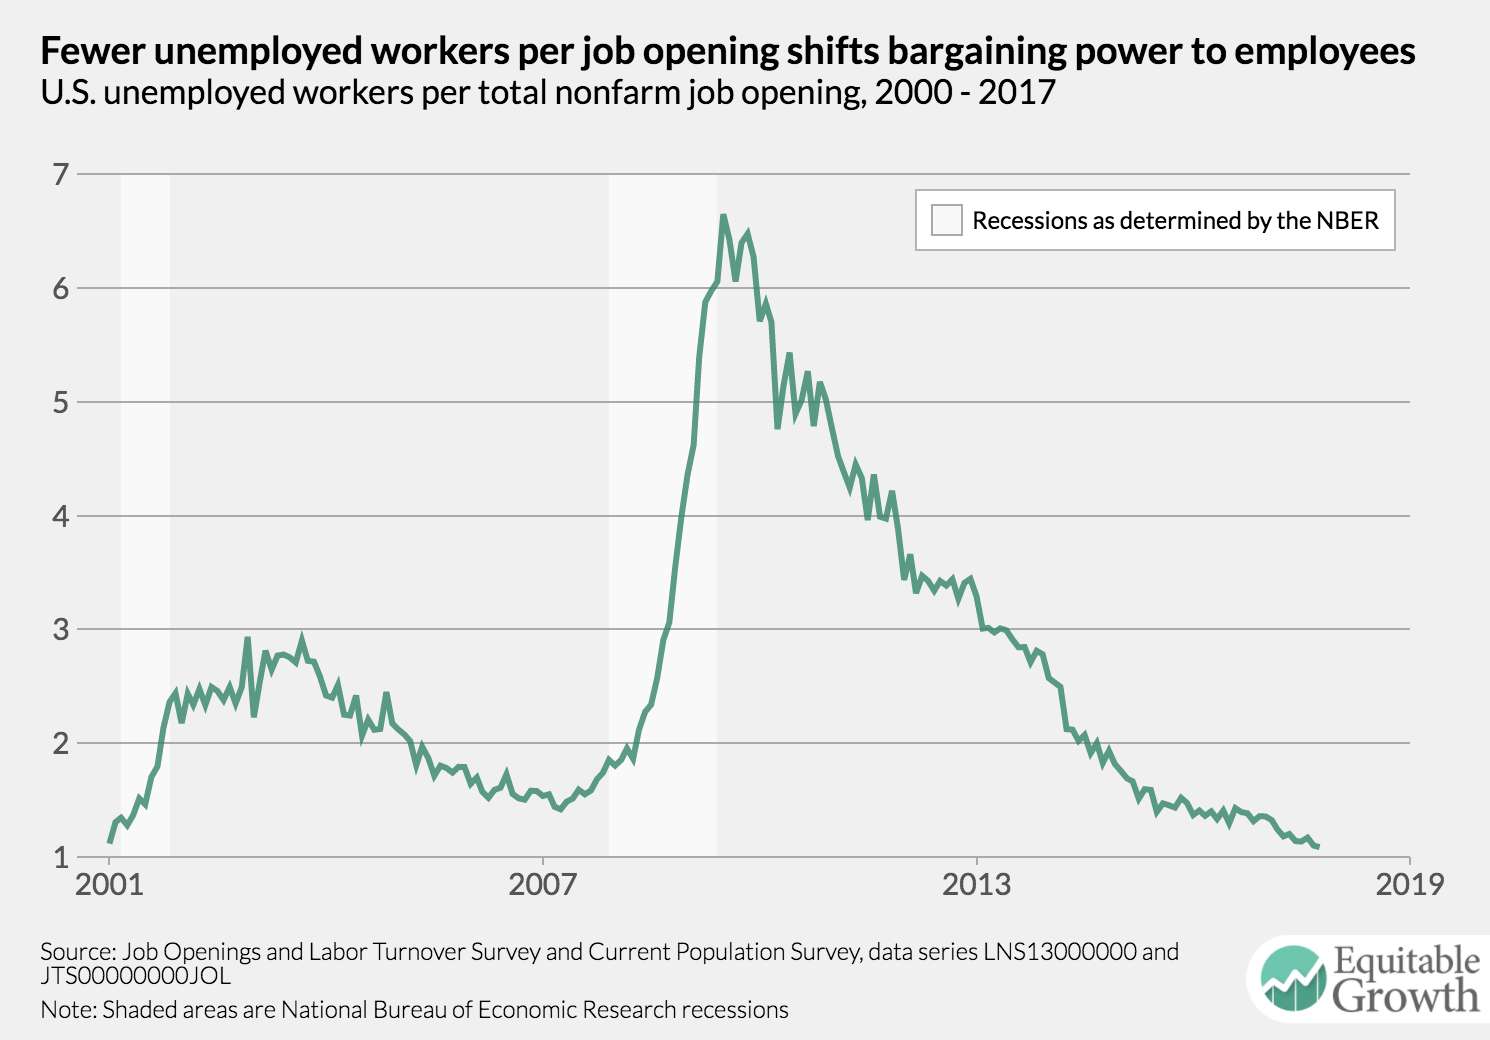
For the second month in a row, however, the ratio of unemployed workers to vacant jobs—an important measure of labor market tightness—reached a new all-time low: 1.08 workers per vacancy. This means workers have more bargaining power with their employers. Once this ratio gets low enough, wage growth should pick up more.
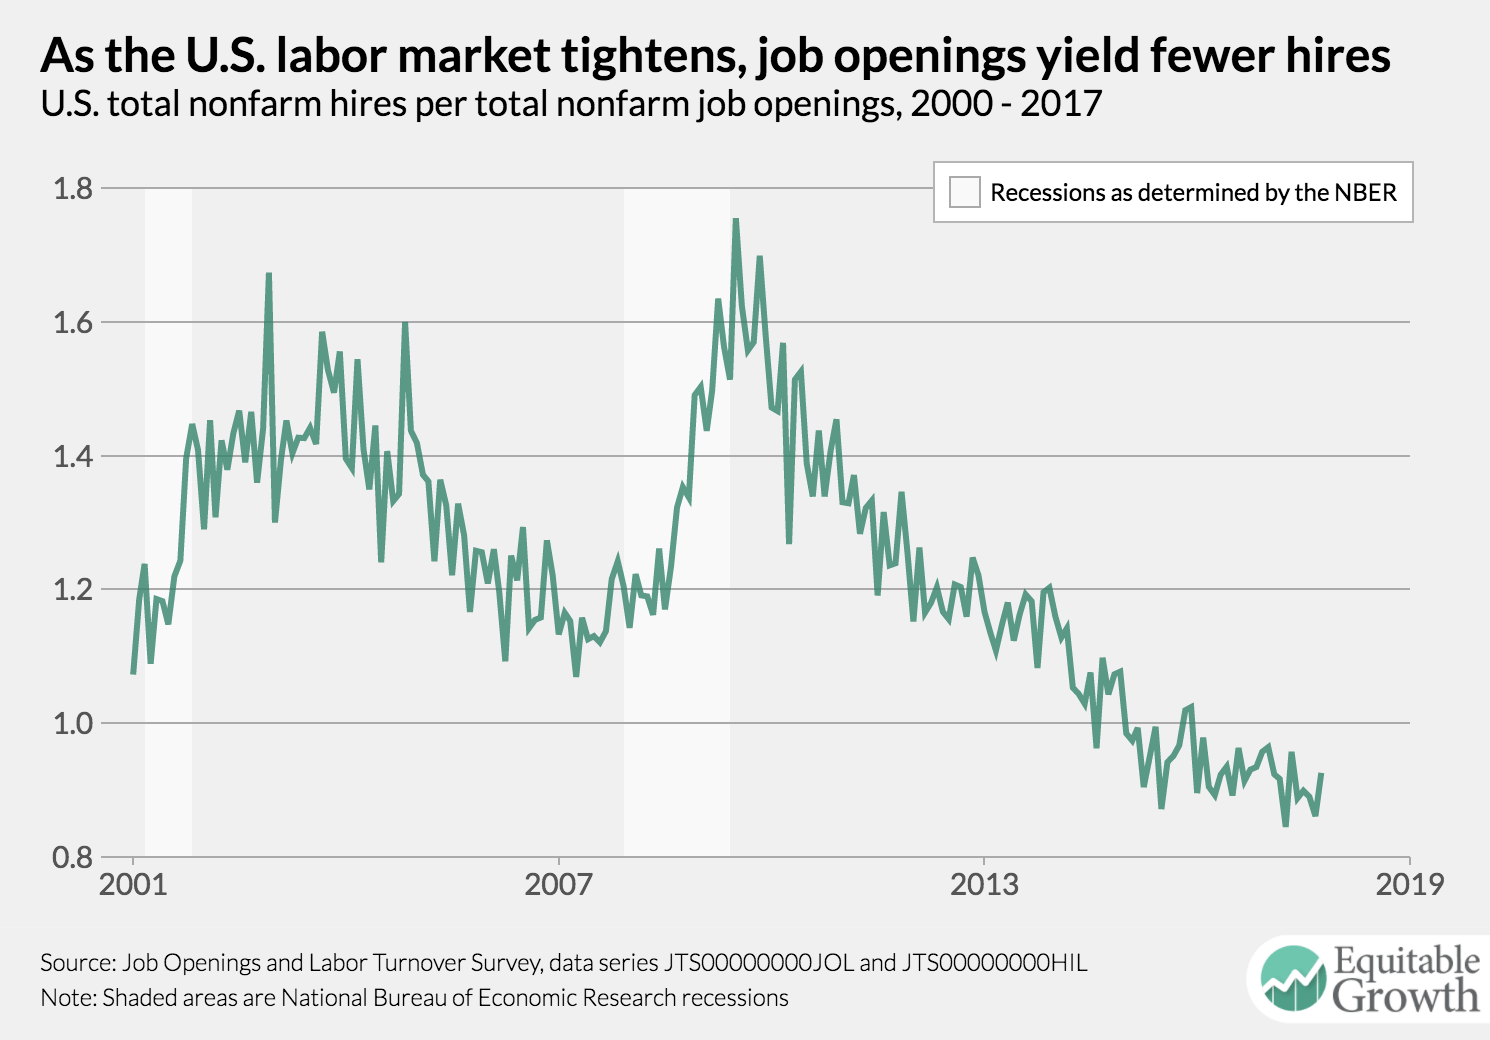
The vacancy yield rose slightly in October—potentially another mixed signal about tightness in the U.S. labor market—but the trend during the recovery has been downward. How much lower the ratio of hires to vacancies is an important question in the debate about how tight the labor market can get.
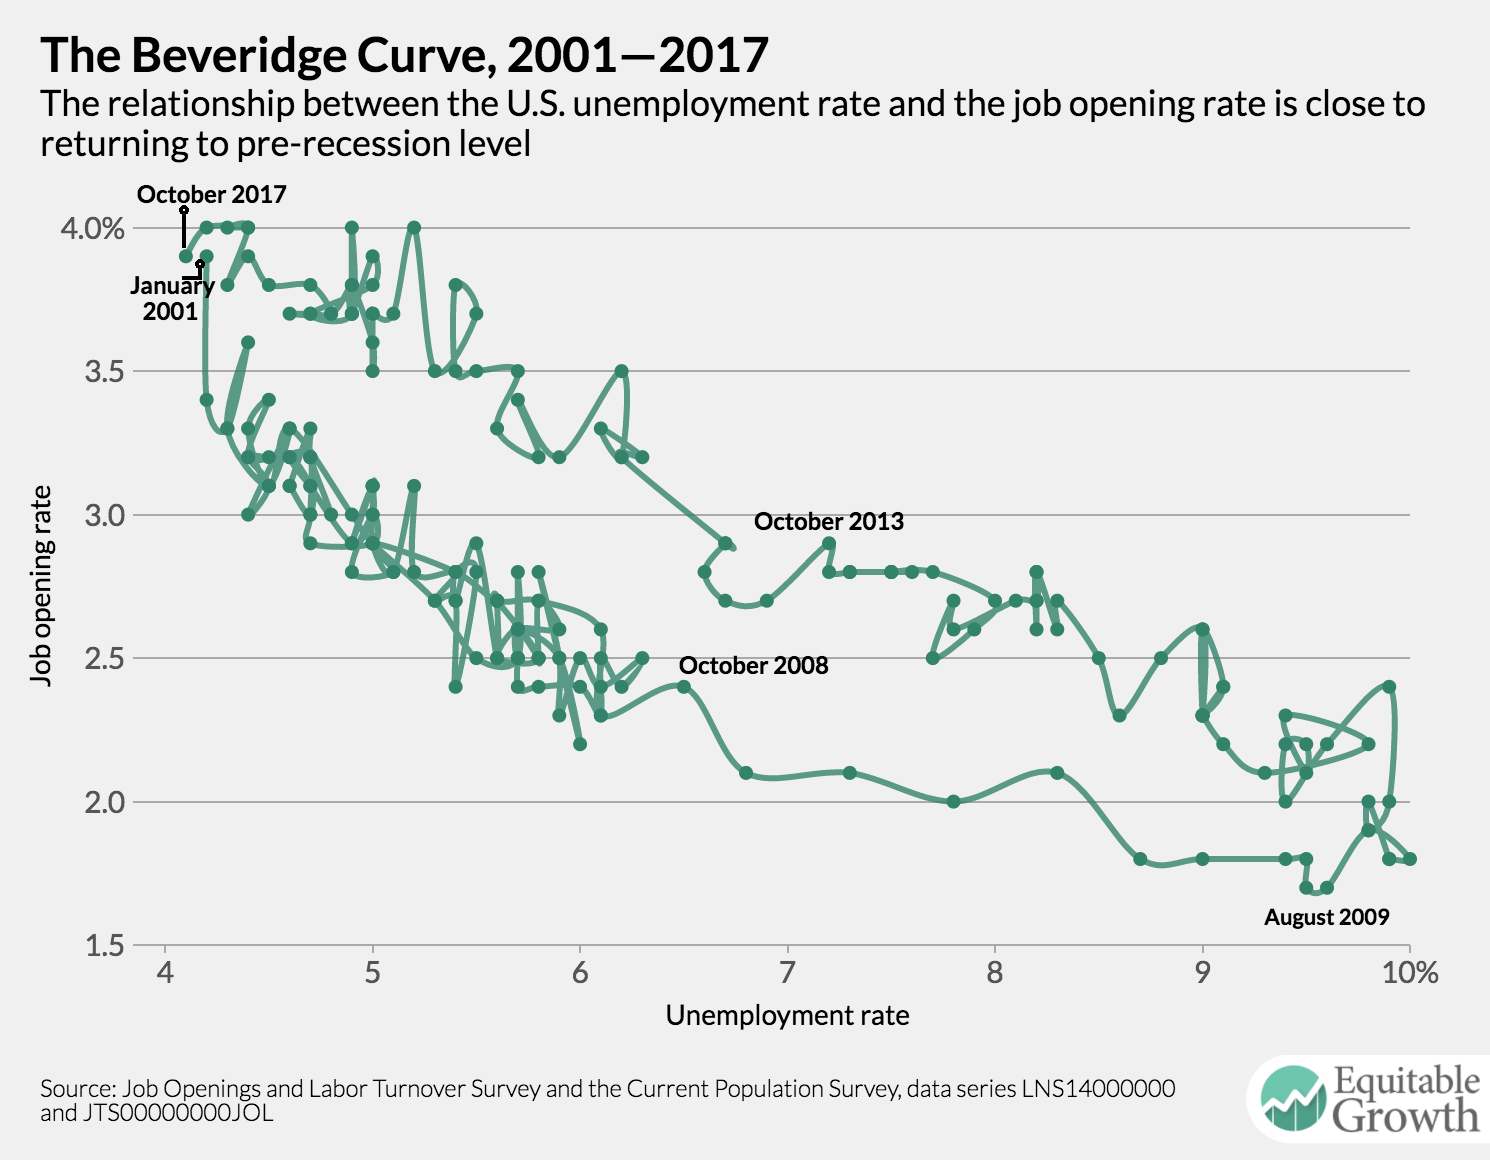
The Beveridge Curve is nearing a return to its pre-recession trend, a potentially encouraging sign that the unemployment rate and the unemployment-to-vacancy ratio could continue to decline.