JOLTS Day Graphs: June 2018 Report Edition
Every month the U.S. Bureau of Labor Statistics releases data on hiring, firing, and other labor market flows from the Job Openings and Labor Turnover Survey, better known as JOLTS. Today, the BLS released the latest data for June 2018. This report doesn’t get as much attention as the monthly Employment Situation Report, but it contains useful information about the state of the U.S. labor market. Below are a few key graphs using data from the report.
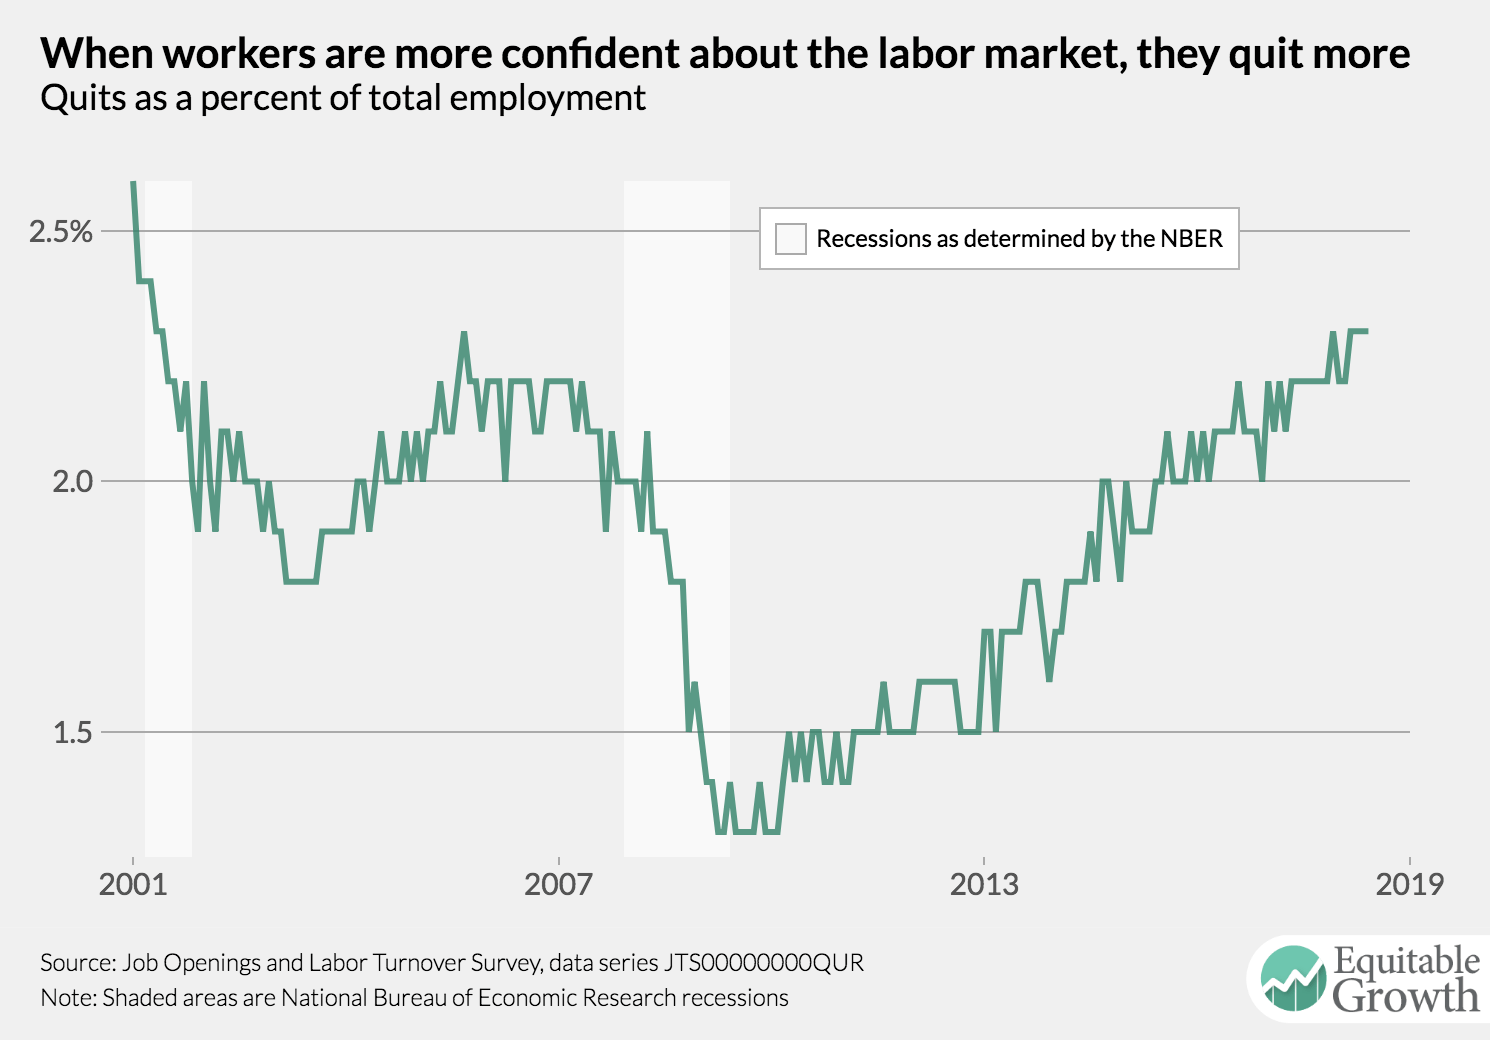
1.
The quit rate held steady for June, maintaining it’s historically high level.
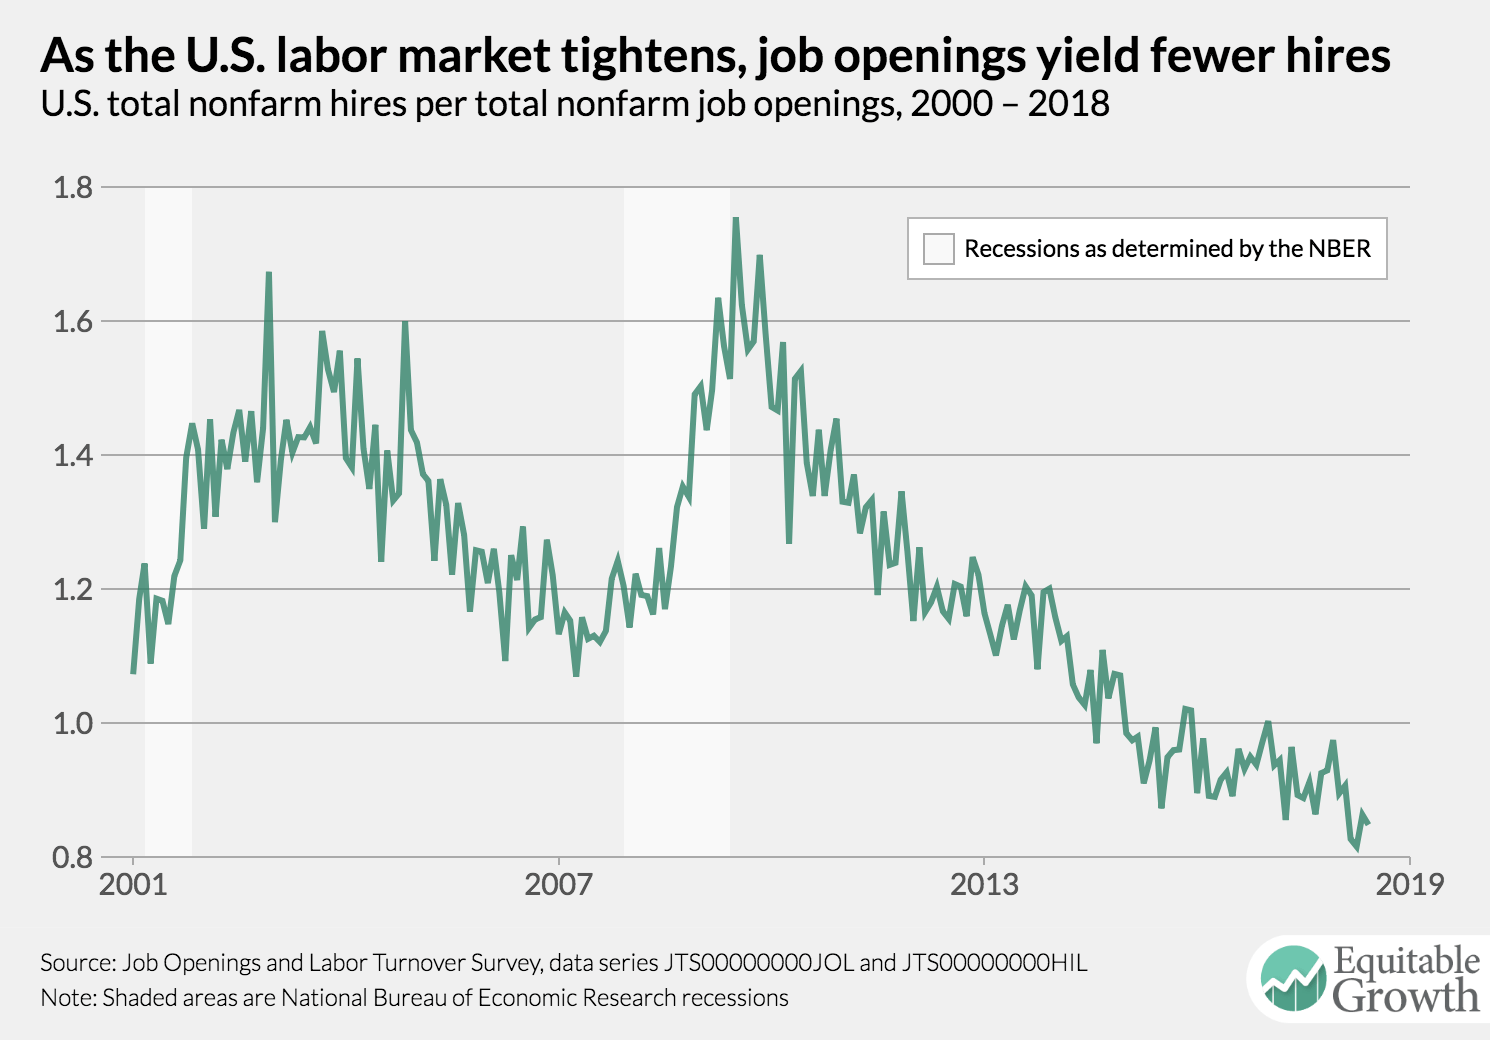
2.
The vacancy yield continued it’s longterm downward trend, declining slightly further from May to June.
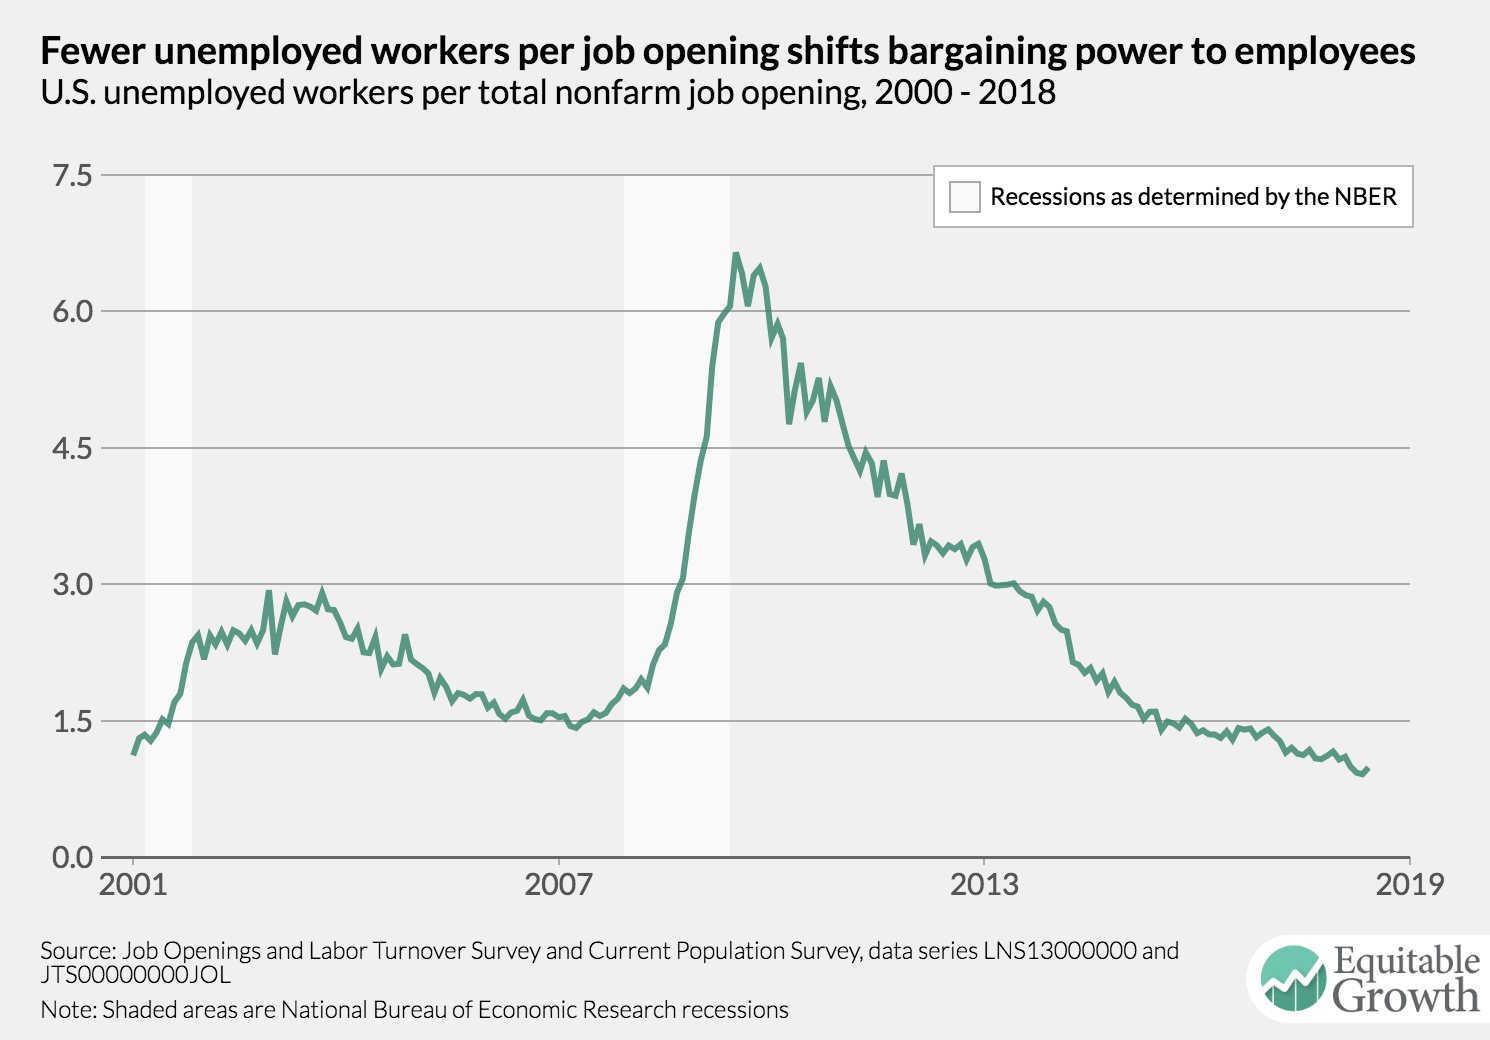
3.
The ratio of unemployment-to-job openings trended upward slightly in June to just under 1.0, indicating that the number of open jobs is about equal to the number of unemployed workers actively looking for work.
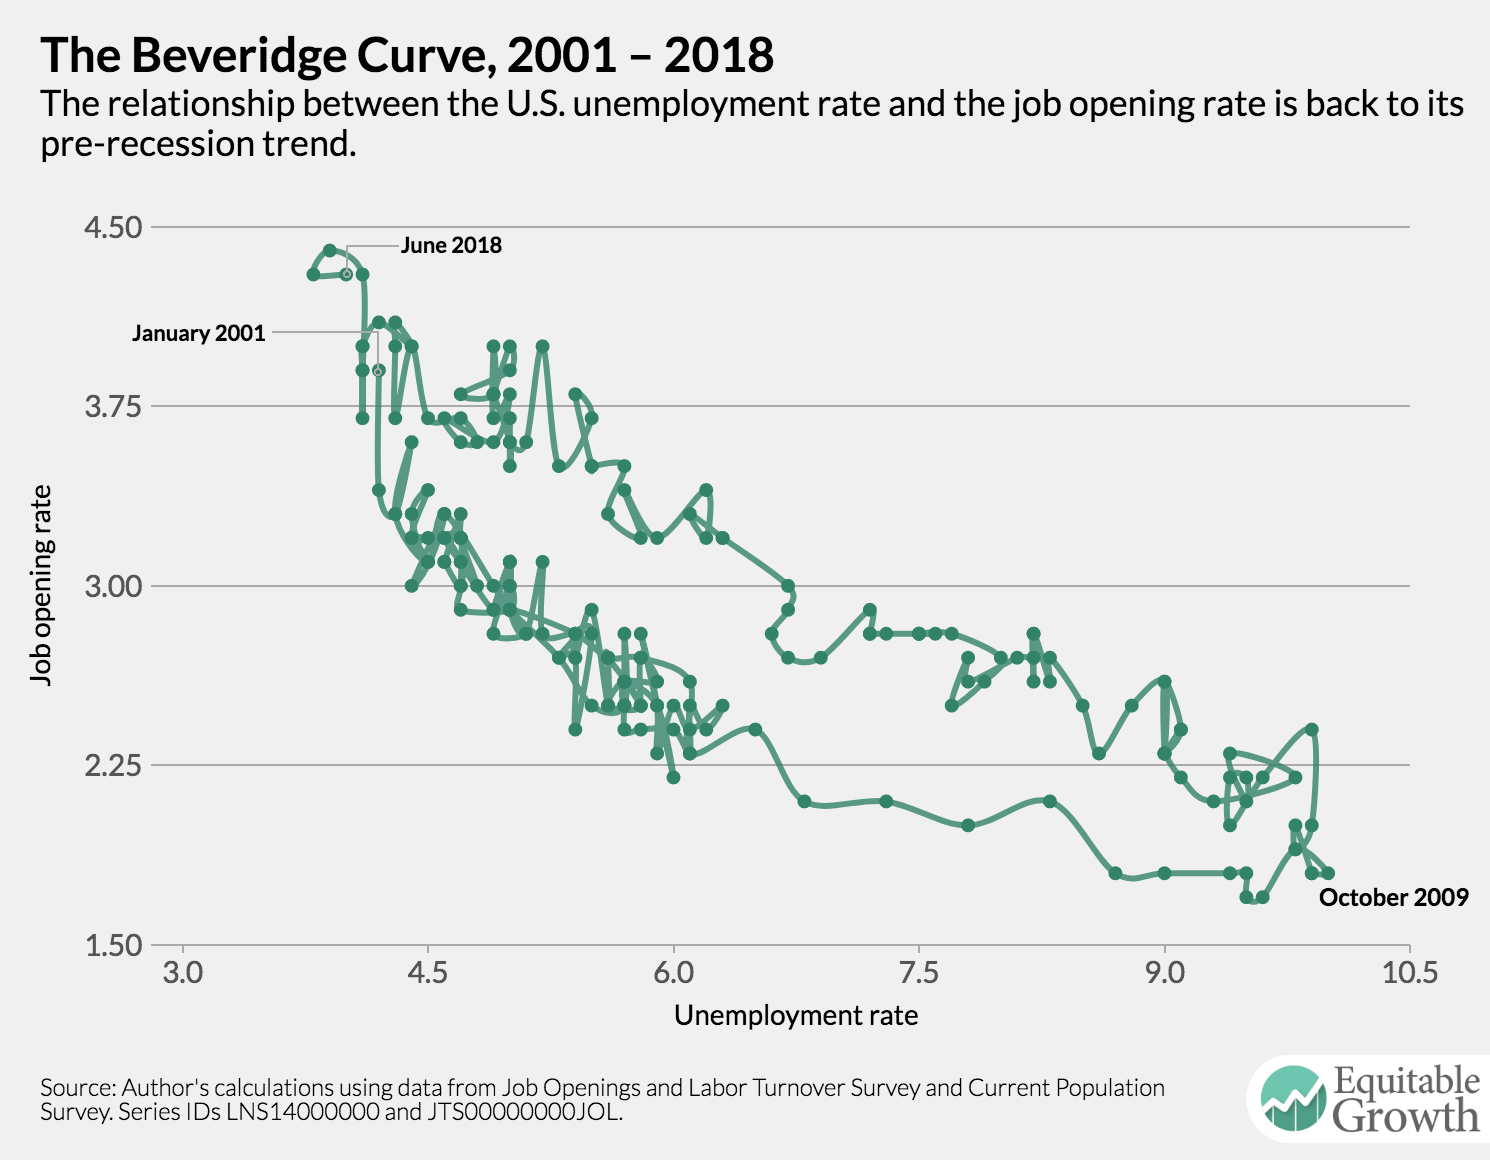
4.
The Beveridge Curve continues to be at levels similar to those in the expansion of the early 2000s.