JOLTS Day Graphs: January 2017 Report Edition
Every month the U.S. Bureau of Labor Statistics releases data on hiring, firing, and other labor market flows from the Job Openings and Labor Turnover Survey, better known as JOLTS. Today, the BLS released the latest data for January 2017. This report doesn’t get as much attention as the monthly Employment Situation Report, but it contains useful information about the state of the U.S. labor market. Below are a few key graphs using data from the report.
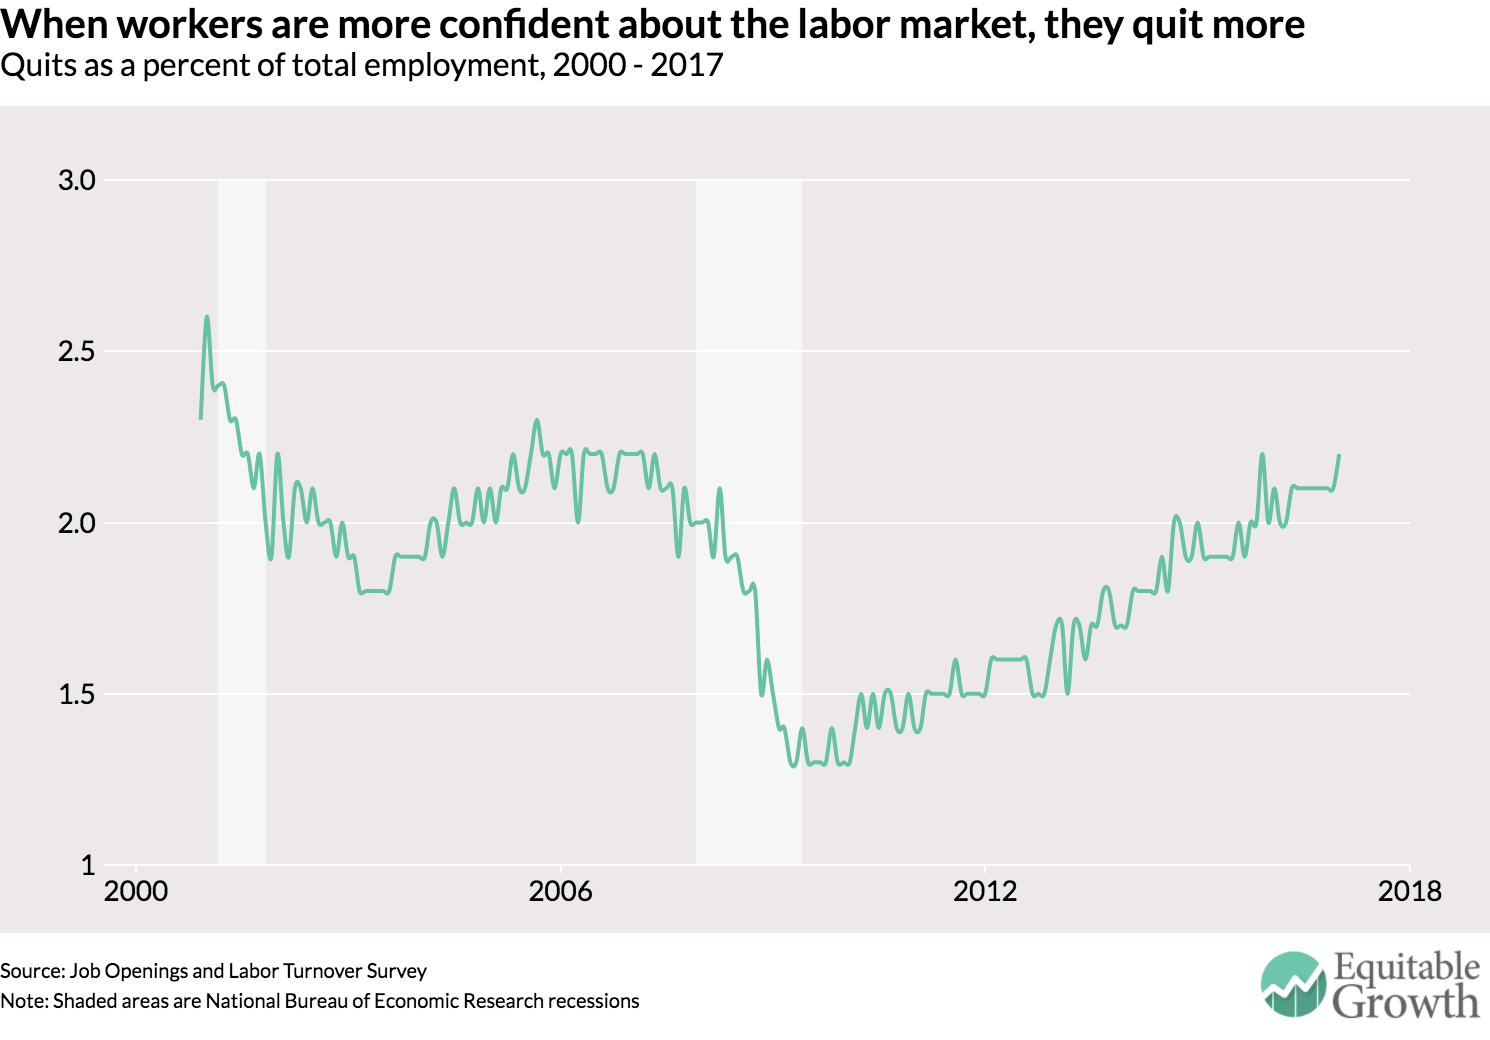
The rate at which U.S. workers are quitting their jobs increased in January to 2.2 percent. That’s close to pre-recession levels, but that might not be a good standard to judge job mobility.
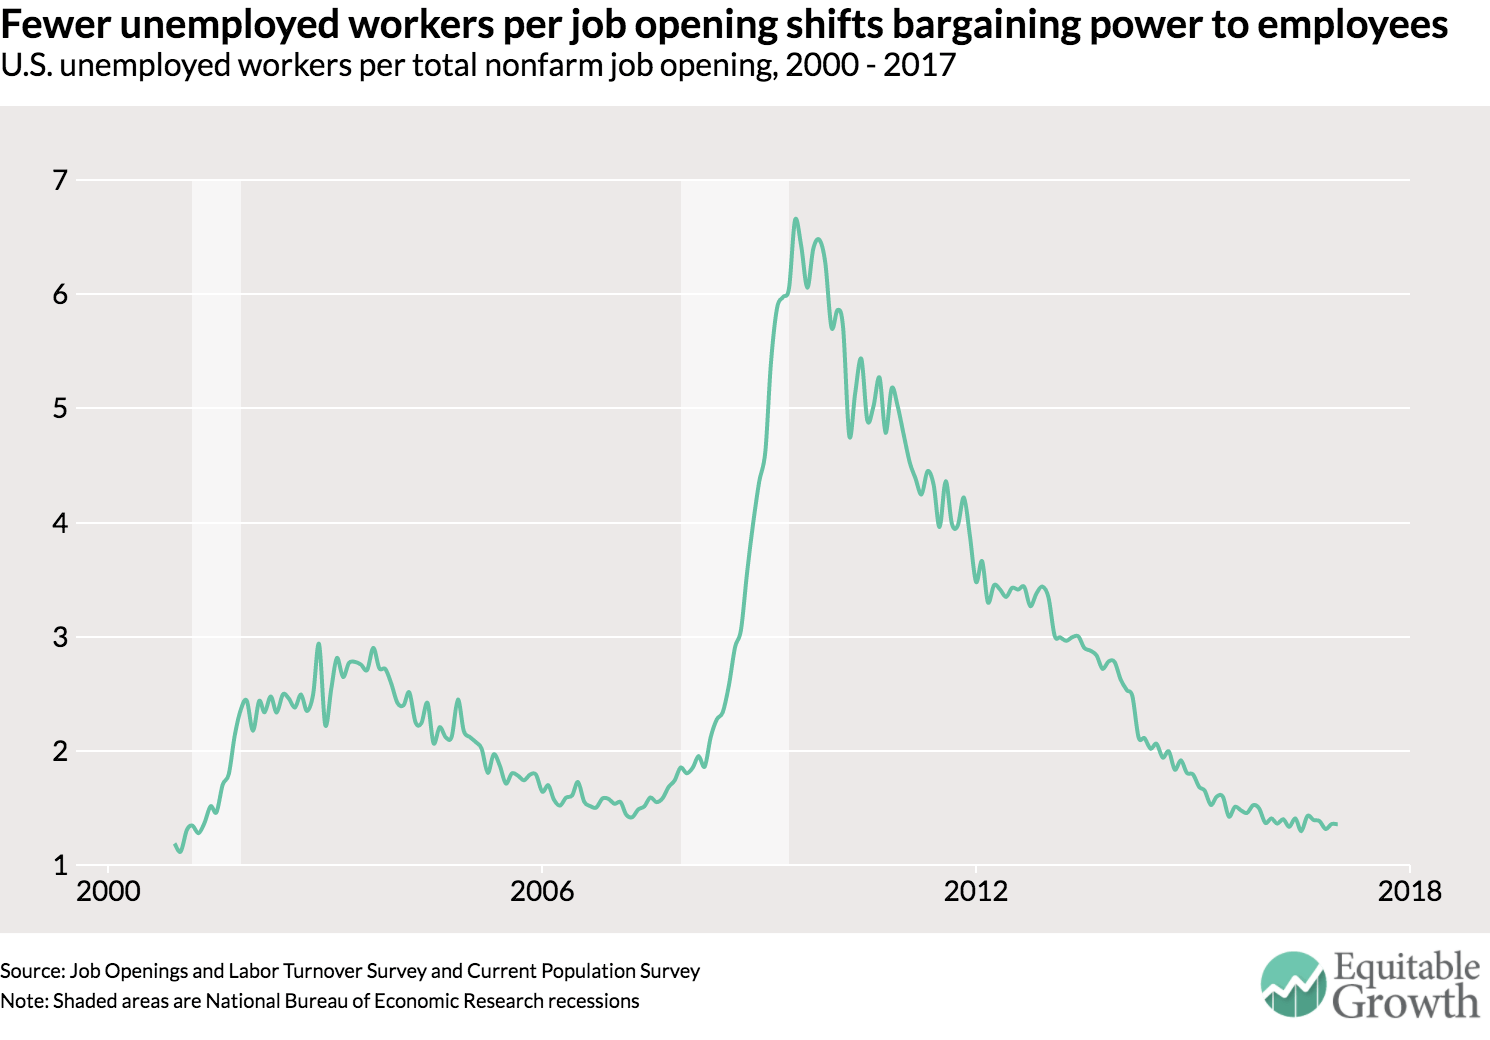
The lack of change in the unemployment-to-job opening ratio is due to both a slowdown in the growth of job openings and leveling of the number of unemployed. If the trend of rising prime-age labor force participation increases, then this ratio could possibly increase.
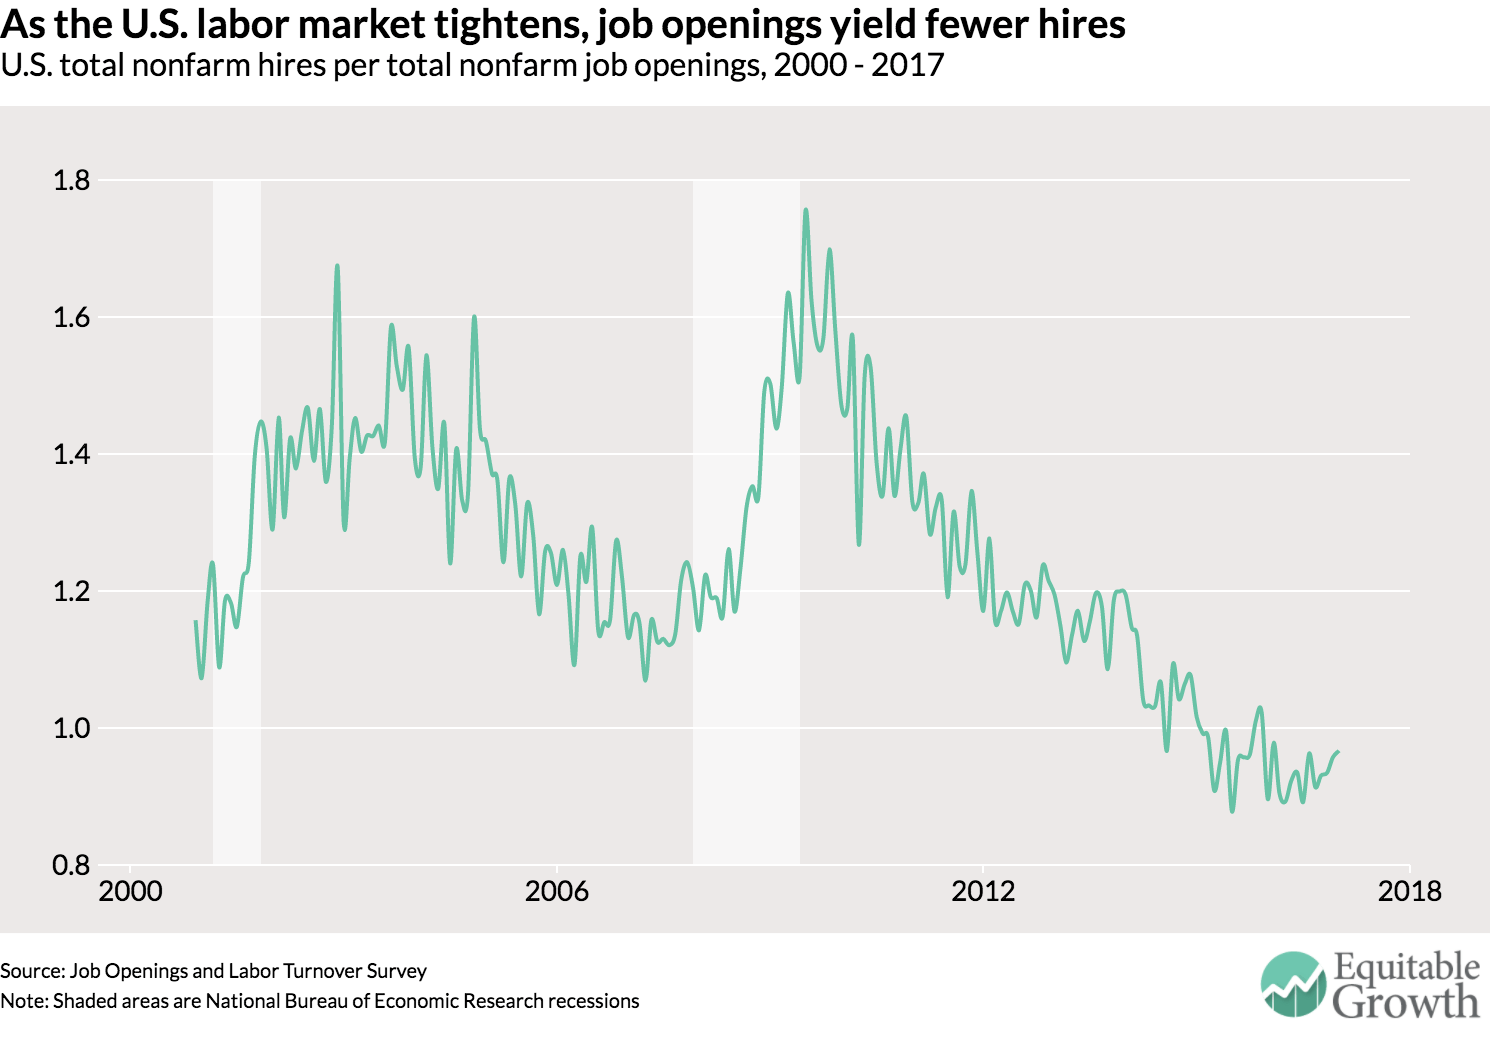
The vacancy yield, or the ratio of hires to job openings didn’t change much in January, perhaps a sign its decline has ended. The decline in hiring appears to be not of unemployed workers, or those out of the labor force, but rather workers already with jobs.