ft animated intro


Finding Time Interactive


image/svg+xml
image/svg+xmlFemale black symbol
1948
Families $27k
Men $21k
Women $9k
87%
33%
1948
1948
Median Incomes, 2014 $
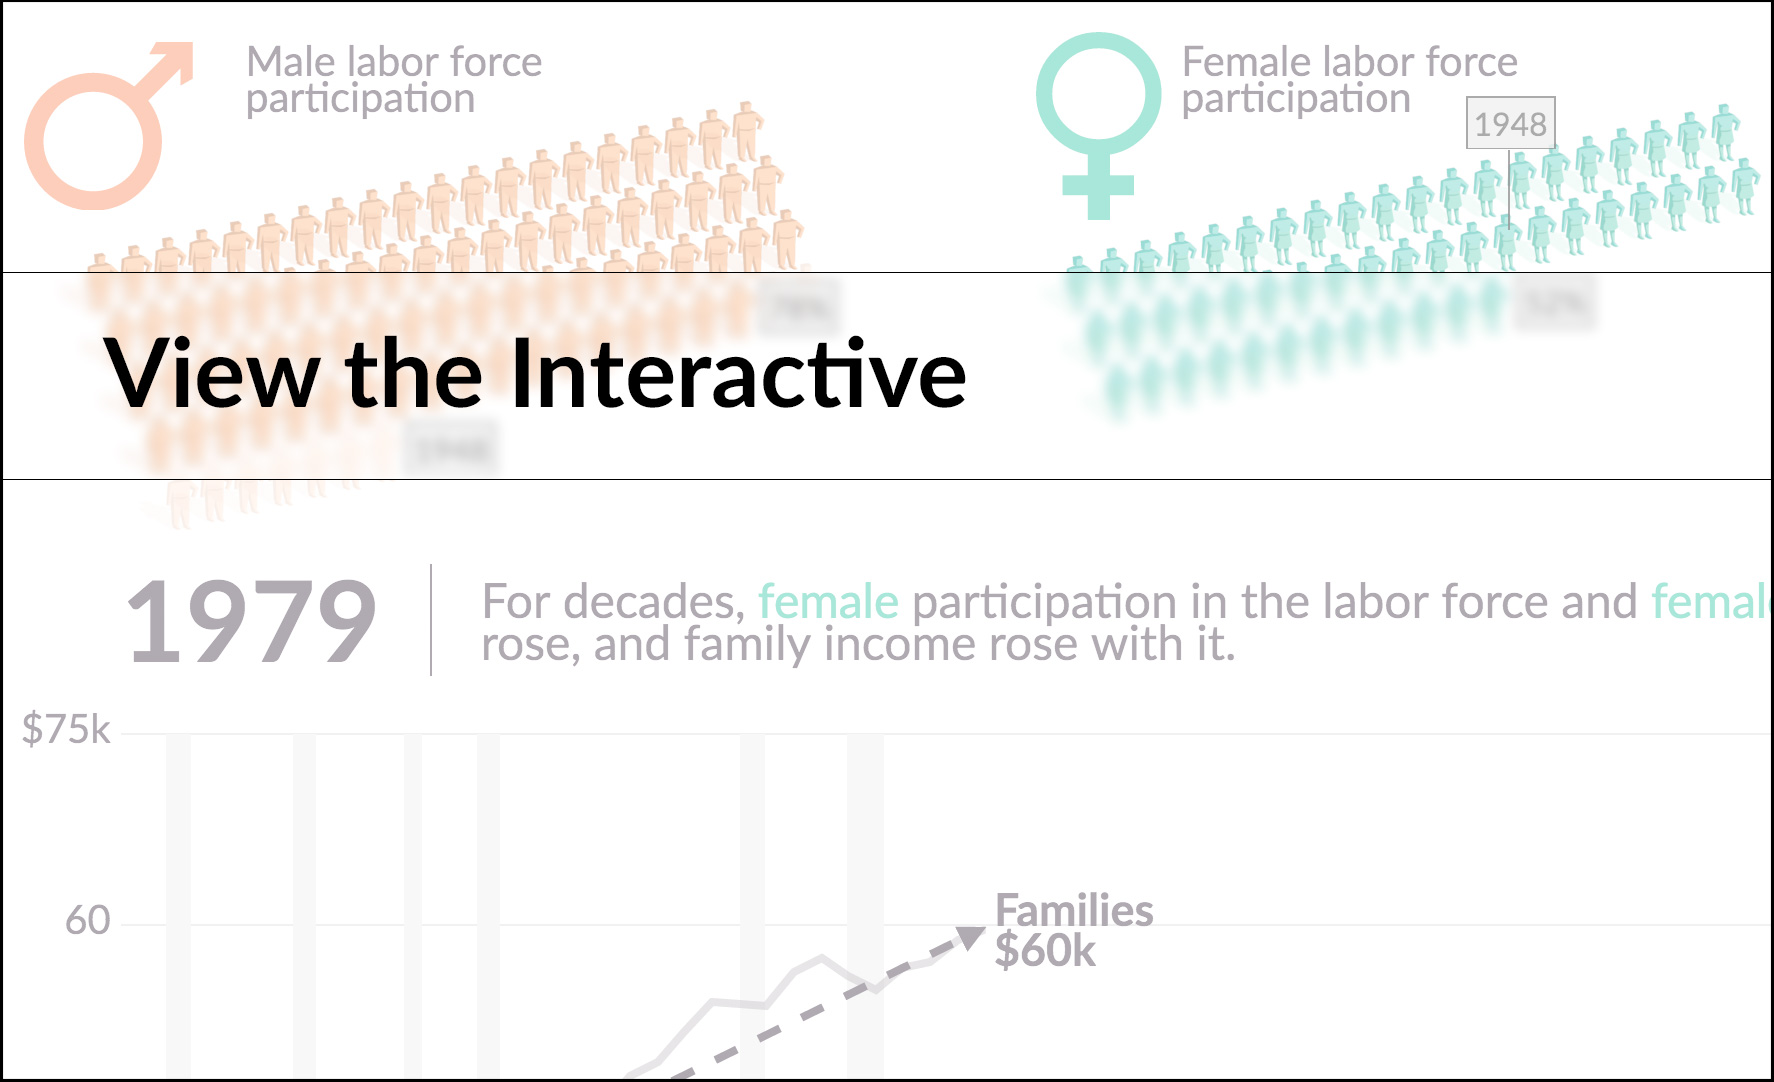
Male labor force participation
Female labor force participation
Scroll down to see how labor force participation and income has changed for men and women since 1948. Recessions are shaded gray.
For decades, female participation in the U.S. labor force and female pay rose, and family income rose with it.
But male labor force participation declined over this same period.
Worse yet, male median income has been stagnant since 1979.
The result is that family incomes grew quickly before 1979 but have risen slowly since.
But the problem isn’t just that incomes are stagnant.

Unlike in 1948, both parents (or a single parent) work.
Mothers are doing more paid work and more child care. Fathers are doing more housework and child care.
So families are working more but incomes are flat.
This isn’t just a problem for families. It’s a problem for our economy.
Facing increasing time and income constraints, workers are less productive, and worker turnover is higher.
The problem is that our workplaces and our economic policies weren’t designed with modern families in mind.


Defining income groups

Defining income groups

This analysis follows the same methodology presented in “Finding Time.” For ease of composition, we use the term “family” throughout the brief, even though the analysis is done at the household level. We split households in our sample into three income groups. Low-income households are those in the bottom third of the income distribution, which means those earning less than $25,440 per year in 2015 dollars. Professional households are those in the top fifth of the income distribution who have at least one household member with a college degree or higher; in 2015 dollars, these households have an income of $71,158 or higher. Everyone else falls in the middle-class category.

Labor participation age brackets


History of Labor Participation by Age Bracket

A history of labor market participation by age bracket
Choose an age bracket to see how labor participation within that bracket has changed over time. Click on an area of the chart to isolate that category.


Recessions are shaded, red lines indicate a major change to the CPS survey.

Note: This chart is updated monthly. Data is from the Census Bureau’s Current Population Survey. Basic monthly data are used and all months are averaged together for each year. The survey was revised in 1989 and 1994; changes to both question wording and survey weights result in discontinuities in these years that may not be attributable to real changes in the economy. Recession data from: Federal Reserve Bank of St. Louis, NBER based Recession Indicators for the United States from the Period following the Peak through the Trough [USREC], retrieved from FRED, Federal Reserve Bank of St. Louis https://research.stlouisfed.org/fred2/series/USREC, March 1, 2016.

School Finance Reform Events

Choose a state:


Note: Low income districts are those with average household-income in the bottom 20% of all in the same state districts. High-income districts are those with average household-income in the top 20% of all districts in the same state. Hawaii was excluded as there is only one school district in Hawaii. “Progressive” school funding means that a state’s low-income districts are receiving more funding per student than high-income districts. “Regressive” school funding means that a state’s low-income districts are receiving less funding than the high-income districts.
Source: Authors’ calculations using our database of school finance reforms, district level finance data from the National Center for Education Statistics’ Common Core of Data school district files, the Census of Governments, demographics from the CCD school universe files, and household distributions from the 1990 Census.


Wage deciles occupations/demographics

Majewski – Interactive Map 2


GeoJson Test


Majewski – interactive map 1


GeoJson Test


us earnings growth

pre-k state header


A benefit-cost analysis of universal prekindergarten through 2050
back to report
Net benefits per capita in 2050:
.
$

Ratio of benefits to costs in 2050:
.
.:1

Years to break even
on investment:
.


pre-k dynamic text